Highest redshift image of neutral hydrogen in emission: A CHILES detection of a starbursting galaxy at
Abstract
Our current understanding of galaxy evolution still has many uncertainties associated with the details of accretion, processing, and removal of gas across cosmic time. The next generation of radio telescopes will image the neutral hydrogen (HI) in galaxies over large volumes at high redshifts, which will provide key insights into these processes. We are conducting the COSMOS H I Large Extragalactic Survey (CHILES) with the Karl G. Jansky Very Large Array, which is the first survey to simultaneously observe H I from to . Here, we report the highest redshift H I 21-cm detection in emission to date of the luminous infrared galaxy (LIRG) COSMOS J100054.83+023126.2 at z=0.376 with the first 178 hours of CHILES data. The total H I mass is , and the spatial distribution is asymmetric and extends beyond the galaxy. While optically the galaxy looks undisturbed, the H I distribution suggests an interaction with candidate a candidate companion. In addition, we present follow-up Large Millimeter Telescope CO observations that show it is rich in molecular hydrogen, with a range of possible masses of . This is the first study of the H I and CO in emission for a single galaxy beyond .
1. Introduction
Galaxy evolution studies have been hampered by the lack of neutral hydrogen (H I ) images across cosmic time. The H I 21-cm line has been used extensively to study nearby galaxies since it is the raw fuel for star formation, probes internal properties, and serves as an excellent environmental tracer (e.g., Haynes et al. 1984; Walter et al. 2008; Chung et al. 2009). Due to technical limitations, not much is known about H I in distant galaxies but this will soon change with the next generation of radio telescopes. H I imaging at will help constrain the evolution of the interstellar medium (ISM), and possibly explain observed phenomena at high redshift, such as the decline in the star formation rate (SFR) since (Hopkins & Beacom 2006).
Over the past 15 years, several studies have started to uncover the H I content beyond . Targeted surveys have observed H I for a limited number of galaxies at higher redshift (e.g., Zwaan et al. 2001; Catinella & Cortese 2015). Long integration times are necessary to detect H I emission from distant galaxies since the signal is very weak. As a consequence, many studies use indirect methods such as stacking and intensity mapping to attain a statistical measure of how much H I there is in the interval (e.g., Lah et al. 2007; Chang et al. 2010; Masui et al. 2013; Delhaize et al. 2013; Geréb et al. 2013).
New technology now allows telescopes to carry out H I observations with large instantaneous frequency coverage. The first survey to do this is the Blind Ultra Deep H I Environmental Survey (BUDHIES), which detected H I in over 150 galaxies in and around two clusters at (Verheijen et al. 2007). The recently upgraded Karl G. Jansky Very Large Array (VLA)111The National Radio Astronomy Observatory is a facility of the National Science Foundation operated under cooperative agreement by Associated Universities, Inc. can now observe the interval in one setting. We did a pilot study during commissioning that covered the interval (Fernández et al. 2013). We reached the theoretical noise over the entire frequency range, demonstrating the feasibility of an H I deep field. We are now conducting the COSMOS H I Large Extragalactic Survey (CHILES) with the VLA, a 1002 hr survey where we expect to directly image the H I distribution and kinematics of at least 300 galaxies in the COSMOS field from to , with at least 200 of these at . These estimates are done by comparing our sensitivity curve (assuming a 150 km s-1 width) to the H I masses predicted for spectroscopically confirmed galaxies in the observed volume using the scaling relation from Catinella et al. (2012).
Here, we report the H I detection of the Luminous Infrared Galaxy (LIRG) COSMOS J100054.83+023126.2 (henceforth J100054) at with the first 178 hr of CHILES data. In addition, we include CO observations from the Large Millimeter Telescope Alfonso Serrano (LMT), and follow-up optical spectroscopic data that confirm the redshift of the detection. This study not only represents the highest redshift H I detection in emission, but is the first time we can study the cold gas content (both molecular and atomic hydrogen) of a galaxy at .
This letter adopts km s-1 Mpc-1, , and , and a Kroupa (2001) initial mass function.
2. Observations and Results
2.1. Cold gas properties
2.1.1 CHILES: HI detection at z=0.376
We are observing one pointing in the COSMOS field with the B configuration of the VLA, which corresponds to a spatial resolution of kpc at . The first 178 hr (Phase I) were observed in 2013 (Momjian et al, in prep).
For this preliminary study, we imaged the interval ( MHz) which includes a wall with over 250 galaxies with spectroscopically known redshifts, and 60 of these have predicted . The cube was made with robustness parameter of 0.8 in CASA, has a spatial scale of of 2 pixels, and a total of 320 channels of 62.5 kHz ( km s-1 at ). We first Hanning smooth the data to increase the S/N and then iteratively subtract the continuum in the image plane, leading to a typical noise per channel of 75 Jy beam-1. We search for H I by eye around a subset of the 60 predicted gas-rich galaxies. We are still in the process of searching for H I around other galaxies directly and via stacking.
We detect H I in the galaxy J100054, which has a predicted . The H I channel maps (Figure 1a) show that the emission is mostly at the level (with a peak at the position of the galaxy). Although the emission is weak, we trust the detection since the signal is at the location and velocity of the galaxy, and appears in several consecutive independent channels. The emission is seen in 7 panels making it 875 kHz wide, which translates to a velocity width of km s-1 after correcting for the channel width. We calculate assuming that the center of the emission is in panel 5. We have high confidence in the emission seen in panels 2-5 since it is at the level, with a smooth velocity gradient, and there are no negative contours of high significance. The emission in panels 6-8 is weaker and its velocity does not follow a clear pattern. We generate the total H I distribution map (Figure 1b) by adding the emission seen in the 7 channels after smoothing and applying a cutoff. We also make a moment map excluding the emission seen in panels 6-8, and the morphology is almost identical. We calculate for both maps, for the one presented here and from the map only including panels 2-5, showing that the H I in panels 6-8 does not contribute much. As seen in Figure 1b, the H I is asymmetric and very extended, encompassing some potentially nearby companions. Since the low-level emission in the southern extension is rather sensitive to the noise, the morphology is uncertain. We also include two integrated H I spectra in Figure 1c, one that integrates over the optical disk of the galaxy, and another one that is centered on the H I emission. We calculate a S/N=7 from the H I spectrum by adding up the signal in the range 1031.5-1032.5 MHz, and dividing by the rms calculated in the range 1033-1038 MHz (taking into account the number of channels). Lastly, Figure 1d is a position velocity (PV) diagram that further shows the significance of the detection.
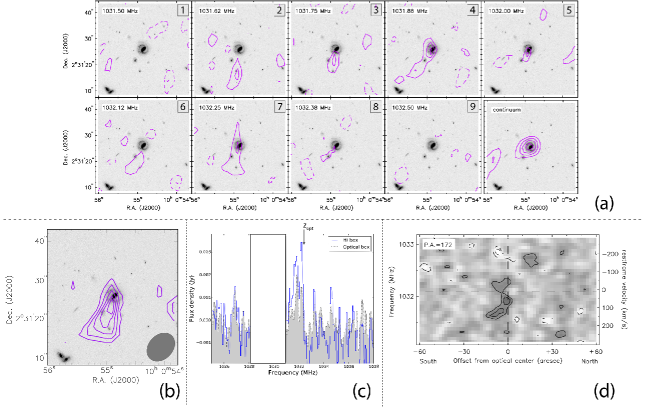
The last panel of Figure 1a shows the continuum emission from the line-free channels. In addition, we have continuum data from the commensal survey CHILES Continuum Polarization (CHILES Con Pol)222http://www.chilesconpol.com. The source has a total flux density of Jy at 1.45 GHz, which is consistent with our measurement and the COSMOS-VLA data (Schinnerer et al. 2007). We measure a spectral index of , which is the typical value for star-forming galaxies (e.g. Magnelli et al. 2015).
2.1.2 CO Observations with the LMT
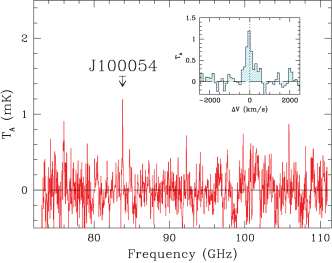
As a follow-up to our H I detection, we observed J100054 using the Redshift Search Receiver (RSR) at the LMT (Erickson et al. 2007) on April 8 and May 21, 2015 for 1 hr each, under excellent weather conditions ( K). The spectrum covering a frequency range GHz is obtained with a spectral resolution of 31.25 MHz (110 km s-1 at ) to search for possible CO(1–0) emission. The effective beam size is at 84 GHz, and telescope pointing is checked on the nearby QSO J0909+013 before each observing session. When averaged together with the weight, the final spectrum has an rms noise of mJy.
A single bright line is detected with a S/N = 9.7 centered at 83.7816 GHz (Fig. 2), and is interpreted as that of the CO(1–0) transition at . This line is fully resolved, as shown by the zoom-in spectrum shown in the inset, and the derived FWHM is km s-1 after correcting for the instrumental resolution. The narrow CO line peak (FWHM is km s-1), centered on the optical redshift , sits atop a broad base, which accounts for the observed broad line width. The measured CO line integral of Jy km s-1 translates to K km s-1 pc2. The H2 mass depends on the adopted conversion factor, which ranges from /(K km s-1 pc2) for interacting galaxies (Downes & Solomon 1998) to the Galactic conversion factor of /(K km s-1 pc2) (Bolatto et al. 2013). This results in a range of possible values of .
2.2. Additional data
2.2.1 COSMOS multiwavelength data
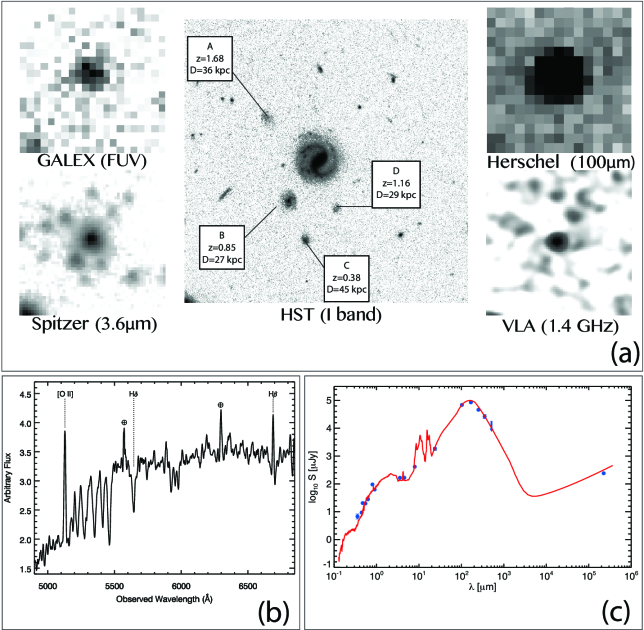
As J100054 is located within the COSMOS field, extensive multiwavelength data are available, and it is detected in ultraviolet (UV), optical, IR, and by the VLA-COSMOS continuum survey. A deep HST I-band image of J100054 (Figure 3a) shows that it is a massive regular barred spiral with clear spiral arms and a prominent bulge. In addition, it shows a number of fainter galaxies suggesting that this may be a small group. The information for the possible companions is scarce, as the four are very faint with and only have measured photometric redshifts. Only one of the companions has a photometric redshift similar to J100054, but spectroscopic data are necessary to confirm this and determine whether the other ones are indeed background objects.
2.2.2 Optical spectroscopic confirmation
We obtained an additional long-slit spectrum with the SOAR 4.1m telescope and the Goodman High Throughput Spectrograph on 2015 April 17 to confirm the redshift of J100054. A slit of 1.68′′ width was oriented north-south on the galaxy, and the 400 l/mm grating yielded spectral coverage 3500–7500Å at a resolution of . The 1 hour exposure confirms a galaxy at with strong [OII] 3727Å emission and Balmer absorption, indicating a post-starburst stellar population. The spectrum shows no signs of AGN activity, as seen in Figure 3b.
2.2.3 Spectral Energy Distribution (SED) Fitting
The optical and IR counterparts are found exploiting the likelihood ratio technique (Sutherland & Saunders 1992) with the optical photometric data (Capak et al. 2007), Spitzer Space Telescope MIPS 24 m (Le Floc’h et al. 2009) and Herschel Space Observatory (Lutz et al. 2011; Oliver et al. 2010). The best-fit SED is obtained through the (Arnouts et al. 1999; Ilbert et al. 2006) with the M82 galaxy template for the optical-mid IR regime and the Chary-Elbaz galaxy template for the far-IR regime at the fixed redshift of . The best-fit SED yields the total ( ) and the ( ) , confirming that this object is a LIRG.
2.2.4 Stellar Mass and SFR Estimate
We compute using the Spitzer IRAC data (Eskew et al. 2012). Following Murphy et al. (2011), we calculate the SFR using the FUV, IR, and radio data: SFR () yr-1, SFR () yr-1, and SFR () yr-1 (errors come from the photometric uncertainties). The SFRFUV is negligible, indicating that most of the star-formation is dust-obscured. We adopt SFRIR for the rest of the paper.
3. Discussion
3.1. Unusual spiral galaxy
While the optical image shows J100054 to be a large normal spiral, the cold gas properties depict a more complex picture. The H I mass agrees with the predicted one, but its distribution and kinematics are unexpected. The H I suggests the possibility of a gravitational interaction, as the H I looks very disturbed. Many studies have reported SFR enhancement in interacting pairs. In particular, in the case of a minor merger, the more massive companion experiences a stronger SFR enhancement than the less massive one (e.g., Scudder et al. 2012; Davies et al. 2015). Spectroscopic data are necessary to determine whether the nearby galaxies are at the same redshift.
In addition, the galaxy is extremely H2 rich, with a value that is even unexpected for local (U)LIRGs. The for this system is approximately 6 times higher than objects with similar in a sample of local (U)LIRGs (G. Privon, in prep). Here we present a range of possible values for (depending on ) but we note that is still a matter of debate even for extreme (U)LIRGs such as Arp 220 (Scoville et al. 2015). The CO spectrum suggests there might be two components, a broad one and a narrow one. The FWHM of the narrow component is consistent with the H I width within the uncertainties. The broad component could be emission from neighboring galaxies included in the large beam. We note, however, that the galaxies are fairly small and we do not expect significant contribution. The more likely explanation is an outflow such as those seen for local (U)LIRGs (e.g. Chung et al. 2011).
3.2. Comparison with other samples
Figure 4 explores whether the gas properties are unusual for a galaxy with that and SFR when compared to the properties of galaxies found in other surveys (see caption for details and references). Figure 4a compares the H I mass and of J100054 to systems found in other surveys. As seen, J100054 is rich in atomic gas when compared to ALFALFA and GASS, and in fact has as much H I as the most H I -rich galaxies at . Figure 4b shows (instead of H2 mass to avoid issues with ) as a function of . The plot shows that most galaxies have lower , only those at have comparable values to J100054. The third plot shows SFR as a function of (Figure 4c). This is usually plotted as vs , but here we choose SFR since some of the samples do not have published . From this plot, we can infer that J100054 has a relatively low star formation efficiency since it lies below the line that marks the SFR- relation (commonly known as the “main sequence”). Lastly, we look at the SFR for different (Figure 4d). J100054 is just above the starburst threshold, which is defined as four times the SFR- relation (Rodighiero et al. 2011). In summary, these four plots show that J100054 is gas-rich both in molecular and atomic gas, but its SFR is somewhat low given its .
3.3. ISM studies at intermediate redshift
Lastly, we emphasize this is the first time we observe both the CO and H I from a galaxy beyond the local Universe (). In Figure 5 we show how the gas fraction and / ratio vary with redshift for three surveys: COLD GASS, BUDHIES (Verheijen et al. 2007; Cybulski et al. 2015), and CHILES. These limited data suggest that if we assume , both the gas fraction and ratio of H2/H I go up with increasing redshift and that J100054 is above the median seen in surveys at and . If we adopt , the gas fraction is still high when compared to other surveys, but the mass ratio is comparable to galaxies at . We can not draw strong conclusions with only one data point but we will soon be able to start populating these plots with upcoming CHILES results and follow-up observations with the LMT. This will be further complemented by the upcoming surveys that will be conducted with ALMA, and the SKA and its precursors in the next decade.
In addition to probing the general galaxy population, we can also start to probe the evolution of (U)LIRGs. We know these systems correspond to mergers in the local Universe, but there is disagreement on the merger contribution at higher redshifts (e.g., Kartaltepe et al. 2010). Future H I and H2 data will allow us to understand these systems better and probe their ISM across cosmic time.
4. Summary
We presented the first comprehensive study of the gas content (H I and H2) of a galaxy at intermediate redshifts. We summarize our main findings below:
-
•
We detected the highest redshift H I in emission to date from a very gas-rich system (). Its H I mass is similar to the most gas-rich galaxies locally known and consistent with what is expected from its stellar properties.
-
•
J100054 is also gas-rich in H2, with a mass range of . The CO luminosity is higher than what is expected for a galaxy with that stellar mass ( ) and SFR (85 yr-1).
-
•
In comparison to other samples, the CO properties suggests J100054 is similar to star-forming galaxies at .
References
- Arnouts et al. (1999) Arnouts, S., Cristiani, S., Moscardini, L., et al. 1999, MNRAS, 310, 540
- Bauermeister et al. (2013) Bauermeister, A., Blitz, L., Bolatto, A., et al. 2013, ApJ, 768, 132
- Bolatto et al. (2013) Bolatto, A. D., Wolfire, M., & Leroy, A. K. 2013, ARA&A, 51, 207
- Capak et al. (2007) Capak, P., Aussel, H., Ajiki, M., et al. 2007, ApJS, 172, 99
- Catinella & Cortese (2015) Catinella, B., & Cortese, L. 2015, MNRAS, 446, 3526
- Catinella et al. (2012) Catinella, B., Schiminovich, D., Kauffmann, G., et al. 2012, A&A, 544, A65
- Chang et al. (2010) Chang, T.-C., Pen, U.-L., Bandura, K., & Peterson, J. B. 2010, Nature, 466, 463
- Chung et al. (2009) Chung, A., van Gorkom, J. H., Kenney, J. D. P., Crowl, H., & Vollmer, B. 2009, AJ, 138, 1741
- Chung et al. (2011) Chung, A., Yun, M. S., Naraynan, G., Heyer, M., & Erickson, N. R. 2011, ApJ, 732, L15
- Cybulski et al. (2015) Cybulski, R., Yun, M. S., Erickson, N., et al. 2015, ArXiv e-prints, arXiv:1510.08450
- Davies et al. (2015) Davies, L. J. M., Robotham, A. S. G., Driver, S. P., et al. 2015, MNRAS, 452, 616
- Delhaize et al. (2013) Delhaize, J., Meyer, M. J., Staveley-Smith, L., & Boyle, B. J. 2013, MNRAS, 433, 1398
- Downes & Solomon (1998) Downes, D., & Solomon, P. M. 1998, ApJ, 507, 615
- Erickson et al. (2007) Erickson, N., Narayanan, G., Goeller, R., & Grosslein, R. 2007, in Astronomical Society of the Pacific Conference Series, Vol. 375, From Z-Machines to ALMA: (Sub)Millimeter Spectroscopy of Galaxies, ed. A. J. Baker, J. Glenn, A. I. Harris, J. G. Mangum, & M. S. Yun, 71
- Eskew et al. (2012) Eskew, M., Zaritsky, D., & Meidt, S. 2012, AJ, 143, 139
- Fernández et al. (2013) Fernández, X., van Gorkom, J. H., Hess, K. M., et al. 2013, ApJ, 770, L29
- Gao & Solomon (2004) Gao, Y., & Solomon, P. M. 2004, ApJS, 152, 63
- Geach et al. (2011) Geach, J. E., Smail, I., Moran, S. M., et al. 2011, ApJ, 730, L19
- Geréb et al. (2013) Geréb, K., Morganti, R., Oosterloo, T. A., Guglielmino, G., & Prandoni, I. 2013, A&A, 558, A54
- Haynes et al. (1984) Haynes, M. P., Giovanelli, R., & Chincarini, G. L. 1984, ARA&A, 22, 445
- Hopkins & Beacom (2006) Hopkins, A. M., & Beacom, J. F. 2006, ApJ, 651, 142
- Huang et al. (2014) Huang, S., Haynes, M. P., Giovanelli, R., et al. 2014, ApJ, 793, 40
- Ilbert et al. (2006) Ilbert, O., Arnouts, S., McCracken, H. J., et al. 2006, A&A, 457, 841
- Kartaltepe et al. (2010) Kartaltepe, J. S., Sanders, D. B., Le Floc’h, E., et al. 2010, ApJ, 721, 98
- Koekemoer et al. (2007) Koekemoer, A. M., Aussel, H., Calzetti, D., et al. 2007, ApJS, 172, 196
- Kroupa (2001) Kroupa, P. 2001, MNRAS, 322, 231
- Lah et al. (2007) Lah, P., Chengalur, J. N., Briggs, F. H., et al. 2007, MNRAS, 376, 1357
- Le Floc’h et al. (2009) Le Floc’h, E., Aussel, H., Ilbert, O., et al. 2009, ApJ, 703, 222
- Lee et al. (2014) Lee, C., Chung, A., Yun, M. S., et al. 2014, MNRAS, 441, 1363
- Lutz et al. (2011) Lutz, D., Poglitsch, A., Altieri, B., et al. 2011, A&A, 532, A90
- Maddox et al. (2015) Maddox, N., Hess, K. M., Obreschkow, D., Jarvis, M. J., & Blyth, S.-L. 2015, MNRAS, 447, 1610
- Magnelli et al. (2015) Magnelli, B., Ivison, R. J., Lutz, D., et al. 2015, A&A, 573, A45
- Massey et al. (2010) Massey, R., Stoughton, C., Leauthaud, A., et al. 2010, MNRAS, 401, 371
- Masui et al. (2013) Masui, K. W., Switzer, E. R., Banavar, N., et al. 2013, ApJ, 763, L20
- Murphy et al. (2011) Murphy, E. J., Condon, J. J., Schinnerer, E., et al. 2011, ApJ, 737, 67
- Oliver et al. (2010) Oliver, S. J., Wang, L., Smith, A. J., et al. 2010, A&A, 518, L21
- Rodighiero et al. (2011) Rodighiero, G., Daddi, E., Baronchelli, I., et al. 2011, ApJ, 739, L40
- Saintonge et al. (2011) Saintonge, A., Kauffmann, G., Kramer, C., et al. 2011, MNRAS, 415, 32
- Sargent et al. (2014) Sargent, M. T., Daddi, E., Béthermin, M., et al. 2014, ApJ, 793, 19
- Schinnerer et al. (2007) Schinnerer, E., Smolčić, V., Carilli, C. L., et al. 2007, ApJS, 172, 46
- Scoville et al. (2015) Scoville, N., Sheth, K., Walter, F., et al. 2015, ApJ, 800, 70
- Scudder et al. (2012) Scudder, J. M., Ellison, S. L., Torrey, P., Patton, D. R., & Mendel, J. T. 2012, MNRAS, 426, 549
- Sutherland & Saunders (1992) Sutherland, W., & Saunders, W. 1992, MNRAS, 259, 413
- Tacconi et al. (2013) Tacconi, L. J., Neri, R., Genzel, R., et al. 2013, ApJ, 768, 74
- U et al. (2012) U, V., Sanders, D. B., Mazzarella, J. M., et al. 2012, ApJS, 203, 9
- Verheijen et al. (2007) Verheijen, M., van Gorkom, J. H., Szomoru, A., et al. 2007, ApJ, 668, L9
- Walter et al. (2008) Walter, F., Brinks, E., de Blok, W. J. G., et al. 2008, AJ, 136, 2563
- Zwaan et al. (2001) Zwaan, M. A., van Dokkum, P. G., & Verheijen, M. A. W. 2001, Science, 293, 1800