Discovery of hard phase lags in the pulsed emission of GRO J1744–28
Abstract
We report on the discovery and energy dependence of hard phase lags in the 2.14 Hz pulsed profiles of GRO J1744–28. We used data from XMM–Newton and NuSTAR. We were able to well constrain the lag spectrum with respect to the softest (0.3–2.3 keV) band: the delay shows increasing lag values reaching a maximum delay of 12 ms, between 6 and 6.4 keV. After this maximum, the value of the hard lag drops to 7 ms, followed by a recovery to a plateau at 9 ms for energies above 8 keV. data confirm this trend up to 30 keV, but the measurements are statistically poorer, and therefore, less constraining. The lag-energy pattern up to the discontinuity is well described by a logarithmic function. Assuming this is due to a Compton reverberation mechanismì, we derive a size for the Compton cloud 120 , consistent with previous estimates on the magnetospheric radius. In this scenario, the sharp discontinuity at 6.5 keV appears difficult to interpret and suggests the possible influence of the reflected component in this energy range. We therefore propose the possible coexistence of both Compton and disc reverberation to explain the scale of the lags and its energy dependence.
keywords:
line: identification – line: formation — stars: individual: GRO J1744–28 — X-rays: binaries — X-rays: general1 Introduction
The transient, X-ray binary pulsar GRO J1744-28, also known as the bursting pulsar due to the presence of recurrent type-II bursts, went in outburst in 2014 mid-January, reached a peak luminosity in mid-March, and returned to quiescence at the end of April. During this outburst, it was observed by many X-ray observatories: results from spectral analysis done with XMM-Newton and INTEGRAL are reported in D’Aì et al. (2015), with Chandra in Degenaar et al. (2014) and with Chandra and NuSTAR in Younes et al. (2015). The pulsar ( = 467 ms) orbits in a nearly circular path (eccentricity 1.1 10-3) with a period of 11.8337 d, and a projected semi-major axis of 2.6324 lt-s. The mass function (1.3638 10-4 M⊙) indicate an evolved low-mass (M⊙ 0.2 M⊙) companion star and a nearly face-on inclination angle (Finger et al. 1996).
The X-ray pulsed profile can be satisfactorily decomposed into the sum of two sinusoids, where the first harmonic accounts for about 3–8% of the overall harmonic content (Finger et al. 1996; D’Aì et al. 2015; Younes et al. 2015). The profile’s shape is energy dependent; the pulse amplitude is generally positively correlated with energy, with an amplitude fraction of 5% for energies below 2 keV, increasing to more than 20% at 10 keV. The amplitude fraction has, however, a drop in the energy range corresponding to the iron fluorescence emission, because of the relative higher contribution to the observed flux from incoherent emission from the reflection component (D’Aì et al. 2015).
Calculations on the long-term evolution of the system that account for the present-day orbital parameters (Rappaport & Joss 1997), measures of the neutron star (NS) spin-up rate (Finger et al. 1996), and evidence for a propeller state at the end of its 1996 outburst (Cui 1997) indicated an intermediate NS dipole field of a few 1011 G. Detection of a cyclotron resonance feature between 4 and 5 keV in the X-ray spectrum confirmed such expectations (D’Aì et al. 2015; Doroshenko et al. 2015) and firmly established GRO J1744–28 as a peculiar system in between the class of the highly magnetized (B 1012 G), young, X-ray pulsars and the class of old NSs with low-mass companions, i.e. accreting millisecond X-ray pulsars (AMXPs) and not-pulsating accreting NSs, owing to a presumed low magnetic dipole field (B 109 G).
In this Letter, we focus on the relation between the pulse phase and energy during the persistent (non-bursting) emission of the source. We show the existence of energy-dependent hard phase lags, we study its dependence and propose a physical scenario using a mix of Compton and disc reverberation.
2 Observation, data reduction, and analysis
XMM–Newton observed GRO J1744-28 on 2014 March 6. Details on this observation are reported in D’Aì et al. (2015). For this work, we use only data from the EPIC/pn instrument, screening from type-I bursts and considering only the persistent emission. We applied standard filtering criteria and included events only in the RAWX[28:46] columns. The light curve exposure is 64.1 ks and the averaged rate is 660 cps. Events were barycentred with respect to the Barycentric Dynamical Time using the barycen tool with RA = 266.137792 and Dec. = –28.740803 (Gosling et al. 2007). To correct the pulse arrival times for the orbital motion of the pulsar, we adopted the following orbital parameters (/GBM pulsar project111 http://gammaray.msfc.nasa.gov/gbm/science/pulsars/lightcurves/groj1744.html): = 11.836397 d, sin() = 2.637 lt-s, and = 56695.6988 MJD. We then used an epoch-folding search (efsearch in xronos) to find the averaged pulse period during the persistent emission. The highest peak is found in correspondence with a period of 0.4670450(1) s. We selected 20 energy bands in the EPIC/pn spectrum, keeping the number of events approximately equal in each selection. The softest band comprises the 0.3–2.3 keV range, while the hardest band comprises the 9.18–12 keV range. For each energy-filtered event file, we obtained the corresponding folded profile using as folding period = 0.4670450 s and a phase-bin time of 0.5 ms. We fitted the pulsed profiles using the best-fitting function:
| (1) |
where , , , , and are the averaged profile count rate, the sinusoidal semi-amplitudes of the fundamental and first overtone and their phase differences with respect to the best-fitting phase of the first interval, respectively.
We obtained a satisfactory description of all the profiles, with an averaged reduced for the 20 fits of 1.00 (929 d.o.f. per fitted profile) and a standard deviation of 0.05. We show in Fig. 1 the results for the (in units of millisecond time difference with respect to the first energy selected interval). Because we report the phases with respect to the best-fitting phase of the first interval, there is a systematic error of 1 ms in the -axis, while error-bars in the plot show only the statistical error at 68% confidence level. There is a clear hard-phase lag that from the softest band rises up to 12 ms for energies 6 keV. Above 6.5 keV the lag sharply drops, progressively recovering to form a plateau for energies above 8 keV. Adopting also a different energy binning (with a constant energy width of 200 eV) and repeating the steps of our analysis, we ensured that the drop is not an artefact of the binning choice (see the inset in Fig. 1).
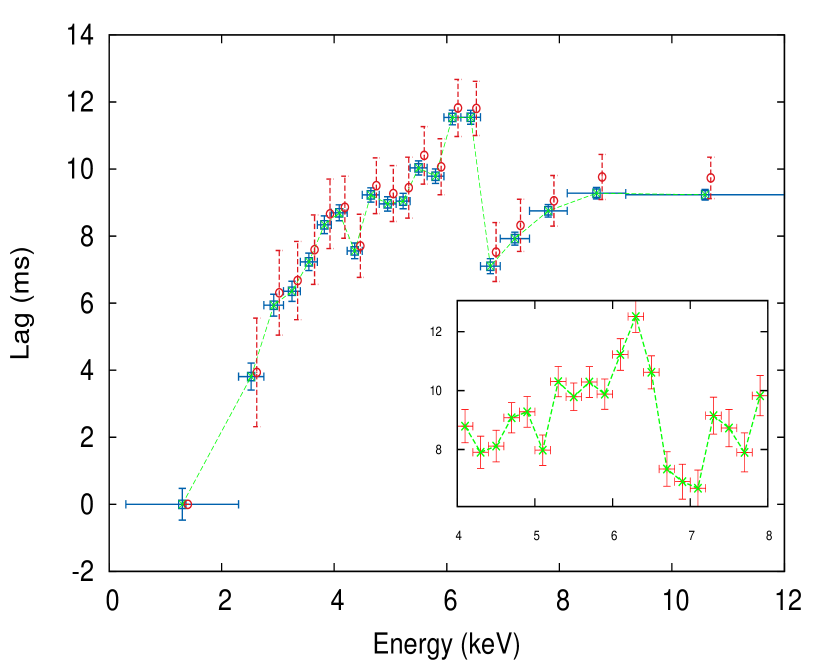
We applied a second procedure to check the robustness of the trend, using the cross-correlation technique. We obtained the cross-correlation function (CCF) of each energy-selected profile with respect to the first folded profile. The resulting CCF had a clear bell-shaped function; we obtained the centre of this function through a Gaussian fit in a restricted interval around the CCF peak. To estimate the error on the data, we generated for each profile 1000 simulated profiles based on the same statistics of the original profile. We found again the set of best-fitting centre values and choose to associate as error the standard deviation of this sample. The final result is shown in Fig. 1 (red open circles points) together with the results from the first method to allow for a quick comparison. The trend is fully compatible with our first procedure, the best-fitting lags are slightly above the corresponding best-fitting values of the least-squared lags (still well within the error bars) but the associated errors are systematically larger due to the greater uncertainty in estimating the peak of the CCF.
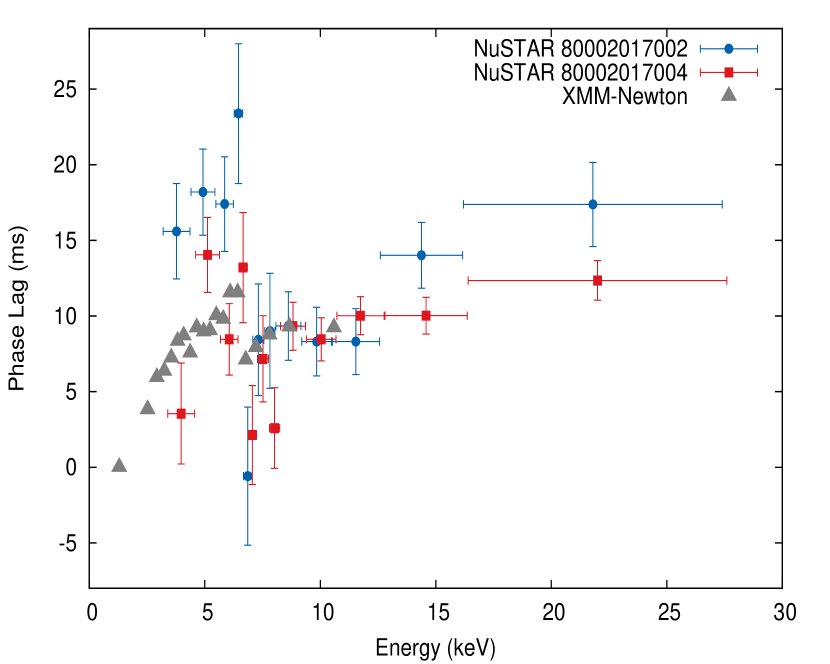
We also analysed two NuSTAR observations of GRO J1744–28 performed on 2014 February 15 (OBS.Id 80002017002, net exposure 24 ks, rate 185 cps) and on 2014 March 3 (Obs.ID 80002017004, net exposure 7.1 ks, rate 570 cps). We selected a circular region centred on the source coordinates of 100 arcsec radius for both observations, and applied the same procedure for the analysis of the EPIC/pn data, selecting 12 energy bands. To improve the statistics, we combined the light curves of the two Focal Plane Modules (FPMA and FPMB) to derive a single folded profile. We obtained as best folding periods 0.4670460 s and 0.4670453 s, for the first and second observation, respectively.
In Fig. 2 we show the phase-lag dependence according to the least-square method. To allow a direct comparison with the XMM–Newton data, we overplotted them (grey triangles), setting the reference phase of the phase lag at 8.8 keV channel to be equal to the value found for the EPIC/pn data set. The data show in both observations qualitatively a trend similar to the one shown by EPIC/pn data. Quantitatively, the lag values are much less constrained and they do not allow us to draw firm conclusions about possible differences in the trends derived for the two observations, although there is a hint for greater lags in the observation of February, when the source’s luminosity was about a third of the March observation.
We conservatively limit the discussion to the much more clearly constrained dependence outlined by the EPIC/pn data.
Discussion
Energy-dependent soft phase lags in accreting X-ray pulsars have been reported for sources belonging to the class of the millisecond pulsars (Cui et al. 1998; Galloway et al. 2002, 2005; Ibragimov et al. 2011; Falanga et al. 2012). Recently Miyasaka et al. (2013) reported an energy dependent hard phase lag for the slowly spinning ( = 12.29 s), X-ray pulsar GS 0834-430, and an energy-modulated phase-lag has been reported for 4U 0115+63 (Ferrigno et al. 2011). The fractional delay for AMXPs is of the order of 5% and soft photons lag harder ones, whereas the hard phase lag in GS 0834–430 shows a monotonic rise with energy attaining a 30% of the pulse period above 50 keV. GRO J1744–28 energy dependent phase lag more closely resembles the behaviour of GS 0834–430, but its fractional delay (2.6 per cent of the pulse period) is significantly lower.
Different interpretations have been widely discussed in literature about the origin and the possible diagnostic tools offered by such measurements (Poutanen 2001). A straight geometric interpretation of the lags due to the different geometrical paths travelled by photons of different energy bands are advocated in the case of some accreting X-ray binaries and AGNs, where part of the hard photons are reflected by the surface of the accretion disk. The lag is thus a measure of the reverberation distance between the primary source of the incident photons and the averaged radius in the disc where reflection actually occurs; Fourier-resolved time-lags have provided an additional method to connect the intrinsic variability of the irradiating flux with the scattered/reflected component (Uttley et al. 2014).
The non-monotonic lag-energy spectrum of Fig. 1 clearly shows
a smooth rising trend and a discontinuity in the iron range, where a
broad emission line is present in the energy spectrum
(D’Aì et al. 2015). We shall therefore explore a scenario where a
combination of Compton and disc reverberation might both operate to
produce the observed lag dependence. We start making some preliminary
considerations on the size of its accretion disk. Assuming an NS mass
of 1.69 M⊙, a companion’s mass of 0.24 M⊙
(Rappaport &
Joss 1997) and the binary period of 11.83 d
(Finger et al. 1996), we find that the pulsar Roche lobe radius is
43 lt-s, and the circularization radius 4 lt-s
(Eq. 4.6 and 4.21 in Frank
et al. 2002), so that the outer disc
radius, which should lie in between these two values, would easily
accommodate the overall variation scale of the observed lags. The
inner disc radius, if truncated at the magnetospheric radius, should
instead be of the order of 1 lt-ms (D’Aì et al. 2015).
The reflection
component in the energy spectrum of GRO J1744–28 gives its strongest
contribution between 6.6–6.8 keV, because of the presence of a
moderately broadened emission line from highly ionized He-like iron
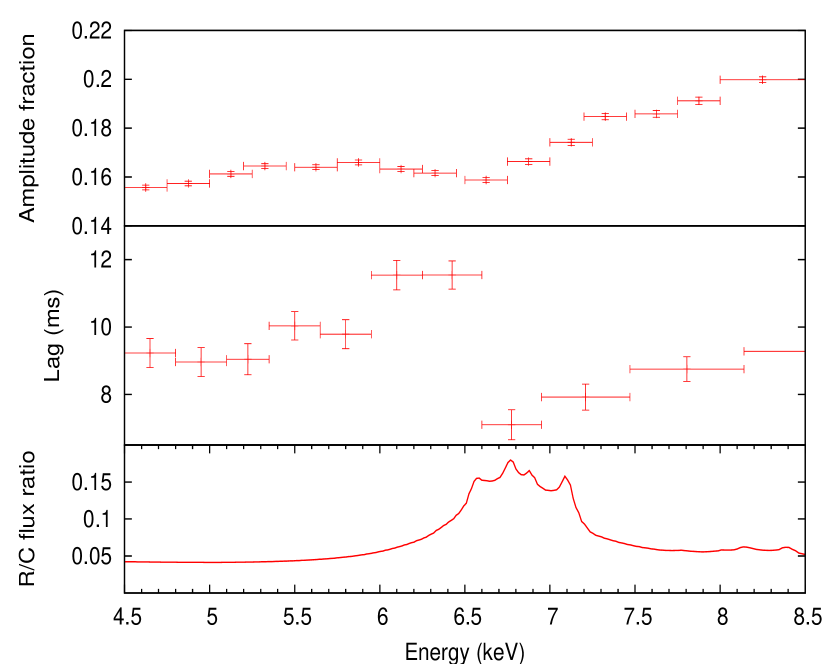
ions (Degenaar et al. 2014; D’Aì et al. 2015; Younes et al. 2015). The ratio of the
reflected and the continuum fluxes is almost constant in the 2–6 keV
range at 5% and rapidly rises up to 15% at the iron
peak (see lower panel of Fig.3). Presence of this emission
is also noticeable from the clear drop in the pulsed emission
amplitude at this energy, because the reflected component, coming from
at least a distance of 1 lt-ms, has lost coherence with respect to the
non-incident continuum (see upper panel of fig. 3 and
also Fig. 12 in D’Aì et al. 2015). It is therefore plausible that a
distortion of the pulsed profile can be caused by some reverberation
on the disk, if the reflected emission is seen pulsating (at least
partially), but with a phase difference with respect to the direct
emission. The energy-dependent sign of the lags from the iron
emission line depends on the distance where photons are actually
emitted, so that they track the complex, broadened, line shape, with
the extended red wing and the Doppler boosted blue peak coming from
the inner radii (shorter lags), and the line core, close at the
rest-frame energy, produced by the more distant radii (longer lags),
where relativistic and dynamical effects are strongly damped
(Campana &
Stella 1995). Qualitatively, the lag spectrum, shown in the
middle panel of Fig. 3, reproduces these features: the
overall scale of the lag in this energy range is 3–5 ms, consistent
with the dimensions of the inner parts of the accretion disc. When the
line emission drops, the lag values at the extreme wings of the line
are consistent. We also note that the highest lag value is at
6.4 keV, where Younes et al. (2015) detected possible emission
from neutral/lowly ionized iron, which may hint also to a contribution
from a neutral and more distant reflector.
When the energy-lag spectrum is considered below 6.5 keV, the lag values rise almost monotonically. As a possible mechanism able to produce this monotonic part of the lag trend, we consider the Compton reverberation scenario (Payne 1980; Guilbert et al. 1982). In this case, energetic, relatively hot electrons up-scatter colder photons produced by bremsstrahlung, synchrotron processes or emerging from the thermalized mould at the base of the accretion column. If the delay is produced because hard photons spend more time in the Comptonizing cloud due to repetitive scattering, we can derive from the dependence of the delay on the photon energy an estimate on the size of the cloud, assuming reasonable values for the electron temperature and optical depth, together with the very simplifying assumption of a uniformly dense and static corona (but see Hua et al. 1997, for a corona with a density gradient).
Because of the clear discontinuity at 6.6 keV, we first fitted the phase delays obtained from the least-squared fits (Fig. 1, blue open squares), in the restricted 0.3–6.6 keV energy range, assuming a logarithmic dependence function, according to the formula (Lightman et al. 1978):
| (2) |
where , and are the optical depth and the Compton cloud size, respectively. and are the hard and soft photons energy ( = 1.3 keV is a fixed parameter, being the central value of the first energy band), and is the speed of light.
The logarithmic function provides a satisfactory description of the delays up to 6.6 keV (reduced of 1.3 with 15 degrees of freedom), with a best-fitting value of the constant before the logarithm of 7.0 0.1 ms.
There is small uncertainty for the cut-off energy of the spectrum. Adopting a variety of models and also from independent observations and analysis of the broad-band spectrum of GRO J1744–28 (D’Aì et al. 2015; Younes et al. 2015), the cut-off energy of the spectrum results 7 keV, so that . The optical depth is difficult to constrain from the simple observation of the slope of the spectrum, because the exact value depends on the assumptions about the geometry of the Comptonization region and on a variety of concomitant physical processes that are superimposed on the observed spectrum (i.e. blackbody emission from the NS cap, synchrotron emission, and the ratio of bulk versus thermal Comptonization). Moreover, the scattering cross-section depends on the direction of the photon with respect to the magnetic field lines, allowing radiation to escape more freely through the walls of the accretion column. We consider a possible lower limit of = 1 (see Section 5.2 in Becker & Wolff 2007) and estimate the region size to be of the order of 0.8 ms-lt (240 km), that would be consistent with the estimates on the magnetosphere size as derived by the measure of the inferred NS magnetic dipole and the dynamical and relativistic broadening of the fluorescence lines of the reflection component (Degenaar et al. 2014; D’Aì et al. 2015).
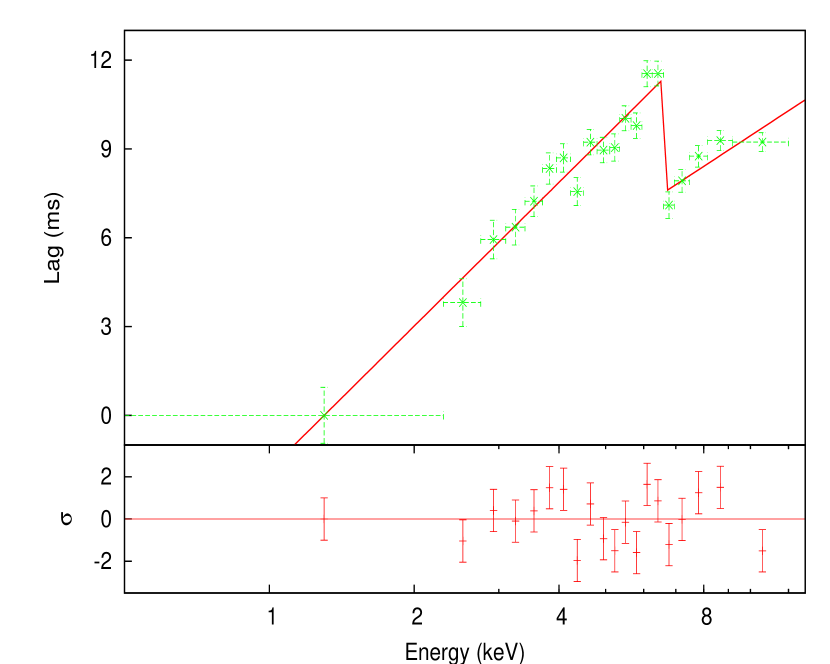
We note that after the discontinuity the trend suggests a return to a
logarithmic dependence as confirmed by the extended coverage,
but with a different multiplicative constant (Fig. 1). In
fact, adopting a piecewise function, with f(x)=
for 6.6 keV and = for 6.6
keV, we obtained a general satisfactory fit ( = 1.47 for 18 dof) as shown in Fig. 4. The
best-fitting constant of this second logarithmic function
( = 4.5 ms) would point to physical characteristics similar to
the ones of the previously discussed region. In conclusion, if the
whole lag spectrum is interpreted only as due to Compton
reverberation, we would need an unrealistic break in the iron range,
requiring two Comptonizing separate regions but with similar physical
parameters. On the contrary, it appears more likely that the sharp
discontinuity is determined by the overimposed effect of the disc
reverberation. In this case, it remains to explain why at the iron
core energy the overimposed hard lag is not above the extrapolated
best-fitting function that fits the softer 1–6.4 keV lag range of
Fig. 4. We argue that if the continuum emission is emitted in
a fan-beam geometry, as possibly envisaged for pulsars accreting at
very high (Basko &
Sunyaev 1976), and the GRO J1744–28 is a system
seen at low inclination angle, with the magnetic columns almost
parallel to our line-of-sight, the optical paths of the continuum
photons hitting the disc and directed along our line of sight could be
different. Part of the continuum emission that impinges on the disc
escapes laterally from the base of the shock region, whereas the
Comptonizing cloud that produces the continuous phase-shift of the
pulsed emission is along our line of sight. Although the details of
this combined process could be much more complex, we note that at
least qualitatively this sketched scenario could explain both the
scale of the observed lags and its trend. We note, that, besides the
Compton reverberation, there are other ways to produce a logarithmic
lag-energy dependence: e.g. as suggested by Kotov
et al. (2001) if the
slope of the power-law depended on the distance, with harder indices
produced in the inner regions, and softer in the outer regions, a
logarithmic lag-energy spectrum is naturally produced. Moreover, this
mechanism coupled with a reflecting disk, would produce a complex
lag-spectrum, with a dimple (also defined
by Kotov
et al. 2001, antilags, as they anticipate the softer band)
at the energies of the fluorescent iron line very similarly to what
observed in the GRO J1744–28.
Finally, we also mention the
possibility that the lag discontinuity might be caused by an abrupt
change in the energy-dependent scattering cross-section at the
cyclotron resonant energy (as suggested for the accreting pulsar
4U 0115+63 by Ferrigno et al. 2011), though the results from spectral
analysis in D’Aì et al. (2015) indicated the presence of a moderately broad
absorption feature at lower energy 4.7 keV.
3 Acknowledgements
The High-Energy Astrophysics Group of Palermo acknowledges
support from the Fondo Finalizzato alla Ricerca (FFR) 2012/13, project
N. 2012-ATE-0390, founded by the University of
Palermo.
A. R. gratefully acknowledges the Sardinia Regional
Government for the financial support (P. O. R. Sardegna F.S.E.
Operational Programme of the Autonomous Region of Sardinia, European
Social Fund 2007-2013 - Axis IV Human Resources, Objective l.3, Line
of Activity l.3.1).
The Palermo and Cagliari University groups
acknowledge financial contribution from the agreement ASI-INAF
I/037/12/0.
References
- Basko & Sunyaev (1976) Basko M. M., Sunyaev R. A., 1976, MNRAS, 175, 395
- Becker & Wolff (2007) Becker P. A., Wolff M. T., 2007, ApJ, 654, 435
- Campana & Stella (1995) Campana S., Stella L., 1995, MNRAS, 272, 585
- Cui (1997) Cui W., 1997, ApJL, 482, L163
- Cui et al. (1998) Cui W., Morgan E. H., Titarchuk L. G., 1998, ApJL, 504, L27
- D’Aì et al. (2015) D’Aì A., Di Salvo T., Iaria R., García J. A., Sanna A., Pintore F., Riggio A., Burderi L., Bozzo E., Dauser T., Matranga M., Galiano C. G., Robba N. R., 2015, MNRAS, 449, 4288
- Degenaar et al. (2014) Degenaar N., Miller J. M., Harrison F. A., Kennea J. A., Kouveliotou C., Younes G., 2014, ApJL, 796, L9
- Doroshenko et al. (2015) Doroshenko R., Santangelo A., Doroshenko V., Suleimanov V., Piraino S., 2015, MNRAS, 452, 2490
- Falanga et al. (2012) Falanga M., Kuiper L., Poutanen J., Galloway D. K., Bozzo E., Goldwurm A., Hermsen W., Stella L., 2012, A&A, 545, A26
- Ferrigno et al. (2011) Ferrigno C., Falanga M., Bozzo E., Becker P. A., Klochkov D., Santangelo A., 2011, A&A, 532, A76
- Finger et al. (1996) Finger M. H., Koh D. T., Nelson R. W., Prince T. A., Vaughan B. A., Wilson R. B., 1996, Nature, 381, 291
- Frank et al. (2002) Frank J., King A., Raine D. J., 2002, Accretion Power in Astrophysics: Third Edition. Accretion Power in Astrophysics, by Juhan Frank and Andrew King and Derek Raine, pp. 398. ISBN 0521620538. Cambridge, UK: Cambridge University Press, February 2002.
- Galloway et al. (2002) Galloway D. K., Chakrabarty D., Morgan E. H., Remillard R. A., 2002, ApJL, 576, L137
- Galloway et al. (2005) Galloway D. K., Markwardt C. B., Morgan E. H., Chakrabarty D., Strohmayer T. E., 2005, ApJL, 622, L45
- Gosling et al. (2007) Gosling A. J., Bandyopadhyay R. M., Miller-Jones J. C. A., Farrell S. A., 2007, MNRAS, 380, 1511
- Guilbert et al. (1982) Guilbert P. W., Fabian A. C., Ross R. R., 1982, MNRAS, 199, 763
- Hua et al. (1997) Hua X.-M., Kazanas D., Titarchuk L., 1997, ApJL, 482, L57
- Ibragimov et al. (2011) Ibragimov A., Kajava J. J. E., Poutanen J., 2011, MNRAS, 415, 1864
- Kotov et al. (2001) Kotov O., Churazov E., Gilfanov M., 2001, MNRAS, 327, 799
- Lightman et al. (1978) Lightman A. P., Giacconi R., Tananbaum H., 1978, ApJ, 224, 375
- Miyasaka et al. (2013) Miyasaka H., Bachetti M., Harrison F. A., 2013, ApJ, 775, 65
- Payne (1980) Payne D. G., 1980, ApJ, 237, 951
- Poutanen (2001) Poutanen J., 2001, Advances in Space Research, 28, 267
- Rappaport & Joss (1997) Rappaport S., Joss P. C., 1997, ApJ, 486, 435
- Uttley et al. (2014) Uttley P., Cackett E. M., Fabian A. C., Kara E., Wilkins D. R., 2014, A&ARV, 22, 72
- Younes et al. (2015) Younes G., Kouveliotou C., Grefenstette B. W., 2015, ApJ, 804, 43