The intermediate line region in active galactic nuclei
Abstract
We show that the recently observed suppression of the gap between the broad line region (BLR) and the narrow line region (NLR) in some AGN can be fully explained by an increase of the gas density in the emitting region. Our model predicts the formation of the intermediate line region (ILR) that is observed in some Seyfert galaxies by the detection of emission lines with intermediate velocity full width half maximum (FWHM) 700 - 1200 km s-1. These lines are believed to be originating from an ILR located somewhere between the BLR and NLR. As it was previously proved, the apparent gap is assumed to be caused by the presence of dust beyond the sublimation radius. Our computations with the use of cloudy photoionization code, show that the differences in the shape of spectral energy distribution (SED) from the central region of AGN, do not diminish the apparent gap in the line emission in those objects. A strong discontinuity in the line emission vs radius exists for all lines at the dust sublimation radius. However, increasing the gas density to 1011.5 cm-3 at the sublimation radius provides the continuous line emission vs radius and fully explains the recently observed lack of apparent gap in some AGN. We show that such a high density is consistent with the density of upper layers of an accretion disk atmosphere. Therefore, the upper layers of the disk atmosphere can give rise to the formation of observed emission line clouds.
Subject headings:
galaxies: active - methods: numerical - radiative transfer - quasars: emission lines1. Introduction
Observations of active galactic nuclei (AGN) clearly show different types of emission lines in their spectra. Depending on the width of the emitted lines, they are classified as narrow lines, with full width half maximum (FWHM) 500 km s-1, or broad lines, with FWHM 2000 km s-1. This implies two different regions of line formation, i.e, narrow line region (NLR) and the broad line region (BLR) respectively. Although the physical conditions of these regions are quite well understood (Davidson 1972; Krolik, McKee & Tarter 1981; Netzer 1990; Pier & Voit 1995; Dopita et al. 2002; Groves, Dopita & Sutherland 2004a, b; Stern, Laor & Baskin 2014; Baskin, Laor & Stern 2014; Czerny & Hryniewicz 2011; Czerny et al. 2015; Stern et al. 2016), there are still several issues to be explored. One of those problem is the significant suppression of the line emission in a region between the BLR and NLR in most AGN (Osterbrock & Ferland 2006; Boroson & Green 1992). A leading explanation for this feature is the dust suppression introduced by Netzer & Laor (1993, hereafter NL93). On the other hand, recent observations of several objects indicate the existence of an intermediate line emission region (ILR), between the BLR and NLR, which produces emission lines with velocity FWHM 700 - 1200 km s-1. Using the statistical investigations of broad UV-lines in QSOs, Brotherton et al. (1994) discussed the ILR as an inner extension of the NLR. Mason, Puchnarewicz & Jones (1996) found evidence for an ILR with velocity FWHM 1000 km s-1 which produces a significant amount of both permitted and forbidden line fluxes in NLSy1 RE J1034+396. For the Sy1 NGC 4151, Crenshaw & Kraemer (2007) identified a line emission component with width FWHM 1170 km s-1, most probably originating between the BLR and NLR. Detailed spectral analysis of large number of SDSS sources have revealed the presence of intermediate component of line emission with velocity width in between that of broad and narrow components (Hu et al. 2008a, b; Zhu, Zhang & Tang 2009). Additionally, Crenshaw et al. (2009) detected ILR emission with width of 680 km s-1 in the historically low state spectrum of NGC 5548 obtained with the Space Telescope Imaging Spectrograph on the Hubble Space Telescope. Using the HST/ FOS spectra of quasar OI 287, Li et al. (2015) reported the detection of intermediate width emission lines originating at a distance of 2.9 pc from the central black hole. The question remains unanswered, is there any separation between gas responsible for broad and narrow line emission in different types of AGN? What is the physical mechanism leading to the existence of this gap in some source, and why the gap is not observed in all of them?
Photoionization calculations provide a powerful tool to model the line emission from gas clouds powered by the continuum radiation from the nucleus. Detailed analysis has shown that BLR clouds are denser and located closer to the AGN center, while the NLR clouds have lower density and are more distant (see for details Osterbrock & Ferland 2006; Netzer 1990). Nevertheless, the lack of significant line emission from the intermediate zone between the BLR and NLR is not naturally explained by photoionization models.
The presence of dust complicates the physics by introducing additional processes (Ferland & Netzer 1979; Baldwin et al. 1991; van Hoof et al. 2004, and references therein) in the radiation-matter interactions which has to be treated properly in simulations of the gas emission. Observations have shown the existences of dust in the NLR for almost all types of AGN (De Robertis & Osterbrock 1984; Ferland & Osterbrock 1986; Wills et al. 1993). However, it has been argued that the BLR clouds are devoid of dust since there is a lack of depletion of refractory elements in the gaseous phase (Gaskell, Shields & Wampler 1981). Usually, it is believed that, the radiation energy is so high in BLR, that the dust if present sublimes and no longer survives there (Czerny & Hryniewicz 2011). Reverberation mapping studies show that the BLR clouds are located at a distance smaller by a factor 4 to 5 than the hot dust emission (Suganuma et al. 2006; Koshida et al. 2014). On the other hand, Nenkova et al. (2008) has shown that the closest region where dust can survive in the full radiation field is the face of the dusty torus, located approximately at 0.4 pc for AGN of typical luminosity (see their Eq. 1). While Eq. 1 of Nenkova et al. (2008) gives the smallest radius at which the dust absorption coefficient reflects the full grain mixture, the largest grains survive to closer radii, where they are presumably detected by the reverberation measurements.
The observed apparent gap in the line emission region between BLR and NLR was explained by the dust content in NLR clouds by NL93. The authors calculated emission from a continuous radial distribution of clouds extending from the BLR to the NLR, using the numerical photoionization code ION (Rees, Netzer & Ferland 1989). Their assumption was that the dust is present in NLR but sublimes in a higher ionization region, around the BLR. The authors have shown that the reduced line emission vs radius is a result of the dust extinction of ionizing radiation as well as the dust destruction of the line photons. The dust absorption becomes more efficient with decreasing radial distance from the nucleus, and gives rise to an empty intermediate region, where gas is present but the line emission is heavily suppressed. The dust fully sublimates at smaller radii, and line emission increases dramatically, by about an order of magnitude, giving rise to the BLR. NL93 successfully demonstrated the apparent gap in the line emission vs radius, although their result was obtained for a particular spectral energy distribution (SED) typical for Sy1 AGN (Mathews & Ferland 1987), and for a specific value of the density cm-3 at the sublimation radius at pc.
The aim of this paper is to explain the disappearance of an apparent gap in line emission seen for some sources within the framework of NL93 model. We use the photoionization code cloudy, version 13.03 (Ferland et al. 2013) to determine line luminosities for different shapes of the incident radiation representative for various sub-classes of AGN, as measured from recent observations: Sy1.5 galaxy Mrk 509 (Kaastra et al. 2011), Sy1 galaxy NGC 5548 (Mehdipour et al. 2015), and NLSy1 galaxy PMN J0948+0022 (D’Ammando et al. 2015). In addition, we also use a flexible parametric shape of SED as a Band function (Band et al. 1993). All our results presented below focus on the five major emission lines usually detected in those objects: H 4861.36 Å, He II 1640.00 Å, Mg II 2798.0 Å, C III] 1909.00 Å and [O III] 5006.84 Å.
We show, that the various shapes of SED used in our computations with the model parameters taken from NL93 do not remove apparent gap in the line emission vs radius. For lines considered by us, we always obtain apparent gap similar to the result of NL93. Therefore, the observed properties of ILR cannot be explained only by considering the different shapes of radiation illuminating the gas and dust in our simulations. However, increasing the gas density at the sublimation radius yields to the continuous line emission vs radius and fully explains the observed emission from the ILR.
The structure of this paper is as follows: Section 2 describes the parameter set up of our photoionization simulations. In Section 3, we present the major line luminosity radial profiles for various SEDs. The same line emission vs radius, but for different gas densities, are presented in Section 4. Finally, the discussion and conclusions of our work are described in Sections 5 and 6.
2. The model and its parameters
We consider the continuous distribution of optically thick spherical clouds above an accretion disk, placed at different radial distances extending from the BLR ( pc) to the NLR ( pc). Each cloud at radial distance from the nucleus represents the gas in the emission region described by the parameters: hydrogen number density, [cm-3], dimensionless ionization parameter, , total hydrogen column density, [cm-2], and the chemical abundances. We note that, in the recent years, there is a growing evidence that the emitting and absorbing clouds are radiation pressure confined, and thus the total (radiation+ gas) pressure inside the cloud is constant with stratification in matter density (Pier & Voit 1995; Dopita et al. 2002; Groves, Dopita & Sutherland 2004a, b; Różańska et al. 2006; Stern, Laor & Baskin 2014; Baskin, Laor & Stern 2014; Adhikari et al. 2015; Stern et al. 2016). However, we have checked the assumption that each cloud is in pressure equilibrium does not change the main conclusion of our paper, therefore here we consider the constant density clouds to keep the consistency with the NL93 formalism. The ionization parameter is defined as the ratio of the number of hydrogen-ionizing photons, [s-1], to the gas density of the cloud (Osterbrock & Ferland 2006)
| (1) |
where is the velocity of light.
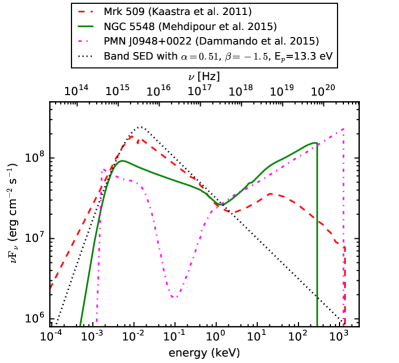
These clouds are illuminated by the radiation of different spectral shapes shown in Fig. 1. To consider various types of AGN we used the SED of the Sy1.5 galaxy Mrk 509 as measured in multi-wavelength observation campaigns (Kaastra et al. 2011) and the Sy1 galaxy NGC 5548 (Mehdipour et al. 2015). The SED of Mrk 509 is dominated by soft X-ray photons below 1 keV, whereas the SED of NGC 5548 is dominated by harder photons above 2 keV. To represent the SED of a NLSy1 we use the galaxy PMN J0948+0022 (D’Ammando et al. 2015), shown as the magenta dashed line. The NLSy1 galaxy PMN J0948+0022 SED has no pronounced emission around 0.1 keV, rather it has an excess of harder photons. We also consider the spectral shape produced with the Band function (Band et al. 1993) as another typical active galaxy. Band function combines two power laws smoothly and provides the possibility of creating different shapes of spectra by allowing to change the parameters in the following expression:
| (2) |
where and are the slopes of the first and second power law respectively. is the peak energy, where the two power laws combine smoothly. For producing the Band SED shape, we choose the slope of the first power law which cuts off exponentially at eV and the second power law with slope . These SEDs are chosen for two reasons: (i) they are recently constrained by combining the data from multi-wavelength observations (except the Band SED) and (ii) they represent different possible SEDs that an AGN can have in general.
For deriving the luminosities of the emission lines corresponding to each individual portion of gas at the given distance, we make simulations with the photoionization cloudy code (version c13.03) (Ferland et al. 2013). We use the luminosity case in cloudy with an assumed source luminosity of . Thus, the ionization parameter for each cloud is computed by the code itself. The shape of the continuum is given by points using the interpolate command (for details see cloudy documentation files111http://www.nublado.org/). We employed the profiles of the cloud parameters as a function of as described by NL93:
| (3) |
To investigate the effect of the SED on the resulting line luminosities, the normalization of parameters in Eq. 3 is chosen after NL93 that at pc, and . With this choice of normalization, the values of and of the cloud at the closest distance, = 10-2 pc, are and respectively. The most distant cloud, at =103 pc, has values of and respectively. As justified in NL93, these numbers are reasonable for simulating the BLR-NLR system of an AGN with a bolometric luminosity of erg s-1. The choice of the sublimation radius at pc is not obvious, since it depends on the size and the grains composition (Netzer 2013). However, for the purpose of understanding the global properties of the line emission vs radius this assumption is reasonable and was also used by NL93.
We used the cloudy default solar composition for clouds located at 0.1 and for more distant clouds at 0.1 the interstellar medium (ISM) composition with dust grains is used. This includes the graphite and silicate component appropriate for the ISM of our galaxy and is fully taken into account by the cloudy code.
To investigate the role of the cloud density on our results, we change the normalization to give different values of the gas density number at the sublimation radius. We consider the following four different number densities: at pc while keeping the other parameters same.
3. Line emission vs radius for various SEDs
In this section we set the density normalization as in NL93, so that =109.4 cm-3 at = 0.1 pc. The emission-line luminosity radial profiles for the lines: H (red circles), He II (green triangles down), Mg II (cyan triangles up), C III] (magenta pluses) and [O III] (blue crosses) are shown in Fig. 2. The upper panels of the figure show the line luminosities for Mrk 509 (left) and NGC 5548 (right). In the lower panels, results for PMN J0948+0022 (left) and Band function (right) are presented.
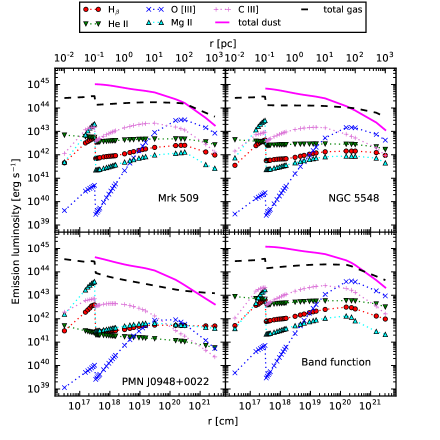
The nature of the line emission vs radius is similar for Mrk 509, NGC 5548, and the Band function, independently of the shape of the illuminating radiation. For all the considered lines, the radial emission profiles display the strong suppression (by a factor of few to a few orders of magnitude) of the line luminosity in a region close to the sublimation radius. The suppression of the emission can also be noticed in the profile of the total gas emission (black dashed lines in the figure). These results are in agreement with the result of NL93 performed for only the one standard AGN SED Mathews & Ferland (1987) used by those authors. However, the radial luminosity profile of the He II line is only weakly suppressed by the factor of 3 with the inclusion of dust. This is different from the case of NL93, where the He II emission goes down by an order of magnitude.
Considerably different radial emission profile for the semi-forbidden line C III] and forbidden line [O III] is obtained in case of NLSy1 PMN J0948+0022 SED. The C III] line luminosity decreases steeply with increasing radius showing a different behaviour from the other SEDs, where it increases in a region between 0.110 pc. As can be seen from the Fig. 2 (lower left panel), the [O III] emission is not significant in a region corresponding to the NLR (10 - 100 pc), which is different from the other SEDs where an excess of [O III] emission is seen at those distances. Interestingly, this result is consistent with the SDSS spectrum of PMN J0948+0022, where [O III] emission is not present (Tanaka et al. 2014, see their Fig. 2, lower panel). Finally, our model shows that He II emission in this object is not significantly affected by the presence of dust. Rather, it is fairly constant close to 0.1 pc and decreases slowly as a function of radial distance. The differences in line emission of C III], [O III] and He II from the other SEDs considered in our study are connected with the fact that the PMN J0948+0022 SED has fewer photons in the extreme UV and soft X-ray band. This significantly smaller number of hydrogen ionizing photons causes the drastic drop, by two orders of magnitude, in lines emitted in the lower density dusty medium on the larger radii.
Despite these differences, the effect of dust on the line suppression is clearly visible in the case of PMN J0948+0022, and it is the strongest for the high luminosity H and Mg II lines. The general conclusion is that for gas with physical conditions and parameters given by NL93, the apparent gap in the line emission cannot be removed by changing the shape of illuminating continuum. The differences in the [O III], C III] and He II radial luminosity profiles for NLSy1 SED are not sufficient to explain the origin of the ILR.
4. Role of the gas density
High local densities in the BLR ( cm-3) have been deduced from the study of UV Fe II emission of an extreme NLSy1 object, I Zw 1 (Bruhweiler & Verner 2008), and in the quasars: LBQS 2113-4538 (Hryniewicz et al. 2014), CTS C30.10 (Modzelewska et al. 2014), and HE 0435-4312 (Sredzinska et al. 2016). Additionally, a density of cm-3 was found from the study of UV intrinsic absorbers of two NLSy1 galaxies (Leighly 2004). Finally, from photoionization calculations, Różańska et al. (2014) found the density of an intrinsic absorbing cloud in the bright quasar HS 1603 + 3820 to be of the order of cm-3. On the basis of those results, we increased the normalization of the gas density at =0.1 pc, to be in our model. Note, that the ionization parameter changes inversely with as given in Eq. 1, but all other parameters have the same values as described in Sec. 2.
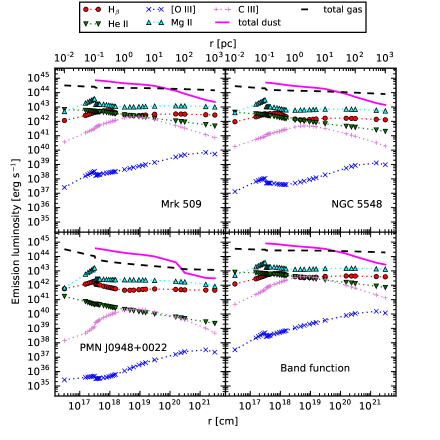
The resulting emission profiles of the five major lines are shown in Fig. 3 for the four SEDs. The meaning of lines and points is exactly the same as in Fig. 2. The H, He II, and C III] emission lines behave differently from the lower density normalization case. The presence of dust does not suppress H and C III] line emission, rather it is enhanced by the factor of 1.5 at pc, in the case of the Mrk 509, NGC 5548 and Band function SEDs. For the SED of NLSy1 PMN J0948+0022 C III] emission increases by the factor of 3 at pc, whereas H emission decreases slightly with the distance, but there is no large jump at the sublimation radius, as was found in the lower density case. Only the Mg II line displays a jump at 0.1 pc, but it is much less prominent than in the lower density case. In all other cases we observe the lack of the line suppression for all shapes of SED.
Our result clearly shows that the strong suppression in the line emission at the sublimation radius for lower density normalization, disappears at the higher density. Therefore, intermediate line emission can be produced at radial distances 0.1 - 1 pc. Note, that the gas emission also does not display any jump for high density case. The strong ILR emission found by (Mason, Puchnarewicz & Jones 1996; Crenshaw & Kraemer 2007; Crenshaw et al. 2009), can be produced if the clouds are two orders of magnitude denser than those considered by NL93. Our results corroborate with the speculation made by Landt et al. (2014), where they discuss the possible role of high density gas for the production of smooth BLR. Furthermore, if the ILR is located at distances predicted by our model, we can estimate the expected reverberation mapping lag. Within the framework of our model, the ILR lag would be of the order of 100-1000 light-days.
The physical reason for the density dependence is connected with the value of the column density at which the ionization front is located. Below, we explain this in the example of hydrogen H line. Let us assume simple ground-state hydrogen photoionization, and set the ionization balance equation
| (4) |
(Osterbrock & Ferland 2006). The first two terms are the proton and electron density in the H+ layer of the cloud, [cm] is the thickness of the H+ layer, and [cm3 s-1] is the Case B recombination coefficient. The physical interpretation is that the flux of hydrogen-ionizing photons incident on the cloud, [cm-2 s-1], equals the number of hydrogen recombinations that occur over the thickness .
The hydrogen column density across H+ layer is then
| (5) |
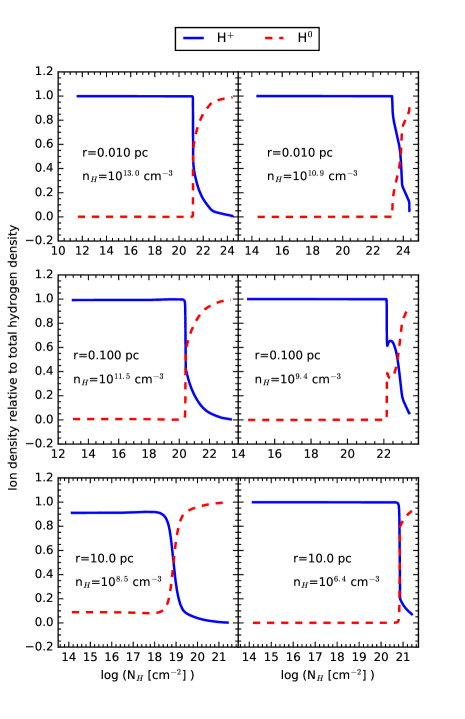
The gas column density , and resulting line and continuum optical depths, all scale with the ionization parameter. At very high values of , whole cloud is ionized, and the line emission comes from the whole volume, in this case limited by the fixed adopted total hydrogen column, . As the cloud density increases, the ionization parameter decreases, ionization front forms, and the cloud consist of two zones. The line emission comes from the first zone, and only the dust in this zone competes with the gas for the photons. The high-density clouds studied here have smaller column densities and optical depths of H+ layer, since ionization parameter is lower. This is clearly demonstrated in Fig. 5, which shows that the H+ - H0 ionization front moves towards smaller cloud thickness with increasing number density of the cloud. For smaller values of , the dust absorption decreases, so there is less suppression of the emission due to the presence of dust. In other words, the less dense clouds have much larger thickness of H+ layer, larger dust column density in the zone with abundant photons, and therefore the dust absorption is significant.
Eq. 5 can be used for the quantitative estimation of threshold U, below which the gas opacity for incident photons dominates over opacity of dust. Taking recombination coefficient 2.6 cm3 s-1, gives the column density: 10. Therefore, the dust optical depth for UV photons is = 100 (for details see Güver & Özel 2009). For =0.1, =10 at the edge of the H+ region. This implies that the width of the H+ layer where gas actively absorbs and emits is only 1/10 of the total layer. In other words, increasing the density by the factor 10 would mean 0.01 which implies 1. This means that the gas opacity always dominates for higher densities and it does not matter if the gas is dusty or not, and therefore no suppression of the line emission is physically possible.
It is worth to mention the conclusion of Ferland & Netzer (1983), saying that for low ionization nuclear emission line region (LINERs), if the line emission comes from the photoionised gas, the is . This is less than the threshold corresponding to higher density (1011.5 cm-3) implied by our result, where the gas opacity is always dominant over the opacity of dust. So, our result clearly indicates that LINERs should also exhibit the ILR. We note that the presence of ILR in LINERs is also discussed by Balmaverde et al. (2016) where they analysed 33 LINERs (bona fide AGN) and Seyfert galaxies from optical spectroscopic Palomar survey observed by HST/STIS. However, the density of the outer portions of ILR claimed by those authors is about three orders of magnitude less (i.e., 104-105 cm-3) than what our model predicts. Most probably this is due to the fact that LINERs are much fainter than objects considered in this paper.
5. Discussion
5.1. Individual line behaviour
Beside the general trend presented above, in some cases we note exceptional line behaviour. For instance, Mg II (cyan triangles up in Figs. 2, and 3) line emissivity does not depend on the shape of the SED. All SEDs considered by us produce the emissivity jump at the sublimation radius, but this jump is two orders of magnitude higher when the cloud density is lower, due to physical reason given above, but for the case of magnesium ionization front.
The density influence on the suppression of line luminosity jump at the sublimation radius is best seen in case of H. For all continuum shapes the strong jump in emission (order of magnitude) is present for the canonical density used by NL93, cm-3. This jump is not seen at all for much denser clouds.
Note, that the dust influence on the emission jump is much stronger in case of Mg II line than for H line. This difference is due to the fact that the H line forms in deeper parts of a cloud than Mg II line. In the presence of dust, the radiation reaching these depths is harder since the dust opacity selectively removes lower energy photons, allowing harder photons to reach the region where H is formed. As a result, the H forming region is warmer and more ionized making the line stronger. Moreover, the dust opacity is smaller at the wavelength of H than Mg II, so H is absorbed less than Mg II. This implies that the contribution of the NLR to the overall line shape is expected to be lower in Mg II than in H.
The He II line emission vs radius from our simulations shows the luminosity jump is at least one order of magnitude lower that the jump reported by NL93 for the same line. Our simulations show that this jump is much smaller, only a factor of two, for three Sy1 SEDs, and completely disappears in the case of the NLSy1 continuum. Those differences may be caused by the different numerical code used by those authors. Nevertheless, with the high density case, He II line suppression is not present for all considered shapes of radiation.
For both densities, the C III] line strongly depends on the SED shape. With the NLSy1 PMN J0948+0022 SED and the dust presence, line luminosity slowly decreases with distance by few factors, and the maximum line emission always occurs at pc. In case of the Sy1 SEDs, the line luminosity peaks at pc, with clear suppression at the sublimation radius for the low-density case.
The [O III] emission (blue crosses in Figs. 2, and 3) reaches a maximum farther outside the sublimation radius. For the high density case, this line is very weak in comparison with other lines. This is in agreement with the fact that forbidden lines originate from low density gas. Only for low density case there is enhanced [O III] emission in a region close to the NLR (10 – 100 pc). We expect that such line will never be observed in the ILR. Indeed, the initial claim of the [O III] variability was not supported by the careful analysis of the data (Barth & Bentz 2016). Beside forbidden [O III] line, our results strongly support the presence of an ILR where the intermediate velocity lines are expected.
5.2. Apparent gap suppression
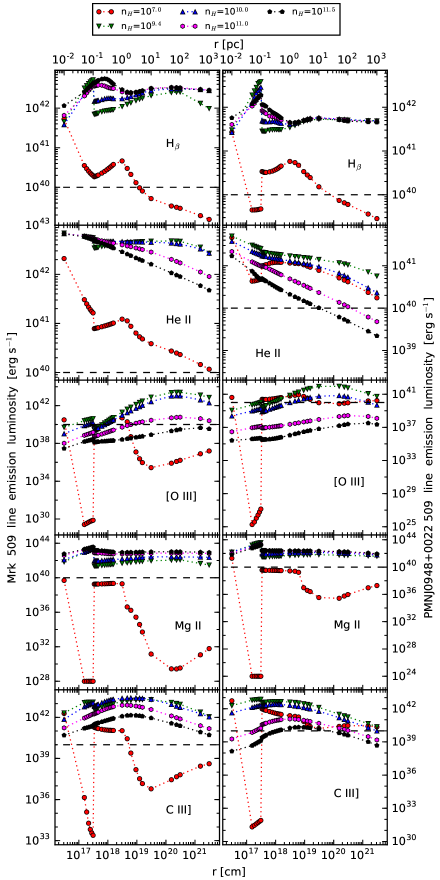
To investigate the role of density in the formation of the ILR, we calculated our model for several values of density normalizations: cm-3, keeping other parameters the same. Fig. 4 shows the dependence of line luminosity radial profiles on the density normalization for two representative SEDs: Mrk 509 (left panels) and PMN J0948+0022 (right panels), for all lines considered by us.
For the rare clouds, the luminosity of some lines decreases many orders of magnitude. Those lines would not be observed due to the sensitivity of the telescopes. Therefore, we mark the lower limit on the line luminosity above which line could be visible, by the horizontal dashed line on each panel. We estimated this limit by assuming a Gaussian spectral profile of the emission lines on top of underlying continuum given by our SEDs. For this calculation, spectral line width is set to the value corresponding to Keplerian velocity at 1 pc ( ILR radii), for a BH mass . It is rather hard lower limit on the observable line luminosities since the simulated isotropic luminosities should be at least 10 times higher (assuming 100% covering factor). Nevertheless, simulated line luminosities presented in Fig. 4 fall below this limit in some cases, and those lines have no chance to be detected.
Note, that for a given SED, there is a preferred value of density for which the line emission is the greatest. For example; the H luminosity increases with the density normalization and is a maximum for at distances 0.1 pc pc. The He II luminosity peaks at pc, and the maximum emission occurs for the lower density, whose value depends on the SED shape. In case of PMN J0948+0022 the luminosity peak is lower by an order of magnitude than for Mrk 509 SED, and occurs for density . This is in agreement with Locally Optimised Cloud (LOC) model of Baldwin et al. (1995).
The radial distances at which the H and He II emissions are the strongest are in agreement with the results inferred from the reverberation studies of the BLR in AGN. The radial stratification with ionization potential of the species producing the line has been observed (i.e. Clavel et al. 1991; Peterson & Wandel 1999), showing that He II line always originates at distances closer by a factor of three/four to the nucleus than H line. In addition, the distances for which the luminosities of Mg II and [O III] peaks are consistent with the reverberation mapping studies.
For the Mrk 509 SED, the emission, with density normalization at 0.1 pc, is insignificant for all considered lines. However, the [O III] emission is the strongest for the PMN J0948+0022 SED with the lowest density , which agrees with the prediction that forbidden lines are formed in low density gas. For both SEDs, the semi-forbidden line C III] has a maximum emission at intermediate densities i.e, at 0.1 pc.
Despite of the different distances where the line luminosities peak the strong jump in the emission profiles disappears in almost all cases for both shapes of continuum, when density normalization increases. The lack of this jump clearly means that there will not be a gap between the BLR and NLR. This naturally explains the origin of the intermediate line region.
5.3. The connection with an accretion disk
It is widely believed that broad line emission clouds may be connected with the wind from an accretion disk atmosphere (Gaskell 2009; Czerny & Hryniewicz 2011). The upper atmospheric layers of the disk can be quite dense, with value up to cm-3, depending on the distance from the central black hole (Hryniewicz 2011; Różańska et al. 2014). These densities are derived by solving for the accretion disk vertical structure in hydrostatic and radiative equilibrium parametrized by the black hole mass, its spin, and the accretion rate (Różańska et al. 1999). We can properly derive the density at the disk photosphere, i.e. at the optical depth , assuming energy generation via viscosity, and diffusion approximation of the radiative transfer. Our calculations use the Rosseland mean opacity tables from Alexander, Rypma & Johnson (1983); Seaton et al. (1994). Those opacities are crucial for calculating the disk density since the true absorption opacity can be an order of magnitude higher than electron scattering opacity as shown by Różańska et al. (1999, see their Fig. 4 and 7).
We take the density at as a representative of the initial density in the disk wind, which supplies matter to the BLR or intrinsic absorbers in an outflow. The model fully takes into account the radial transition from pressure dominated regions to gas dominated regions by assuming that the viscous torque is proportional to the total pressure (gas and radiation), and we use realistic description of the opacities, including atomic transitions and the presence of the dust. Nevertheless, the model should not be extended too far beyond a pc scale because there the self-gravity effects as well as the effects of the circumnuclear stellar cluster become important (Thompson, Quataert & Murray 2005).
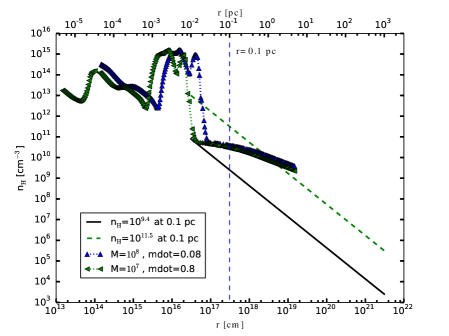
The disk atmosphere radial density profile at is plotted in Fig. 6. We used two test sets of parameters. Keeping the bolometric luminosity constant at erg s-1 we find the Eddington ratio for masses of and . We can assume that our rescaled SEDs should be produced in AGNs with BH masses in this range. For the given assumptions and taking a radiative efficiency of 0.1 we then derive the Eddington ratios corresponding to those masses: 0.8 and 0.08 respectively. In addition, the density of the clouds used in our BLR-NLR simulations is drawn by straight lines according to Eq. 3, for two normalizations at the sublimation radius: , and cm-3.
It is thus clearly seen, that accretion disk atmospheres naturally produce high densities at the sublimation radius. All models show a strong change in density produced by heavy element Rosseland mean opacities used in our calculations. Even if this bump is slightly inside sublimation radius assumed by us, the density radial profiles show that high densities occur in the disk atmosphere, and such dense gas can give rise to the line emitting regions.
On the other hand, the local density at the disk atmosphere does not depend on the Eddington ratio, and is expected to be the same for the Sy1 and NLSy1 galaxies. Thus the differentiation in the local density between those two types of objects must happen at the wind formation stage. Smooth wind outflow causes the decrease of the density with the distance measured along the wind stream line due to wind acceleration and the geometrical divergence of the wind line. However, if thermal instability operates in the wind and colder/denser cloud forms the evolution of the wind density becomes very complex and dependent on the heating and cooling efficiency. The difference between the wind developing in Sy1 and NLSy1 may be due to the difference in the basic wind velocity. A given disk radius, measured in cm or pc, corresponds to larger value of the in NLSy1 than in Sy1, the corresponding Keplerian velocity is lower, and the wind velocity, which usually is of the same order, is also smaller, leaving perhaps more time for the development of the thermal instability in the wind. This would explain higher density of the clouds in NLSy1 than in Sy1. However, detailed analysis of the time-dependent wind model is certainly beyond the scope of the current paper.
6. Conclusions
Following the work of NL93, we performed numerical simulations of photoionised gas in AGN emission line regions and derived the line luminosity radial profiles for various major lines: H 4861.36 Å, He II 1640.00 Å, Mg II 2798.0 Å, C III] 1909.00 Å and [O III] 5006.84 Å originating at different distances from the central engine of the AGN.
On the basis of the line emission vs radius derived for four different SED shapes of incident radiation, and for different density normalizations at the sublimation radius, we find the following:
-
1.
The presence or absence of the Intermediate Line Region is not determined by the spectral shape of the incident continuum. Different SEDs do produce considerably different behaviour of the emission line radial profiles, due to the different amount of extreme UV and soft X-ray photons in its broad band SED. However these differences do not adequately explain why an intermediate line emission is observed in some objects.
-
2.
With higher densities normalization, i.e., nH=10 at pc, we obtained flat luminosity line radial profiles for almost all lines and SEDs. Thus, the dust does not suppress the line emission, contrary to the result obtained by NL93. Our model potentially explains the existence of ILR in some sources. If the density of the gas is high enough, emission lines of intermediate velocity width can be produced.
-
3.
Such ILR is predicted to be located at radial distances pc, and the expected by our model the reverberation mapping lag would be of the order of 100-1000 light-days.
-
4.
We demonstrated the dependence of line luminosity profiles on the density normalization. We found that the significant line emission in objects with a particular SED occurs at different densities in agreement with reverberation mapping studies of H, Mg II, [O III] and He II lines.
-
5.
We showed that dense clouds postulated by us can be potentially formed from an accretion disk atmosphere which is dense enough below the sublimation radius in the accretion disk. This work is another proof that the high densities occur in the BLR, which is in full agreement with many previous studies.
References
- Adhikari et al. (2015) Adhikari T. P., Różańska A., Sobolewska M., Czerny B., 2015, ApJ, 815, 83
- Alexander, Rypma & Johnson (1983) Alexander D. R., Rypma R. L., Johnson H. R., 1983, ApJ, 272, 773
- Baldwin et al. (1995) Baldwin J., Ferland G., Korista K., Verner D., 1995, ApJ, 455, L119
- Baldwin et al. (1991) Baldwin J. A., Ferland G. J., Martin P. G., Corbin M. R., Cota S. A., Peterson B. M., Slettebak A., 1991, ApJ, 374, 580
- Balmaverde et al. (2016) Balmaverde B., Capetti A., Moisio D., Baldi R. D., Marconi A., 2016, A&A, 586, A48
- Band et al. (1993) Band D. et al., 1993, ApJ, 413, 281
- Barth & Bentz (2016) Barth A. J., Bentz M. C., 2016, MNRAS, 458, L109
- Baskin, Laor & Stern (2014) Baskin A., Laor A., Stern J., 2014, MNRAS, 438, 604
- Boroson & Green (1992) Boroson T. A., Green R. F., 1992, ApJS, 80, 109
- Brotherton et al. (1994) Brotherton M. S., Wills B. J., Francis P. J., Steidel C. C., 1994, ApJ, 430, 495
- Bruhweiler & Verner (2008) Bruhweiler F., Verner E., 2008, ApJ, 675, 83
- Clavel et al. (1991) Clavel J. et al., 1991, ApJ, 366, 64
- Crenshaw & Kraemer (2007) Crenshaw D. M., Kraemer S. B., 2007, ApJ, 659, 250
- Crenshaw et al. (2009) Crenshaw D. M., Kraemer S. B., Schmitt H. R., Kaastra J. S., Arav N., Gabel J. R., Korista K. T., 2009, ApJ, 698, 281
- Czerny & Hryniewicz (2011) Czerny B., Hryniewicz K., 2011, A&A, 525, L8
- Czerny et al. (2015) Czerny B. et al., 2015, Advances in Space Research, 55, 1806
- D’Ammando et al. (2015) D’Ammando F. et al., 2015, MNRAS, 446, 2456
- Davidson (1972) Davidson K., 1972, ApJ, 171, 213
- De Robertis & Osterbrock (1984) De Robertis M. M., Osterbrock D. E., 1984, ApJ, 286, 171
- Dopita et al. (2002) Dopita M. A., Groves B. A., Sutherland R. S., Binette L., Cecil G., 2002, ApJ, 572, 753
- Ferland & Netzer (1979) Ferland G., Netzer H., 1979, ApJ, 229, 274
- Ferland & Netzer (1983) Ferland G. J., Netzer H., 1983, ApJ, 264, 105
- Ferland & Osterbrock (1986) Ferland G. J., Osterbrock D. E., 1986, ApJ, 300, 658
- Ferland et al. (2013) Ferland G. J. et al., 2013, Rev. Mexicana Astron. Astrofis., 49, 137
- Gaskell (2009) Gaskell C. M., 2009, New A Rev., 53, 140
- Gaskell, Shields & Wampler (1981) Gaskell C. M., Shields G. A., Wampler E. J., 1981, ApJ, 249, 443
- Groves, Dopita & Sutherland (2004a) Groves B. A., Dopita M. A., Sutherland R. S., 2004a, ApJS, 153, 9
- Groves, Dopita & Sutherland (2004b) —, 2004b, ApJS, 153, 75
- Güver & Özel (2009) Güver T., Özel F., 2009, MNRAS, 400, 2050
- Hryniewicz (2011) Hryniewicz K., 2011, in Narrow-Line Seyfert 1 Galaxies and their Place in the Universe
- Hryniewicz et al. (2014) Hryniewicz K., Czerny B., Pych W., Udalski A., Krupa M., Świȩtoń A., Kaluzny J., 2014, A&A, 562, A34
- Hu et al. (2008a) Hu C., Wang J.-M., Ho L. C., Chen Y.-M., Bian W.-H., Xue S.-J., 2008a, ApJ, 683, L115
- Hu et al. (2008b) Hu C., Wang J.-M., Ho L. C., Chen Y.-M., Zhang H.-T., Bian W.-H., Xue S.-J., 2008b, ApJ, 687, 78
- Kaastra et al. (2011) Kaastra J. S. et al., 2011, A&A, 534, A36
- Koshida et al. (2014) Koshida S. et al., 2014, ApJ, 788, 159
- Krolik, McKee & Tarter (1981) Krolik J. H., McKee C. F., Tarter C. B., 1981, ApJ, 249, 422
- Landt et al. (2014) Landt H., Ward M. J., Elvis M., Karovska M., 2014, MNRAS, 439, 1051
- Leighly (2004) Leighly K. M., 2004, ApJ, 611, 125
- Li et al. (2015) Li Z. et al., 2015, ApJ, 812, 99
- Mason, Puchnarewicz & Jones (1996) Mason K. O., Puchnarewicz E. M., Jones L. R., 1996, MNRAS, 283, L26
- Mathews & Ferland (1987) Mathews W. G., Ferland G. J., 1987, ApJ, 323, 456
- Mehdipour et al. (2015) Mehdipour M. et al., 2015, A&A, 575, A22
- Modzelewska et al. (2014) Modzelewska J. et al., 2014, A&A, 570, A53
- Nenkova et al. (2008) Nenkova M., Sirocky M. M., Nikutta R., Ivezić Ž., Elitzur M., 2008, ApJ, 685, 160
- Netzer (1990) Netzer H., 1990, in Active Galactic Nuclei, Blandford R. D., Netzer H., Woltjer L., Courvoisier T. J.-L., Mayor M., eds., pp. 57–160
- Netzer (2013) —, 2013, The Physics and Evolution of Active Galactic Nuclei
- Netzer & Laor (1993) Netzer H., Laor A., 1993, ApJ, 404, L51
- Osterbrock & Ferland (2006) Osterbrock D. E., Ferland G. J., 2006, Astrophysics of gaseous nebulae and active galactic nuclei
- Peterson & Wandel (1999) Peterson B. M., Wandel A., 1999, ApJ, 521, L95
- Pier & Voit (1995) Pier E. A., Voit G. M., 1995, ApJ, 450, 628
- Rees, Netzer & Ferland (1989) Rees M. J., Netzer H., Ferland G. J., 1989, ApJ, 347, 640
- Różańska et al. (1999) Różańska A., Czerny B., Życki P. T., Pojmański G., 1999, MNRAS, 305, 481
- Różańska et al. (2006) Różańska A., Goosmann R., Dumont A.-M., Czerny B., 2006, A&A, 452, 1
- Różańska et al. (2014) Różańska A., Nikołajuk M., Czerny B., Dobrzycki A., Hryniewicz K., Bechtold J., Ebeling H., 2014, New A, 28, 70
- Seaton et al. (1994) Seaton M. J., Yan Y., Mihalas D., Pradhan A. K., 1994, MNRAS, 266, 805
- Sredzinska et al. (2016) Sredzinska J. et al., 2016, ArXiv e-prints
- Stern et al. (2016) Stern J., Faucher-Giguère C.-A., Zakamska N. L., Hennawi J. F., 2016, ApJ, 819, 130
- Stern, Laor & Baskin (2014) Stern J., Laor A., Baskin A., 2014, MNRAS, 438, 901
- Suganuma et al. (2006) Suganuma M. et al., 2006, ApJ, 639, 46
- Tanaka et al. (2014) Tanaka M. et al., 2014, ApJ, 793, L26
- Thompson, Quataert & Murray (2005) Thompson T. A., Quataert E., Murray N., 2005, ApJ, 630, 167
- van Hoof et al. (2004) van Hoof P. A. M., Weingartner J. C., Martin P. G., Volk K., Ferland G. J., 2004, MNRAS, 350, 1330
- Wills et al. (1993) Wills B. J., Netzer H., Brotherton M. S., Han M., Wills D., Baldwin J. A., Ferland G. J., Browne I. W. A., 1993, ApJ, 410, 534
- Zhu, Zhang & Tang (2009) Zhu L., Zhang S. N., Tang S., 2009, ApJ, 700, 1173