Resonant Elastic X-ray Scattering from the Skyrmion Lattice in Cu2OSeO3
Abstract
We report the study of the skyrmion state near the surface of Cu2OSeO3 using soft resonant elastic x-ray scattering (REXS) at the Cu edge. Within the lateral sampling area of m2, we found a long-range-ordered skyrmion lattice phase as well as the formation of skyrmion domains via the multiple splitting of the diffraction spots. In a recent REXS study of the skyrmion phase of Cu2OSeO3 [Phys. Rev. Lett. 112, 167202 (2014)], Langner et al. reported the observation of the unexpected existence of two distinct skyrmion sublattices that arise from inequivalent Cu sites, and that the rotation and superposition of the two periodic structures leads to a moiré pattern. However, we find no energy splitting of the Cu peak in x-ray absorption measurements and, instead, discuss alternative origins of the peak splitting. In particular, we find that for magnetic field directions deviating from the major cubic axes, a multidomain skyrmion lattice state is obtained, which consistently explains the splitting of the magnetic spots into two—and more—peaks.
I Introduction
Magnetic skyrmions are swirls in a magnetic spin system, analogous to the skyrmion particle originally described in the context of pion fields Mühlbauer et al. (2009); Jonietz et al. (2010); Yu et al. (2010); Seki et al. (2012a); Schulz et al. (2012); Milde et al. (2013); Fert et al. (2013); Nagaosa and Tokura (2013); Romming et al. (2013); Mochizuki et al. (2014); Schwarze et al. (2015). Due to their unique topological properties, they are proposed as a promising candidate for the advanced spintronics applications Nagaosa and Tokura (2013). The most famous skyrmion-carrying materials system are the helimagnets with the crystalline space group , such as MnSi, FeGe, and Cu2OSeO3 Mühlbauer et al. (2009); Münzer et al. (2010); Adams et al. (2010); Yu et al. (2010, 2011); Seki et al. (2012b). The magnetic phases and formation of the skyrmion lattice phase is well-described by the Ginzburg-Landau equation that takes into account thermal fluctuations Mühlbauer et al. (2009). The size of a skyrmion is usually 20-70 nm for these materials, which to a large degree limits the available techniques that can fully characterize their magnetic structure. So far, small angle neutron scattering (SANS) Mühlbauer et al. (2009) and Lorentz transmission electron microscopy (LTEM) Yu et al. (2010) have successfully been applied to characterize the skyrmion lattice phase on a microscopic and macroscopic scale, respectively. On the other hand, spontaneous symmetry breaking and domain formation are the natural consequences of magnetism, suggesting that a similar domain effect may exist in the skyrmion lattice phase. However, this requires a characterization technique that probes the material on a mesoscopic scale, in-between the local probing of LTEM and the macroscopic averaging of neutron diffraction. Here, we present resonant soft x-ray scattering on single crystal Cu2OSeO3, which covers the length scale needed to observe skyrmion domains, revisiting earlier work by Langner et al. Langner et al. (2014).
Among all -type skyrmion-carrying systems, Cu2OSeO3 is a unique compound due to its complex crystalline structure compared with B20 helimagnets, as well as its dielectric and ferroelectric properties Seki et al. (2012b). It is composed of a complex arrangement of distorted CuO5 square-based pyramids and trigonal bipyramids, and a lone-pair tetrahedral SeO3 unit Miller et al. (2010). The oxygen atoms in the unit cell are shared among these basic elements. All copper ions possess a divalent oxidation state, however, they are distinguished depending on their oxygen environment.
Below K the material displays ferrimagnetic ordering. Bos et al. Bos et al. (2008) determined the magnetic properties and found an effective moment of 1.36 /Cu, which is lower than the value of 1.73 /Cu expected for Cu2+, where only the spin moment plays a role. Such a reduced moment is commonly found in metal oxides. The field dependence measurements at 5 K give a saturation value of 0.5 /Cu, i.e., half the value expected for a spin system, indicative of a collinear ferrimagnetic alignment. The anti-aligned spins are situated on the two chemically distinct copper sites in a ratio of 3:1. The Cu sites have a strong Dzyaloshinskii-Moriya interaction, which is at the origin of the ferroelectricity of this material Yang et al. (2012a).
Cu2OSeO3 has an energy hierarchy similar to other metallic helimagnets Nagaosa and Tokura (2013). For the skyrmion phase, the helix propagation orientation is weakly pinned by the cubic anisotropy, and can be easily unpinned by introducing fluctuations, such as an electrical field White et al. (2014a) or a thermal gradient Mochizuki et al. (2014). Density-functional-theory calculations show that the propagation wave vectors along all orientations are degenerate for the skyrmion phase Yang et al. (2012b). Therefore, it is expected that under weak perturbation condition, multiple skyrmion domains can exist. The domains have identical absolute values of the propagation vectors, but differ in orientation. This has been observed in both MnSi and Cu2OSeO3 systems by real-time LTEM, and in Fe1-xCoxSi by SANS Münzer et al. (2010); Adams et al. (2010). One can observe the rotating skyrmion domains, confirmed by the two sets of six-fold symmetric spots of the Fourier transform images Mochizuki et al. (2014).
In a recent study, Langner et al. Langner et al. (2014) reported resonant soft x-ray scattering (REXS) of Cu2OSeO3. In their experiment the wavelength of the polarized x-rays was tuned to the Cu edge, and the magnetic diffraction spots were captured on the CCD camera plane in the (001) Bragg condition. In the camera image, the shape of the magnetic satellites is field- and photon energy-dependent, and develops a fine structure, ultimately splitting into more than one spot. The authors interpret this spot splitting as arising from the moiré pattern of two superposed skyrmion sublattices, which originate from two inequivalent Cu sites, as evidenced by a 2 eV split in their x-ray absorption spectra.
We performed resonant soft x-ray diffraction experiments on a well-characterized Cu2OSeO3 single crystal Omrani et al. (2014) and obtained a reciprocal space maps in the -plane of the skyrmion phase. In the following we give a detailed description of these measurements and present a critical discussion of Langner et al.’s results together with an alternative explanation for the peak splitting of the magnetic diffraction peaks observed in Cu2OSeO3 based on the formation of a multidomain state.
II Resonant scattering
For resonant scattering at the edge of transition metals it is sufficient to take only electric-dipole transitions into account van der Laan (2008). Further, there are two main characteristics of materials worth noting. First, the photon energy falls into the range of 0.4-1 keV, leading to relatively long wavelengths, which limits the number of accessible materials for experiments in reflection geometry. At the Cu edge, the x-ray wavelength is Å. For B20 helimagnetic metals, such as MnSi, FexCo1-xSi, or FeGe, the (structural) lattice constant is around 4.5-4.7 Å Nagaosa and Tokura (2013). Since , where is the Bragg angle, no structural Bragg reflection is accessible. Cu2OSeO3, on the other hand, has a relatively large lattice constant ( = 8.925 Å) Bos et al. (2008) so that the (forbidden) (001) peak is accessible. This provides an ideal condition for performing resonant elastic x-ray scattering (REXS) in reflection geometry. Second, the penetration depth of soft x-rays varies strongly for photon energies across the absorption edge van der Laan (2008). The scattering is more bulk-sensitive for photon energies below the and further above the edges, whereas it is more surface-sensitive at resonance. In Cu2OSeO3 the x-ray attenuation length at normal incidence at the edge maximum is 95 nm, while below the absorption edge the attenuation length is 394 nm van der Laan and Figueroa (2014).
In a REXS experiment, magnetic diffraction occurs around a structural Bragg peak, as the local magnetic moments are connected to the magnetic atoms that give rise to the resonant diffraction. Therefore, for scattering from single-crystalline Cu2OSeO3, the positions of the magnetic satellites around (001) yield the information about the orientation and periodicity of the modulation. The diffraction intensity reveals information about the detailed magnetization configuration . This is the basic principle for characterizing magnetic structures and for distinguishing between different magnetic phases. Note that for space group the (001) peak is crystallographically forbidden and absent in off-resonant scattering, however, the anisotropic third-rank tensor stemming from the mixed dipole-quadrupole term allows for the extinction peak to appear for non-centrosymmetric crystals at the x-ray resonance condition Templeton and Templeton (1994); Dmitrienko and Chizhikov (2012).
Cu2OSeO3 is a chiral magnet, suggesting ordered spin helices, which further host, in a pocket of the - (temperature vs magnetic-field) phase space, ‘crystalline’ magnetic order in the form of the skyrmion lattice. The magnetic modulation is incommensurate, which means that it is decoupled from the atomic lattice. Moreover, the modulation has a long periodicity Adams et al. (2012). Therefore, the continuum approximation can be applied to model the magnetic properties Nagaosa and Tokura (2013). The system’s ground state () is the one-dimensional, helically ordered state composed of single-harmonic modes, where is the wave vector of the helix with being the real-space helical pitch. The orientation of the modulation is pinned along a direction by the cubic anisotropy White et al. (2014b). The magnetization configuration for one helical pitch is illustrated in Fig. 1(a), in which the modulation is along . This is the elemental unit of the helical periodic structure, i.e., the motif of the magnetic crystal. It is worth mentioning that the helical pitch is equal to the helix-to-helix distance for Cu2OSeO3, as well as other B20 metallic helimagnets. This is well-established by both SANS Adams et al. (2012); Seki et al. (2012c) and LTEM Seki et al. (2012a); Rajeswaria et al. (2015) studies.
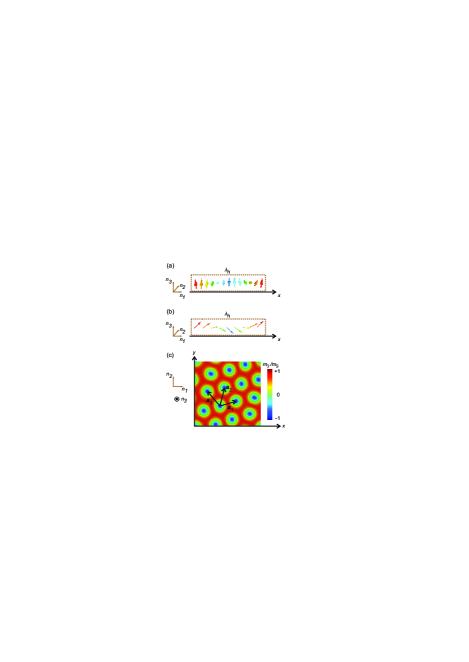
Above a certain magnetic field , the conical spiral state becomes the lowest energy solution. The single-harmonic spiral has the same pitch as the helical state. The spiral rotates in the - plane. The magnetization component along -direction is proportional to the magnetic field. At a certain field, , all the magnetization vectors are parallel, forming the ferrimagnetic state. The conical periodic order can also be described by a unit cell that consists of two conical spirals.
The skyrmion vortex structure is a metastable solution in the phenomenological model, unless thermal fluctuation are being taken into account Mühlbauer et al. (2009). A single skyrmion vortex, as shown in Fig. 1(c), can be written in the form of an axially symmetric magnetization distribution Zhang et al. (2015),
| (1) | ||||
using polar coordinates with and . satisfies the Euler equation and is the winding number.
Thus, the form factor for an individual skyrmion can be written in the form of
| (2) |
The integral is taken over the circular area of a skyrmion vortex. In contrast to the helical and conical states, the skyrmion state is a two-dimensional solution. The ‘crystal’ structure is essentially a hexagonal-type two-dimensional lattice. Therefore, the two-dimensional unit cell can be chosen as shown in Fig. 1(c). The structure factor then becomes
| (3) |
where , , are the real-space basis vectors, which are rotated by with respect to each other. The core-to-core distance is , which can be regarded as the ‘lattice constant’ of the skyrmion crystal.
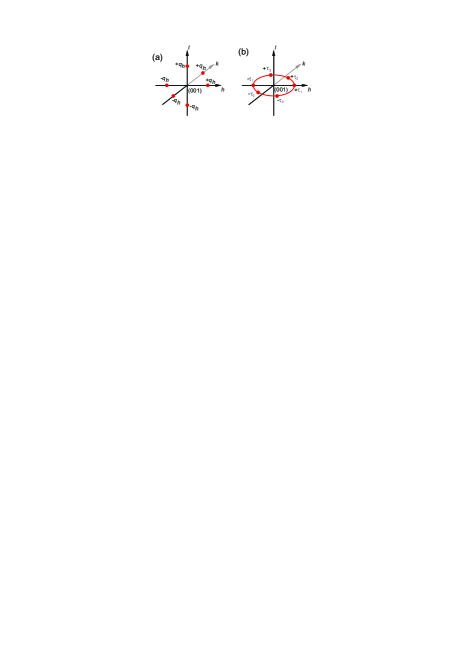
Using the form factors of the helical (), conical (), and skyrmion () motifs, as well as their structure factors , , and of the unit cells, one can easily obtain the reciprocal space maps. In the helical state, the ‘lattice constant’ is equal to the helical pitch. Therefore, the first-order diffraction peaks appear at , and the reciprocal lattice is purely one-dimensional. In Cu2OSeO3, the direction of is not entirely degenerate, but additionally governed by the sixth order magnetic anisotropy, giving rise to the three-fold degenerate preferred orientation along the three equivalent directions. Consequently, three spatially separated helical domains are expected. Moreover, the helical magnetic reciprocal space lattice has to be imposed on the crystalline reciprocal space lattice in order to obtain the diffraction condition. The reciprocal space of the helical crystal is plotted in Fig. 2(a), and summarized in Table 1. In the conical state, the reciprocal space is similar to the one of the helical phase in that the first order diffraction peaks (modulation vector) appear at . On the other hand, the direction of is entirely governed by the magnetic field direction, and in fact parallel to it. Therefore, there is only a ‘single domain’ state observed, as summarized in Table 1. In the skyrmion state, the reciprocal space [cf., Fig. 2(b)] has three reciprocal-space basis vectors , , and . They are separated by and are related to the three lattice constants by . Therefore, the diffraction peaks appear at around the (001) diffraction, as shown in Fig. 2(b) and Table 1.
| Phase | Modulation vectors | Magnetic reflections |
|---|---|---|
| Helical | (0,0,), (0,0,-) | (0,0,1) |
| (,0,0), (-,0,0) | (,0,1) | |
| (0,,0), (0,-,0) | (0,,1) | |
| Conical | (0,0,), (0,0,-) | (0,0,1) |
| Skyrmion | (,0,0), (-,0,0) | (,0,1) |
| , | ||
| , |
III Experimental REXS Results
We performed REXS experiments on a well-characterized Cu2OSeO3 single crystal Omrani et al. (2014). Instead of taking single CCD images at the crystalline (001) Bragg condition, we carried out reciprocal space maps (RSMs) by rocking the sample around the (001) peak such that the entire helix propagation-related reciprocal space is covered. Figure 3(a) shows the RSM of the plane () at 56.6 K in an applied field of 30 mT along the (001) direction. The incident x-rays are linearly polarized with a photon energy of 931.25 eV. Six sharp satellite peaks can be observed, corresponding to the skyrmion phase. Moreover, when scanning both temperature and field across the skyrmion phase region, no peak splitting is observed. This suggests a six-fold symmetric equilibrium ordering in the entire skyrmion phase pocket.
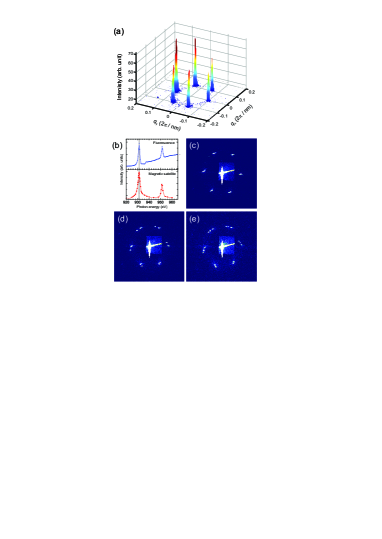
We performed RSMs for each energy point, and plot the spectroscopic profile using the integrated satellite intensity in Fig. 3(b), bottom panel. Figures 3(c-e) show single-shot CCD images in the (001) Bragg condition with the field orientation rotated away from the (001) direction (in the scattering plane) and from the direction of the incoming x-rays. Now, the well-defined six spots split into two, and finally three sets. This confirms the existence of a multidomain skyrmion state, where each domain has a different helix propagation orientation, which can be intentionally created by introducing a magnetic field gradient. This observation of a multidomain state is consistent with earlier LTEM work by Tokura et al. Mochizuki et al. (2014), where split peaks (in the Fourier transforms of the LTEM domain patterns) were observed as part of a dynamic domain rotation process (see Supplementary Movie S2 in Ref. Mochizuki et al. (2014)). It has to be noted that x-ray based techniques are sampling a much larger area than electron microscopy based techniques, meaning that a multidomain state observable by LTEM will be picked up by REXS as well.
IV Discussion
Resonant soft x-ray diffraction experiments on Cu2OSeO3 single crystals has been previously carried out by Langner et al. Langner et al. (2014), where the observation of two sets of six-fold symmetric spots has been reported. The authors state that the peak splitting arises from the two inequivalent Cu sites. They support this statement by an observed 2-eV difference in energy profiles for the so-called ‘left’ and ‘right’ spot spectra (shown in Fig. 2 of Ref. Langner et al. (2014)). They further argue that the two-fold splitting is linked to an in-plane rotation of two skyrmion sublattices, leading to a moiré pattern (Fig. 4 in Ref. Langner et al. (2014)).
Bond valence sum calculations show that the two inequivalent CuI and CuII sites in Cu2OSeO3 (where the superscripts I and II refer to the different lattice sites, not to different oxidation states) have practically the same valence charge Bos et al. (2008), and density functional theory calculations show that their unoccupied states have very similar energies Yang et al. (2012a). We note that the Cu transition for Cu2+ is . In the final state the shell is full, which reduces the transition to a one-electron process without - core-hole interaction. This gives a single absorption peak at 931 eV without multiplet splitting van der Laan et al. (1992). There are no known Cu compounds with such a large splitting energy, and in fact, the energy splitting that could be expected would be well below 1 eV. As reported by Bos et al. Bos et al. (2008), and earlier by other others, CuI and CuII have practically the same valence charge, which can only result in a minute energy shift in the Cu absorption spectrum, well below the energy resolution limit (and certainly less than 2 eV reported in Ref. Langner et al. (2014)). Note that the case would be of course very different for systems in which multiplet splitting exists, such as Fe compounds van der Laan and Thole (1991). Since CuO2 exhibits a peak at 933 eV van der Laan et al. (1992), one possible explanation is that the higher energy peak is due to a Cu1+ contamination.
Alternatively, another possible source of the discrepancy is the way the energy scans are carried out. In particular, spectroscopic data obtained by analyzing the local pixels at the CCD plane is rather inaccurate, as the definition of the ‘left’ and ‘right’ spots on the camera is arbitrary for each energy. Most importantly, for different photon energies, scattering from the same propagation wave vector will result in a shift of the spot in the camera plane, leading to a ‘rocking-curve-like’ Gaussian peak. Therefore, from a spectroscopic viewpoint, there is no evidence that the split-satellite peak is due to inequivalent Cu sites.
A core argument for the formation of double-split six-fold diffraction patterns, given in Ref. Langner et al. (2014) (Fig. 4), is that the superposition of two in-plane rotated skyrmion sublattices leads to a moiré pattern. However, the real-space moiré pattern and the presented Fourier transform (diffraction pattern) are mathematically not related. Rather, the superposition leads to new components in the Fourier spectrum, in particular six-fold symmetric satellites around the main reciprocal lattice points that result from the long wavelength beating in the moiré pattern—a phenomenon well-known from hexagonal coincidence lattices Zeller and Günther (2014).
Further, it is important to consider another requirement that has to be met in order to carry out REXS experiments in a quantitative way. In the experiment reported in Ref. Langner et al. (2014) the skyrmion plane is always perpendicular to the vertical direction of the laboratory reference frame, given by the fixed direction of the magnetic field, and it is thus independent of the goniometer angle . There are (at least) six wave vectors () coupled to the (001) Bragg peak, giving rise to the observed magnetic peaks. In Fig. 2(a) in Ref. Langner et al. (2014), these magnetic peaks are different in both amplitude and orientation. Therefore, for a single , it is impossible to reach the diffraction conditions for all six magnetic peaks at the same time. The observed skyrmion pattern (CCD images in Figs. 1(b) and 2(a) in Langner et al. (2014)) was collected in the structural (001) Bragg condition, which is not the correct diffraction condition for either of the magnetic satellites. As a result of this, the satellites still have intensity, analogously to sitting at the edge of a rocking-curve peak. A single-shot CCD image corresponds to a curved plane in reciprocal space, which is not equal to the skyrmion plane in reciprocal space. As a result of this, the skyrmion diffraction spots will not end up on a circle, but on an oval, as can be seen in Fig. 2(a) in Ref. Langner et al. (2014). These satellite spot on the camera does not correspond to the peak position of (001)+, but a poorly-defined reciprocal space point that could largely deviate from (001)+. Also, the magnetic peaks of (001)+ will not necessarily appear on the same oval for a single goniometer angle as they do not reach the diffraction conditions at this angle.
Instead, a much more simple explanation of a peak splitting in this context is the occurrence of two non-superimposed skyrmion lattice domains that are simultaneously sampled by the wide x-ray beam.
V Summary and Conclusions
In conclusion, we used REXS on the chiral magnet Cu2OSeO3. We presented a detailed discussion of the magnetic contrast stemming from the magnetic phases. We showed experimental results of the six-fold symmetric magnetic diffraction pattern, in which the peaks were unsplit, double-split, as well as triple-split, depending on the magnetic history of the sample. This clearly contradicts the interpretation given in Ref. Langner et al. (2014) where the double-split peaks have been associated with the two chemically distinct Cu sites. Instead, by carefully performing XAS measurements, we find no evidence of a peak splitting. Oppositely, a more simple explanation is the occurrence of a multidomain skyrmion state, sampled by the relatively wide x-ray beam.
Acknowledgments
The REXS experiments were carried out on beamline I10 at the Diamond Light Source, UK, under proposals SI-11784 and SI-12958. S. L. Z. and T. H. acknowledge financial support by the Semiconductor Research Corporation. A. B. and C. P. acknowledge financial support through DFG TRR80 and ERC AdG (291079, TOPFIT).
References
- Mühlbauer et al. (2009) S. Mühlbauer, B. Binz, F. Jonietz, C. Pfleiderer, A. Rosch, A. Neubauer, R. Georgii, and P. Böni, Science 323, 915 (2009).
- Jonietz et al. (2010) F. Jonietz, S. Mühlbauer, C. Pfleiderer, A. Neubauer, W. Münzer, A. Bauer, T. Adams, R. Georgii, P. Böni, R. A. Duine, K. Everschor, M. Garst, and A. Rosch, Science 330, 1648 (2010).
- Yu et al. (2010) X. Z. Yu, Y. Onose, N. Kanazawa, J. H. Park, J. H. Han, Y. Matsui, N. Nagaosa, and Y. Tokura, Nature (London) 465, 901 (2010).
- Seki et al. (2012a) S. Seki, X. Z. Yu, S. Ishiwata, and Y. Tokura, Science 336, 198 (2012a).
- Schulz et al. (2012) T. Schulz, R. Ritz, A. Bauer, M. Halder, M. Wagner, C. Franz, C. Pfleiderer, K. Everschor, M. Garst, and A. Rosch, Nat. Phys. 8, 301 (2012).
- Milde et al. (2013) P. Milde, D. Köhler, J. Seidel, L. M. Eng, A. Bauer, A. Chacon, J. Kindervater, S. Mühlbauer, C. Pfleiderer, S. Buhrandt, C. Schütte, and A. Rosch, Science 340, 1076 (2013).
- Fert et al. (2013) A. Fert, V. Cros, and J. Sampaio, Nat. Nanotech. 8, 152 (2013).
- Nagaosa and Tokura (2013) N. Nagaosa and Y. Tokura, Nat. Nanotechnol. 8, 899 (2013).
- Romming et al. (2013) N. Romming, C. Hanneken, M. Menzel, J. E. Bickel, B. Wolter, K. von Bergmann, A. Kubetzka, and R. Wiesendanger, Science 341, 636 (2013).
- Mochizuki et al. (2014) M. Mochizuki, X. Z. Yu, S. Seki, N. Kanazawa, W. Koshibae, J. Zang, M. Mostovoy, Y. Tokura, and N. Nagaosa, Nat. Mater. 13, 241 (2014).
- Schwarze et al. (2015) T. Schwarze, J. Waizner, M. Garst, A. Bauer, I. Stasinopoulos, H. Berger, A. Rosch, C. Pfleiderer, and D. Grundler, Nat. Mater. 14, 478 (2015).
- Münzer et al. (2010) W. Münzer, A. Neubauer, T. Adams, S. Mühlbauer, C. Franz, F. Jonietz, R. Georgii, P. Böni, B. Pedersen, M. Schmidt, A. Rosch, and C. Pfleiderer, Phys. Rev. B 81, 041203 (R) (2010).
- Adams et al. (2010) T. Adams, S. Mühlbauer, A. Neubauer, W. Münzer, F. Jonietz, R. Georgii, B. Pedersen, P. Böni, A. Rosch, and C. Pfleiderer, J. Phys.: Conf. Ser. 200, 032001 (2010).
- Yu et al. (2011) X. Z. Yu, N. Kanazawa, Y. Onose, K. Kimoto, W. Z. Zhang, S. Ishiwata, Y. Matsui, and Y. Tokura, Nat. Mater. 10, 106 (2011).
- Seki et al. (2012b) S. Seki, X. Z. Yu, S. Ishiwata, and Y. Tokura, Science 336, 198 (2012b).
- Langner et al. (2014) M. C. Langner, S. Roy, S. Mishra, J. Lee, X. Shi, M. Hossain, Y.-D. Chuang, S. Seki, Y. Tokura, S. Kevan, and R. Schoenlein, Phys. Rev. Lett. 112, 167202 (2014).
- Miller et al. (2010) K. H. Miller, X. S. Xu., H. Berger, E. S. Knowles, D. J. Arenas, M. W. Meisel, and D. B. Tanner, Phys. Rev. B 82, 144107 (2010).
- Bos et al. (2008) J.-W. G. Bos, C. V. Colin, and T. T. M. Palstra, Phys. Rev. B 78, 094416 (2008).
- Yang et al. (2012a) J. H. Yang, Z. L. Li, X. Z. Lu, M.-H. Whangbo, S.-H. Wei, X. G. Gong, and H. J. Xiang, Phys. Rev. Lett. 109, 107203 (2012a).
- White et al. (2014a) J. S. White, K. Prša, P. Huang, A. A. Omrani, I. Živković, M. Bartkowiak, H. Berger, A. Magrez, J. L. Gavilano, G. Nagy, J. Zang, and H. M. Rønnow, Phys. Rev. Lett. 113, 107203 (2014a).
- Yang et al. (2012b) J. H. Yang, Z. L. Li, X. Z. Lu, M.-H. Whangbo, S.-H. Wei, X. G. Gong, and H. J. Xiang, Phys. Rev. Lett. 109, 107203 (2012b).
- Omrani et al. (2014) A. A. Omrani, J. S. White, K. Prša, I. Živković, H. Berger, A. Magrez, Y.-H. Liu, J. H. Han, and H. M. Rønnow, Phys. Rev. B 89, 064406 (2014).
- van der Laan (2008) G. van der Laan, C. R. Physique 9, 570 (2008).
- van der Laan and Figueroa (2014) G. van der Laan and A. I. Figueroa, Coord. Chem. Rev. 277-278, 95 (2014).
- Templeton and Templeton (1994) D. H. Templeton and L. K. Templeton, Phys. Rev. B 49, 14850 (1994).
- Dmitrienko and Chizhikov (2012) V. E. Dmitrienko and V. A. Chizhikov, Phys. Rev. Lett. 108, 187203 (2012).
- Adams et al. (2012) T. Adams, A. Chacon, M. Wagner, A. Bauer, G. Brandl, B. Pedersen, H. Berger, P. Lemmens, and C. Pfleiderer, Phys. Rev. Lett. 108, 237204 (2012).
- White et al. (2014b) J. S. White, K. Prša, P. Huang, A. A. Omrani, I. Živković, M. Bartkowiak, H. Berger, A. Magrez, J. L. Gavilano, G. Nagy, J. Zang, and H. M. Rønnow, Phys. Rev. Lett. 113, 107203 (2014b).
- Seki et al. (2012c) S. Seki, J.-H. Kim, D. S. Inosov, R. Georgii, B. Keimer, S. Ishiwata, and Y. Tokura, Phys. Rev. B 85, 220406(R) (2012c).
- Rajeswaria et al. (2015) J. Rajeswaria, H. Pinga, G. F. Mancini, Y. Murooka, T. Latychevskaia, D. McGrouther, M. Cantoni, E. Baldini, J. S. White, A. Magrez, T. Giamarchi, H. M. Rønnow, and F. Carbone, Proc. Natl. Acad. Sci. U.S.A. 112 (2015).
- Zhang et al. (2015) S. L. Zhang, A. A. Baker, S. Komineas, and T. Hesjedal, Sci. Rep. 5, 15773 (2015).
- van der Laan et al. (1992) G. van der Laan, R. A. D. Pattrick, C. M. B. Henderson, and D. J. Vaughan, J. Phys. Chem. Solids 53, 1185 (1992).
- van der Laan and Thole (1991) G. van der Laan and B. T. Thole, Phys. Rev. B 43, 13401 (1991).
- Zeller and Günther (2014) P. Zeller and S. Günther, New J. Phys. 16, 083028 (2014).