Understanding the Thermoelectric Properties of LaCoO3 Compound
Abstract
We present the thermoelectric (TE) properties of LaCoO3 compound in the temperature range 300-600 K. The experimental value of Seebeck coefficient () at 300 K is found to be 635 V/K. The value of decreases continuously with increase in temperature and reaches to 46 V/K at 600 K. The electronic and TE properties of the compound have also been investigated by combining the ab-initio electronic structures and Boltzmann transport calculations. LSDA plus Hubbard U (U= 2.75 eV) calculation on low spin configuration of the compound gives an energy gap of 0.5 eV, which is close to the experimentally reported energy gap. The effective mass of holes (m) at point is nearly two times larger than the value of effective mass of electrons (m) at FB point along the L and T directions, whereas the m at FB point along the direction is nearly eight times larger than the value of m at point along the FB direction. The large effective mass at FB point along the direction suggests that the TE property of this compound is mainly decided by the effective mass of the charge carriers in this direction. The calculated temperature dependent values of are in fairly good agreement with experimental data in the temperature range 300-360 K, and above this temperature slight deviation is observed. The value of power factor (PF) for n-type is 1.3 times larger the value of p-type doped compound at 1100 K. The value of figure-of-merit (ZT) for n-type doped compound is obtained 0.35 in the temperature range 600-1100 K, which suggests that with appropriate n-type doping this compound can be used as a good TE material in the high temperature region.
Keywords: Seebeck coefficient, Electronic structures, Thermoelectric properties, Oxide thermoelectric
I Introduction
In the last few decades, fast consumption rate of available natural sources of energy (oils and gases) due to large need of mankind demands an alternate source of energy without affecting the environmental conditions DiSalvo99 . The various devices such as solar, hydro-power, bio-mass and thermoelectrc (TE) generators are being used to generate the required electricity. Among all these, TE generators have attracted much attention due to their potential capabilities of direct conversion of waste heat into useful electricity.2,3 Using TE generators one can also utilize the waste heat generated from the other power generating sources and convert it into the electricity.4,5 TE devices have various applications in electricity generation, TE cooler, temperature sensors etc.6 There are various TE materials such as, lead and bismuth chalcogenides, silicon-germanium based materials, Clathrates, Half-Heusler alloys and organic TE materials have been explored for making the TE devices.7 These materials have the limitations of use in high temperature region due to the chemical and thermal stabilities, high cost factor in the device fabrication, environmentally unfavourable and hazardous issues. To overcome these issues and have wide temperature TE applications in the high temperature region, the metal oxides give a new hope for the researchers.8-10 In 1997, the discovery of p-type NaCoO2 with a ZT value 1 gave a breakthrough to explore more oxide materials for the TE applications.11
In high temperature region, oxide materials are more suitable for the TE applications due to their structural and chemical stabilities, oxidation resistance and low cost.12-16 Therefore, it is important to estimate the physical parameters by which one can check the potential capabilities of oxide materials to be used for the TE applications. Any material is suitable for the TE applications is decided by the dimensionless parameter called as ZT. The ZT is defined as,17,18
| (1) |
where is Seebeck coefficient (also known as thermopower), and (l +) are the electrical and thermal conductivities, respectively. The term 2 in the numerator is known as power factor. For large value of ZT, the material should have large PF and small .19 The materials having large value of ZT are more efficient for converting the waste heat into useful electricity.20
Transition metal oxides having Perovskite-based structure, have been extensively studied due to their flexible crystal structure and shows interesting physical properties such as colossal magnetoresistance, ferroelectricity, and thermoelectricity.21,22 In the search of suitable oxides for TE applications, cobalt oxides having perovskite structure were found more interesting due to its large Seebeck coefficient and semiconducting or metallic electrical conductivity.23-25 Lanthanum cobalt oxides, LaCoO3 with rhombohedra distorted perovskite structure exhibits a large positive Seebeck coefficient at room temperature, with = 640 μV/K.26,27 The experimental and theoretical studies of electronic properties for this compound have been studied by many groups.25-34 Although the thermopower, electrical and thermal conductivities of LaCoO3 have been studied in the wide temperature range. However, a detailed understanding of the large and positive observed in the compound by using the electronic structure calculation is still missing. This gives us a direction to investigate the high temperature TE properties of the LaCoO3 by using experimental and theoretical tools.
In the present work, we have performed the temperature dependent Seebeck coefficient () measurement on LaCoO3 compound in the range 300-600 K. The observed values of at 300 and 600 K are 635 and 46 V/K, respectively. The temperature dependent behavior of is non-linear in the range 300-540 K, whereas it is almost linear in the range 540-600 K. To understand the TE behavior of this material, we have studied the electronic and TE properties by combining the ab-initio electronic structures and Boltzmann transport calculations. The value of energy gap is found to be 0.5 eV, which is close to experimental band gap of 0.6 eV.34,35 To know the contributions of charge carriers in , the total and partial density of states have been plotted for Co 3d orbitals and O 2p orbitals. The electronic band structure along high symmetric points is also plotted and effective masses of holes and electrons have been estimated from this. The values of in the temperature range 300-1100 K are obtained from the BoltzTraP calculations. The calculated values of show similar temperature dependent behavior as reported in literature. In the temperature range 300-360 K, the calculated values of have good matching with experimental values. To see the effect of doping on TE behavior of the compound, we have plotted the chemical potential () dependent power factor (PF) at various temperatures. At 1110 K, the PF’s value for positive comes out 1.3 times larger than the value of PF for negative . The value of ZT are evaluated in the temperature range 300-1100 K by using the peak value of power factor () corresponding to positive value of chemical potential and thermal conductivities values reported by Pillai et al.49 The value of ZT is found to be 0.35 in the temperature range 600-1100 K.
II Experimental and Computational details
The Polycrystalline LaCoO3 sample was prepared by using the single step solution combustion method.36 The detailed synthesis procedure of LaCoO3 compound is given in our earlier work.37 The sample used for measurement was made in the pellet form under the pressure of 35 Kg/cm2. Further, pellet was sintered at 1000 0C for 24 hours. The diameter and thickness of the sample were 5 mm and 0.5 mm, respectively. The temperature dependent values of were obtained in the temperature range 300-600 K by using the home-made Seebeck coefficient measurement setup.37
The electronic structures calculations on LaCoO3 compound in low spin configurations of Co3+ ions (with S=0) were performed by using the full-potential linearized augmented plane-wave (FP-LAPW) method within the density functional theory (DFT) implemented in WIEN2k code.38 The TE properties of the compound have been studied by using the BoltzTraP code.39 LSDA+U approximation have been used to account the electronic correlations, where U is the on-site Coulomb interaction strength among Co 3d electrons.40 The calculated energy band gap is found to be closer to the experimental value by considering the value of U = 2.75 eV.35 The experimental lattice parameters corresponding to 300 K temperature and atomic coordinates of La, Co and O atoms used for the calculations were taken from the literature.41 The muffin-tin sphere radii used in the calculations were set to 2.45, 1.94 and 1.67 Bohr for La, Co, and O atoms, respectively. The value of RMTKmax, which determines the matrix size for convergence was set equal to 7, where RMT is the smallest atomic sphere radius and Kmax is the plane wave cut-off. The self-consistency was achieved by demanding the convergence of the total charge/cell to be less than 10-4 electronic charge, which gives rise the energy convergence less than the 10-5 Ry. The k-point mesh size was set to be 404040 during the calculations of electronic and transport properties. The value of lpfac parameter, which represents the number of k-points per lattice point, was set to be 5 for the calculation of TE properties.
III Results and Discussion
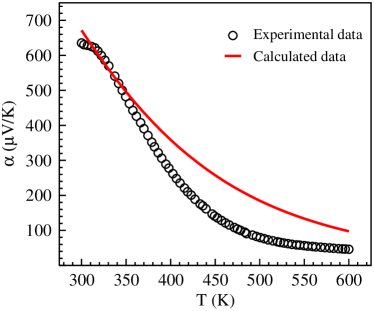
The temperature dependent for the compound is shown in Fig. 1.

The values of are positive in the 300-600 K temperature range. At 300 K, the observed value of is 635 V/K. As the temperature increases from 300 K to 600 K, the value of decreases continuously. The observed value of at 600 K is equal to 46V/K. The temperature dependence variation in is almost similar to the reported data in the literature.26,27 The value decreases with very fast rate in the temperature range 300-540 K and change of 576 V/K is observed in the same temperature interval. For the temperature range 540-600 K, the change in the value of is 13 V/K. The variation in the is non-linear in the temperature range 300-540 K. For temperature above 540 K, the values of show almost a linear behavior. For the sake of clarity, the linear fit of experimental data is shown in the inset of Fig. 1. The linear temperature behavior above 540 K is associated with the insulator-to-metal transitions.42
To understand the large and positive values of exhibited by the compound, we have carried out the electronic structure calculations. The total density of states (TDOS) for the compound is shown in the Fig. 2a.

The electronic properties are calculated in the ground state (T= 0 K). Thus, the chemical potential in DOS plots can be taken at the middle of the energy gap. The dashed line represents the , which is at the middle of energy gap. It is evident from the TDOS plot that LaCoO3 is an insulating material with energy gap of 0.5 eV, which is in accordance to the observed energy gap.35 In the low spin state, calculated DOS for up and down spins are found equal and opposite. Thus, it is evident from the TDOS plot that system has non-magnetic ground state.
In order to see the contributions of electrons to from different atomic orbitals, we have also shown the partial density of states (PDOS) plots for Co and O atoms. The PDOS plot for Co 3d orbitals is shown in the Fig. 2b. For the rhombohedral lattice, five degenerate d orbitals split into non-degenerate d orbital; doubly degenerate d and dxy orbitals; and doubly degenerate dxz and dyz orbitals. Here, doubly degenerate d and dxy orbitals are represented by d+dxy; and doubly degenerate dxz and dyz orbitals by dxz+dyz notation. From the PDOS of Co 3d orbitals, it is clearly observed that in valence band (VB) contributions in DOS are from all three states, d, d+dxy and dxz+dyz, whereas in conduction band (CB) only d+dxy and dxz+dyz states closer to Fermi level (EF) contribute in the DOS. For the sake of clarity, the regions around top of the VB and bottom of the CB are shown in the inset of the Fig. 2b. At the top of VB, the contributions in DOS is only from the d orbital. Therefore, thermally excited electrons from this d orbital will contribute maximum to the value of . The energy of d+dxy and dxz+dyz states is 145 meV lower than that of d state. Thus, at 300 K thermally excited electrons from VB to the CB will be mainly from the d state. As the temperature increases, the number of thermally excited electrons from the d+dxy and dxz+dyz states will also be increase. The temperature corresponding to the energy gap of 145 meV is 1740 K. At this temperature, the transitions of thermally excited electrons from VB to CB will be almost equal in number. Thus at 1740 K, the contributions to by thermally excited electrons will be nearly equal from the d, d+dxy and dxz+dyz states. At the bottom of the CB, there are two orbitals d+dxy and dxz+dyz, which contribute to the DOS. Hence, these two orbitals will be mainly occupied by the thermally excited electrons from VB. There is no contribution in DOS from the d orbital at bottom of the CB. Thus, there will be no contribution to by CB electrons from d orbital. At energy 80 meV from bottom of the CB, the DOS for d+dxy orbitals have nearly two times larger value than dxz+dyz orbitals. Therefore, the d+dxy orbitals will occupy nearly twice the number of thermally excited electrons and thus have more contributions in the value of LaCoO3.
The PDOS of oxygen atom (2p orbitals) is shown in the Fig. 2c. For both VB and CB, there are contributions in the DOS from all the three states of p orbital i.e. px, py and pz. The VB and CB regions about is shown in the inset of Fig. 2c for the sake of clarity. It is observed that the DOS contribution at top of the VB is from the px and py states, whereas at the bottom of CB pz states contribute in the DOS. The DOS value of px orbital near the top of VB are 10 times smaller than the DOS of d orbital. Therefore, the contributions in the value of is very small from the p orbital electrons. From the inset of Fig. 2b and 2c, the shape of DOS for different orbitals in VB clearly depicts the hybridization between p and d orbitals. In VB region closer to EF, the d orbital hybridized with px and py orbitals, whereas d+dxy and dxz+dyz orbitals hybridized with pz orbital. In CB shape of PDOS closer to EF show that d+dxy and dxz+dyz orbitals are hybridized with pz orbital.
The magnitude of is decided by the effective mass, types of charge carriers and carriers concentrations, whereas its sign is decided by the effective mass of the charge carrier. To understand the large and positive values of shown by the LaCoO3, it is essential to calculate the effective masses of the holes and electrons. The effective masses of charge carriers can be estimated from the electronic band structure, therefore the dispersion curves for different k-values are calculated along the high symmetric points. The dispersion curves along the high symmetric , T, L, and FB points are shown in Fig. 3.
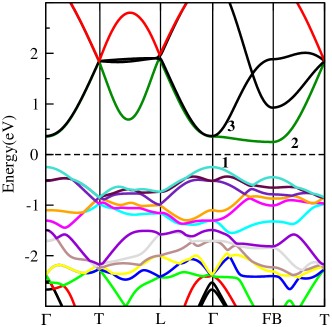
The primitive basis co-ordinates of these high symmetric points corresponds to Rc space group are taken from the Bilbao crystallographic server.43It is evident from the dispersion curves, the top of the VB and bottom of the CB lies at and FB point, respectively. Therefore, LaCoO3 compound is an indirect band gap semiconductor. The estimated energy of indirect band gap from the dispersion curve is found to be 0.5 eV. The top of the VB (Band 1) and bottom of the CB (Band 2) are non-degenerate. The minimum of second band (i.e. Band 3) from the bottom of CB lies at the point. The energy gap between top of the VB and bottom of the CB (Band 3) is 0.6 eV. This energy gap is corresponding to the temperature of 7200 K. The band 2 and 3 in the CB are doubly degenerate at point. The magnitude of effective mass at a given k-point is decided by the shape of energy band. At a given k-point, the flat band energy curve has the larger effective mass in comparison to the narrower energy curve. From the dispersion curve, it is observed that at FB point the energy curve (Band 2) have more flat shape along the direction in comparison of the curve along T direction. Therefore, one expect a large effective mass of the electrons at FB point along the direction. For the VB energy curve (Band 1), the shape of the energy band at point is almost symmetric along FB and L directions. Thus, the effective mass of the holes will be nearly equal along these directions. The shape of band 1 at point and along the FB direction is more flat than the shape of band 2 at FB point along the T direction, whereas the shape of energy curve of band 1 at point along L direction is narrower than the shape of band 2 at FB point along direction. Thus, the effective mass of electrons at FB point in band 2 and along direction is expected very large than that of holes effective mass at point along L direction.
To understand the effective mass contributions to from the charge carriers (holes and electrons), we have estimated the effective mass along the high symmetric direction by using the dispersion curve. The effective mass of holes and electrons are calculated at point (along L, FB, T directions) and FB point (along , L, and T directions), respectively. The calculated effective mass is given in the Table I.
| Effective mass (m∗/me) | |||||
|---|---|---|---|---|---|
| High-Symmetry Point | Valence Band | Conduction Band | |||
| L | 1.87 | - | |||
| FB | 1.82 | - | |||
| T | 1.76 | - | |||
| FBFB | - | 14.70 | |||
| FBFBL | - | 0.84 | |||
| FBFBT | - | 1.01 | |||
The notation L used in the table represents the effective mass calculated at point along the L direction and similarly for others. The calculated effective mass of holes at point along L and T direction are nearly two times larger of the electron’s effective mass at FB point, whereas effective mass of electrons at FB point along the direction is nearly eight times larger of the effective mass of holes at point along the FB direction. From the estimated values of effective masses of holes and electrons along different directions, it is expected that electrons will be the dominating charge carriers in the contributions to the thermopower due to their large effective mass (m = 14.7me) at FB point along the direction. Thus, one expect large and negative for the LaCoO3 compound. From the calculations, the large and negative value of is also obtained at middle of the energy band gap (i.e. = 0 eV). But, the experimentally observed value of for LaCoO3 is large and positive. At this point one should keep in mind that for an intrinsic semiconductor materials has temperature dependence through the following expression44
| (2) |
where v is the energy of the electron at the top of the VB, and are the effective mass of the charge carrier in VB and CB, respectively. Using the effective mass of the electrons, m = 14.7 me, and effective mass of the holes, m = 1.8 me, the value of at 300 K comes out to be -40 meV. The shift of below the middle of the gap represents the hole type behavior. Thus, one should expect a positive value of for the LaCoO3. The variations of with at various temperatures is shown in the Fig. 4.

The vertical solid line drawn at -40 meV represents the chemical potential at 300 K. The calculated value of for = -40 meV is found to be 670 V/K, which is closer to the experimental value 635V/K. The calculated ’s value in the temperature range 300-600 K along with experimental data for a fixed ( i.e. = -40 meV from the middle of the energy gap) are shown in the Fig. 5. The values of obtained from the calculations have reasonably good match with experimental data in the temperature range 300-360 K. Above 360 K, difference in calculated and experimental data is observed. In our earlier work, we observed a better matching between calculated and experimental data for ZnV2O4 compound in the temperature range 200-400 K.45 From the Fig. 5, we observed the difference of 120 V/K for LaCoO3 at temperature 460 K, whereas in the metallic phase, 600 K, this difference decreases to the value of 50 V/K. In the present case, differences observed between calculated and experimental values of above 360 K can be due to the various factor, such as relaxation time, spin state transition and temperature independent . In the high temperature region, the relaxation time changes due to the various scattering mechanism.46,47 Therefore, corrections in the relaxation time due to the different scattering mechanism is required. In this compound, the spin state transitions from low-spin to high-spin states are also reported in the temperature region 300-600 K.25,48 In present case, we have performed the theoretical calculations for low spin configuration only. Hence, electronic structures calculations for different spin states in accordance to the temperature range may improve the data. Here to make the comparison between calculated and experimental data, we have shown vs T plot for a fixed . But, the for an intrinsic semiconductor is temperature dependent.44 Therefore, for temperature dependent transport properties one should consider the temperature dependent correction in the also. In high temperature region, consideration of these three factors may lead to the better matching between calculated and experimental data. To established this conjecture careful study in this directions is needed, which is beyond the scope of the present work.

In order to see the potential capabilities of the LaCoO3 compound to be used for TE applications, we have also calculated the power factor (PF). Fig. 6 shows the variations in PF, 2/, with at different temperatures.
For each curve plotted at different temperatures, the value of PF have maximum for both positive and negative value of . The positive and negative value of represents the electrons and holes type doping, respectively. The dotted line at equal to zero eV represents the middle of the energy band gap. The value of PF maximum for negative is found to be 1910-14 W cm-1 K-2 s-1 at -467 meV for 300 K. As the temperature increases from 300 to 1100 K, the values of corresponds to maximum value of PF shifted from -467 meV to -386 meV, and the value of PF maximum at 1100 K is 47 10-14 W cm-1 K-2 s-1. For the positive , the maximum value for 300 K temperature curve is found at 307 meV, and it shifted towards higher value of as the temperature increases from 300 K to 1100 K. The maximum values of PF for 300 and 1100 K temperature curve are 1610-14 and 6010-14 W cm-1 K-2 s-1, obtained at the positive of 307 and 328 meV, respectively. The calculated values of PF suggests that an appropriate amount of n-type doping can increase the value of PF and hence the TE behavior of this compound can be enhanced.
We have also estimated the values of ZT for the n-type doped LaCoO3 compound by using the maximum values of PF corresponds to positive (shown in Fig. 6) and thermal conductivity data of compound reported by Pillai et. al.49 Here, the value of relaxation time () is taken equal to 10-14 s. The values of ZT have been estimated in the temperature range 300-1100 K at the temperature interval of 100 K. The values used for calculation are obtained from the interpolation of . Temperature dependent ZT of LaCoO3 is shown in the Fig. 7.

The value of ZT at 300 K is 0.21 and it increases to 0.35 at 600 K. Further increase in the temperature above 600 K, ZT becomes almost constant upto 1100 K. The value of ZT suggests that with suitable n-type doping, LaCoO3 compound can be used as a better TE material in high temperature region. The value of ZT for n-type doped LaCoO3 in the temperature range 600-1100 K is similar to the other oxides, such as La/Nb doped SrTiO3, Ge doped In2O3, Nb doped CaMnO3, Ga doped Ca3Co4O9.12 At this point, it is important to notice that the values of ZT are calculated by taking values for the poly-crystalline sample.49 By nano-structuring there are possibilities of reducing the values.50-53 Thus, ZT of the n-type doped LaCoO3 can be further enhanced.
IV Conclusions
In conclusion, we have studied the temperature dependent thermopower of LaCoO3 compound in the temperature range 300-600 K. The values of for the compound at 300 and 600 K are found to be 635 and 46 V/K, respectively. For the temperature range 300-540 K, the temperature variations in the is non-linear and the change of 576 V/K is observed. In the 540-600 K, the change in the is 13 V/K and the temperature dependent variations is almost linear. The linear variations of in the 540-600 K temperature range is due to insulator-to-metal transitions at 540 K. To understand the large and positive values of shown by the LaCoO3, we have also carried out the electronic structure and transport coefficients calculations by using the ab-initio density functional theory and BoltZtraP Transport calculations, respectively. The estimated energy gap for U = 2.75 eV is equal to 0.5 eV, which is in accordance to the experimentally reported energy band gap. The flat energy curve observed in the band structure gives 8 times larger effective mass of electrons in conduction band than the effective mass of holes in valence band. The large effective mass of electron plays an important role in understanding the large and positive Seebeck coefficient exhibited by this compound. Further we have calculated the power factor, which suggests that the n-type doping is more appropriate to enhance the TE behavior. We have also estimated the ZT values for n-type doped LaCoO3. The obtained value of ZT shows that, the compound can be used as a good TE material in the high temperature region 600-1100 K. Further, by nano-structuring one can reduce the thermal conductivity in high temperature region. Hence, LaCoO3 compound can be a potential TE material for high temperature TE applications.
References
- (1) F. J. DiSalvo, Thermoelectric Cooling and Power Generations, Science 285 (1999), pp. 703-706.
- (2) L. E. Bell, Cooling, Heating, Generating Power, and Recovering Waste Heat with Thermoelectric Systems, Science 321 (2008), pp. 1457-1461.
- (3) G. Jeffrey Snyder, and E.S. Toberer, Complex thermoelectric materials, Nat. Mater. 1 (2008), pp. 105-114.
- (4) T. M. Tritt, Semiconductors and Semimetals: Recent Trends in Thermoelectric Materials Research I II (San Diego: Academic, 2001).
- (5) S. B. Riffat and Ma Xiaoli, Thermoelectrics: a review of present and potential applications, Applied Thermal Engineering 18 (1998), pp. 1159–1169.
- (6) D. M. Rowe, Thermoelectric Handbook: Micro to Nano (Boca Raton: CRC Press, Taylor Francis Group, 2006).
- (7) C. Han, Z. Li, and S. Dou, Recent progress in thermoelectric materials, Chinese Science Bulletin 59(18) (2014), pp. 2073-2091.
- (8) J. W. Fergus, Oxide materials for high temperature thermoelectric energy conversion, J. Eur. Ceram. Soc. 32 (2012), pp. 525-540.
- (9) S. Walia, B. Sivacarendran, N. Hussein, Z. Serge, R. Gary, H. W. Qing, B. Madhu, S. Sharath, S.S. Michael, and K. Z. Kourosh, Transition metal oxides - Thermoelectric properties, Prog. Mater. Sci. 58 (2013), pp. 1443-1489.
- (10) M. Ohtaki, Recent aspects of oxide thermoelectric materials for power generation from mid-to-high temperature heat source, J. Ceram. Soc. Japan 119[11] (2011), pp. 770-775.
- (11) I. Terasaki, Y. Sasago, and K. Uchinokura, Large thermoelectric power in NaCo2O4 single crystals, Phys. Rev. B 56 (1997), pp. R12685-87.
- (12) J. He, Y. Liu, and R. Funahashi, Oxide thermoelectrics: The challenges, progress, and outlook, J. Mater. Res. 26 (2011), pp. 1762-1772.
- (13) K. Koumoto, Y. Wang, R. Zhang, A. Kosuga, and R. Funahashi, Oxide Thermoelectric Materials: A Nanostructuring Approach, Annu. Rev. Mater. Res. 40 (2010), pp. 363-394.
- (14) K. Koumoto, I. Terasaki, and R. Funahashi, Complex Oxide Materials for Potential Thermoelectric Applications, MRS Bull. 31 (2006), pp. 206-210.
- (15) I. Terasaki, High-temperature oxide thermoelectrics, J. Appl Phys 110 (2011), pp. 053705.
- (16) S. Misture and D. Edwards, High-temperature oxide thermoelectrics, Am Ceram. Soc. Bull. 91 (2012), pp. 27-27.
- (17) Y. Pei, X. Shi, A. LaLonde, H. Wang, L. Chen, and G.J. Snyder, Convergence of electronic bands for high performance bulk thermoelectrics, Nature 473 (2011), pp. 66-69.
- (18) A. D. LaLonde, Y. Pei, H. Wang, and G. J. Snyder, Lead telluride alloy thermoelectrics, Mater. Today 14 (2011), pp. 526-532.
- (19) G. S. Nolas, J. Sharp, and H.J. Goldsmid, Thermoelectrics, Basic Principles and New Materials Developments (Berlin: Springer, 2001).
- (20) K. Gaurav and S. K. Pandey, arXiv:1603.01757.
- (21) J. B. Goodenough, Metallic oxides. In Progress in Solid State Chemistry, vol. 5, ed. H. Reiss. Pergamon, Oxford, 1971, pp. 145-399.
- (22) C.N.R. Rao and J. Gopalakrishnan, New Direction in Solid State Chemistry,2nd ed. Cambridge University Press, Cambridge, 1997.
- (23) I. Terasaki, Research Update: Oxide thermoelectrics: Beyond the conventional design rules, APL Mater. 4 (2016), pp. 104501-7.
- (24) A. Maignan, S. Hebert, L. Pi, D. Pelloquin, C. Martin, C. Michel, M. Hervieu, and B. Raveau, Perovskite manganites and layered cobaltites: potential materials for thermoelectric applications, Cryst. Eng. 5 (2002), pp. 365-382.
- (25) M. A. Senaris Rodriguez and J. B. Goodenough, LaCoO3 revisited, J. Solid State Chem. 116 (1995), pp. 224-231.
- (26) A. Maignan, D. Flahaut, and S. Hebert, Sign change of the thermoelectric power in LaCoO3, Eur. Phys. J. B 39 (2004), pp. 145-148.
- (27) Z. Jirák, J. Hejtmánek, K. Knížek, and M. Veverka, Electrical resistivity and thermopower measurements of the hole- and electron-doped cobaltites LnCoO3, Phys. Rev B 78 (2008), pp. 014432.
- (28) P. Mandal, P. Choudhury, S. K. Biswas, and B. Ghosh, Transport and magnetic properties of La1−xBaxCoO3, Phys. Rev B 70 (2004), pp. 104407.
- (29) S. K. Pandey, A. Kumar, S. Patil, V. R. R. Medicherla, R. S. Singh, K. Maiti, D. Prabhakaran, A. T. Boothroyd, and A. V. Pimpale, Investigation of the spin state of Co in LaCoO 3 at room temperature: Ab initio calculations and high-resolution photoemission spectroscopy of single crystals, Phys. Rev B 77 (2008), pp. 045123.
- (30) S. Hebert, D. Flahaut, C. Martin, S. Lemonnier, J. Noudem, C. Goupil, A. Maignan, J. Hejtmanek, Thermoelectric properties of perovskites: Sign change of the Seebeck coefficient and high temperature properties, Prog. Sol. State Chem. 35 (2007), pp. 457-467.
- (31) M. Abbate, J. C. Fuggle, A. Fujimori, L. H. Tjeng, C. T. Chen, R. Potze, G. A. Sawatzky, H. Eisaki, S. Uchida, Electronic structure and spin-state transition of LaCoO3, Phys. Rev B 47 (1993), pp. 16121-16130.
- (32) M. A. Korotin, S. Yu. Ezhov, I. V. Solovyev, V. I. Anisimov D. I. Khomskii, and G. A. Sawatzky, Intermediate-spin state and properties of LaCoO3, Phys. Rev B 54 (1996), pp. 5309-5316.
- (33) P. Ravindran, P. A. Korzhavyi, H. Fjellvag, and A. Kjekshus, Electronic structure, phase stability, and magnetic properties of La1-xSrxCoO3 from first-principles full-potential calculations, Phys. Rev B 60 (1999), pp. 16423-16434.
- (34) A. Chainani, M. Mathew, and D.D. Sharma, Electron-spectroscopy study of the semiconductor-metal transition in La1-xSrxCoO3, Phys. Rev. B 46 (1992), pp. 9976-9983.
- (35) T. Arima, Y. Tokura, and J. B. Torrance, Variation of optical gaps in perovskite-type 3d transition-metal oxides, Phys. Rev B 48 (1993), pp. 17006-17009.
- (36) S. K. Pandey, R. Bindu, Pramod Bhatt, S.M. Chaudhari, and A.V. Pimpale, Synthesis and investigation of structural and electronic properties of Pr1-xCaxFeO3 (0x0.2) compounds, Physica B 365 (2005), pp. 47-54.
- (37) S. Singh and S. K. Pandey, arXiv:1508.04739
- (38) P. Blaha, K. Schwarz, G. K. H. Madsen, D. Kvasnicka and J. Luitz, WIEN2k An Augmented Plane Wave plus Local Orbitals Program for Calculating Crystal Properties (Karlheinz Schwarz Technische Universit at Wien, Austria) 2001, ISBN 3-9501031-1-2.
- (39) G.K.H. Madsen and D. J. Singh, BoltzTraP. A code for calculating band-structure dependent quantities, Comput. Phys. Commun. 175 (2006), pp. 67-71.
- (40) J. P. Perdew and Y. Wang, Accurate and simple analytic representation of the electron-gas correlation energy, Phys. Rev. B 45 (1992), pp. 13244-13249.
- (41) P. G. Radaelli and S. W. Cheong, Structural phenomena associated with the spin-state transition in LaCoO3, Phys. Rev. B 66 (2002), pp. 094408.
- (42) R. R. Heikes, R. C. Miller, and R. Mazelsky, Magnetic and electrical anomalies in LaCoO3, Physica 30 (1964), pp. 1600-1608.
- (43) Bilbao Crystallographic Server http://www.cryst.ehu.es
- (44) N.W. Ashcroft, N.D. Mermin, in: D.G. Crane (Ed.), Solid State Physics vol. 239, Saunders College Publishing, New York, 1976.
- (45) S. Singh, R. K. Maurya, and S. K. Pandey, Investigation of thermoelectric properties of ZnV2O4 compound at high temperatures, J. Phys. D: Appl. Phys. 49 (2016), pp. 425601.
- (46) K. Durczewski and M. Ausloos, Nontrivial behavior of the thermoelectric power: Electron-electron versus electron-phonon scattering, Phys. Rev. B 61 (2000), pp. 5303-5310.
- (47) S. Ahmad and S. D. Mahanti, Energy and temperature dependence of relaxation time and Wiedemann-Franz law on PbTe, Phys. Rev. B 81 (2010), pp. 165203.
- (48) P. M. Raccah and J. B. Goodenough, First-Order Localized-Electron Collective-Electron Transition in LaCoO3, Phys. Rev. 155 (1967), pp. 932-942.
- (49) C. G. S. Pillai and A. M. George, Thermal Conductivity of LaCoO3, Inter. J. of Therm. 4 (1983), pp. 183-188.
- (50) Tritt TM, Thermoelectric Phenomena, Materials, and Applications, Ann. Rev. Mater. Res. 41 (2011), pp. 433-448.
- (51) Tritt TM, Thermal conductivity: theory, properties, and applications. Springer; 2005.
- (52) Jing Feng Li, Jian-Hui Li and Fang-Zhou Yao, The effect of Cu substitution on microstructure and thermoelectric properties of LaCoO3 ceramics, Phys. Chem. Chem. Phys. 14 (2012), pp. 12213-12220.