Detection of tau neutrinos by Imaging Air Cherenkov Telescopes
Abstract
This paper investigates the potential to detect tau neutrinos in the energy range of 1-1000 PeV searching for very inclined showers with imaging Cherenkov telescopes. A neutrino induced tau lepton escaping from the Earth may decay and initiate an air shower which can be detected by a fluorescence or Cherenkov telescope. We present here a study of the detection potential of Earth-skimming neutrinos taking into account neutrino interactions in the Earth crust, local matter distributions at various detector sites, the development of tau-induced showers in air and the detection of Cherenkov photons with IACTs. We analyzed simulated shower images on the camera focal plane and implemented generic reconstruction chains based on Hillas parameters. We find that present IACTs can distinguish air showers induced by tau neutrinos from the background of hadronic showers in the PeV-EeV energy range. We present the neutrino trigger efficiency obtained for a few configurations being considered for the next-generation Cherenkov telescopes, i.e. the Cherenkov Telescope Array. Finally, for a few representative neutrino spectra expected from astrophysical sources, we compare the expected event rates at running IACTs to what is expected for the dedicated IceCube neutrino telescope.
1 Introduction
The discovery of an astrophysical flux of high-energy neutrinos by IceCube [1] is a major step forward in the ongoing search for the origin of cosmic rays, since the neutrino emission may be produced by hadronic interactions in astrophysical accelerators. Of particular interest is the identification of , which are only expected to be produced in negligible amounts in astrophysical accelerators, but should appear in the flux detected by IceCube due to neutrino flavor change. Up to now, there has been no clear identification of at high energies, so the detection of neutrinos will be very important from astrophysical and the particle physics point of view. The detection would give new information about the astrophysical flux as well as serving as an additional confirmation of the astrophysical origin of the IceCube high energy diffuse neutrino signal. It also would shed light on the emission mechanisms at the source, test the fundamental properties of neutrinos over extremely long baselines and better constrain new physics models which predict significant deviations from equal fractions of all flavors.
The existing Imaging Air Cherenkov Telescopes (IACTs) such as MAGIC [2], VERITAS [3] and H.E.S.S. [4] could have the capability to detect PeV tau neutrinos by searching for very inclined showers [5]. In order to do that, the Cherenkov telescopes need to be pointed in the direction of the taus escaping from the Earth crust, i.e. at or a few degrees below the horizon. In [6], the effective area for up-going tau neutrino observations with the MAGIC telescopes was calculated analytically and found to be maximum in the range from 100 TeV to 1 EeV. However, the sensitivity for diffuse neutrinos was found to be very low because of the limited field of view (FOV) (the topographic conditions allow to point the telescopes only for a small window of about 1 degree width in zenith and azimuth to point the telescope downhill), the observation time and the low expected neutrino flux.
On the other hand, if flaring or disrupting point sources such as GRBs are being pointed to, one can expect an observable number of events even from a single GRB if close by, as recently shown by the All-sky Survey High Resolution Air-shower (Ashra) team [7]. Also, for IACT sites with different topographic conditions, the acceptance for up-going tau neutrinos is increased by the presence of mountains [9], which serve as target for neutrino interaction leading to an enhancement in the flux of emerging tau leptons. A target mountain can also shield against cosmic rays and star light. Nights with high clouds often prevent the observation of -ray sources, but still allow pointing the telescopes to the horizon. As an example for the MAGIC site there are about 100 hours per year where high clouds are present [8], therefore a large amount of data can be possibly accumulated. While the observation of tau neutrinos is not the primary goal of IACTs, a certain level of complementarity can be expected when switching from normal (i.e. -ray) observations mode to tau neutrinos (i.e. mostly horizontal) pointing. Next-generation Cherenkov telescopes, i.e. the Cherenkov Telescope Array (CTA) [10], can in addition exploit their much larger FOV (in extended observation mode) and a higher effective area.
In this paper, we present an update of the work in [9], where a detailed Monte Carlo (MC) simulation of event rates induced by Earth skimming tau neutrinos was performed for an ideal Cherenkov detector in case of MAGIC, VERITAS site and two proposed Cherenkov Telescope Array sites: Meteor Crater and Yavapai Ranch. For VERITAS and the considered Cherenkov Telescope Array sites the expected neutrino sensitivities are up to factor 3 higher than for the MAGIC site because of the presence of surrounding mountains. The calculated neutrino rates are comparable to what has been estimated for the IceCube neutrino telescope assuming realistic observation times for Cherenkov telescopes of a few hours.
However, in our previous work the calculated event rate were obtained with an assumed efficiency for tau induced shower of about 10%. Here, we present a more detailed simulation of trigger and identification efficiency for air showers induced by Earth-skimming tau neutrinos, for IACTs and for a few CTA layouts considered in [17]. We analyzed the simulated shower images on the camera focal plane showing that IACTs/CTA can distinguish air showers induced by tau neutrinos from the background of very inclined hadronic showers. We also recalculated the point source acceptance and the expected event rate taking into account this new estimation of the trigger efficiency.
The structure of the paper is the following: Section 2 describes our MC simulation chain. In Section 3 we show the trigger/identification efficiencies for induced showers as a function of tau lepton energy and we study the properties of shower images on the camera focal plane, as described by Hillas parameters. This section presents also an update of our previous work [9]. Finally, we summarize the results and give a conclusion in Section 4.
2 Method
In order to study the signatures expected from neutrino-induced showers by IACTs, a full Monte Carlo (MC) simulation chain was set, which consists of three steps.
First, the propagation of a given neutrino flux through the Earth and the atmosphere is simulated using an extended version of the ANIS code [11]. For fixed neutrino energies, events are generated on top of the atmosphere with zenith angles () in the range – (up-going showers) and with azimuth angles in the range –. Neutrinos are propagated along their trajectories of length from the generation point on top of the atmosphere to the interaction volume, defined as the volume which can contribute to the expected event rate, in steps of /1000 ( km). At each step of propagation, the –nucleon interaction probability is calculated according to a parametrization of its cross section based on the chosen parton distribution function (PDF). In particular, the propagation of tau leptons through the Earth is simulated. All computations are done using digital elevation maps (DEM) [23] to model the surrounding mass distribution of each site under consideration. The flux of the leptons emerging from the ground as well as their energy and the decay vertex positions are calculated inside an interaction volume, modeled by a cylinder with radius of 35 km and height 10 km, see also [11, 9] for more details.
Then, the shower development of -induced showers and Cherenkov light production from such showers is simulated with CORSIKA [12]. CORSIKA (version 6.99) was compiled with the TAULEP option [13], such that the tau decay is simulated with PYTHIA [14]. In order to simulate Cherenkov light from inclined showers for any defined Cherenkov telescopes array the CERENKOV and IACT options were also activated [16]. Finally, to consider the atmospheric depth correctly for inclined showers, the CURVED EARTH and SLANT options were also selected. Up to now, we could not simulate showers with zenith angle when combining the ”CURVED EARTH” and IACT options. Therefore, we use here a zenith angle of to estimate the trigger efficiency for up-going tau neutrino showers. This should be a reasonable assumption, because the trigger efficiency in case of -induced showers with the same energy should only slightly depend on the zenith angle (as its confirmed by our later results), as long as the corresponding altitudes of shower maxima are similar.
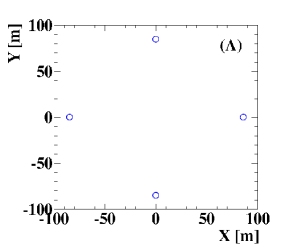
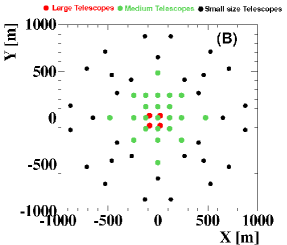
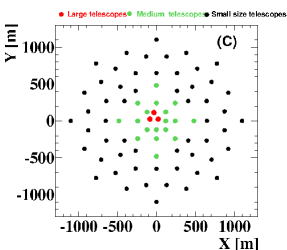
The CORSIKA simulations were performed for different configurations: H.E.S.S. like four telescopes (named here by IACT-4), and for a few CTA arrays considered in [17], see Figure 1. The IACT-4 can be considered as representative for current generation of IACTs. Among different CTA array configurations shown in [17] the arrays chosen were named CTA-E (59 telescopes) and CTE-I (72 telescopes), which according to [17] are the best compromise between compact and dense layout. The selected arrays have only slightly worse sensitivity for -rays than the full CTA array [17].
We simulated showers induced by tau leptons with energies from 1 - 1000 PeV in steps of 0.33 decades and with an injection position at altitudes ranging from detector level to the top of the atmosphere. We used as the detector level 1800 a.s.l for the simulation of current generation of IACTs and 2000 m a.s.l. for CTA. The injection point spans different vertical depths from ground to top of the atmosphere with steps of at least 50 g/cm2. At each vertical depth, 1000 showers were generated in order to study shower-to-shower fluctuations and to cover different tau decay channels.
For each CORSIKA simulated shower the impact point was randomized in a circle with radius on a plane perpendicular to the shower axis i.e. the CSCAT with VOLUMEDET/IACT option was used. This radius was optimized by looking to the fraction of triggered events as a function of , and finally was set to m for IACT-4 and m for CTA-E in order to avoid information loss due to showers which could be triggered but were not simulated.
For high energies ( PeV) the computing time become excessively long (scaling roughly with the primary energy). In order to reduce it to tolerable values the so-called ”thin sampling” mechanism is used [15]. To cope with the vast number of secondary particles thinning and re-weighting of secondaries was used with a thinning level of 10-6 . The kinetic energy thresholds for explicit tracked particles were set to: 300, 100, 1, 1 MeV for hadrons, muons, electrons and photons, respectively. Shower simulations were performed considering the QGSJET II model for hadronic interactions in the atmosphere.
The results of CORSIKA simulations were used as the input for the last step i.e. simulation of the detector response. We used the Cherenkov telescope simulation package: sim_telarray [16]. The light collection area is simulated including the ray-tracing of the optical system, the measured transmittance and the quantum efficiency of PMTs. The response of the camera electronics was simulated in detail including night-sky background and different system triggers. The sim_telarray simulations were performed for IACT-4, and for CTA-E and CTA-I with so-called production-1 settings. The response to -induced showers is found to depend weakly on the details of the optical set-up, field of view and camera electronics.
In order to compare images at the camera plane we also simulated inclined showers induced by protons, photons and electrons. At energies larger than 1 PeV, we do not expect significant background of showers initiated by photons or electrons. The proton simulations were instead used to estimate the main isotropic background for neutrino searches due to interaction of comics rays in the atmosphere. In order to have enough statistic we use a similar strategy to the case of induced shower i.e. we simulated proton induced showers with primary particle energy ranging from 1 to 1000 PeV in steps of 0.33 decades. At each considered zenith angle bins (80∘, 83∘, 85∘, 87∘) the number of simulated events in CORSIKA input card was set to the corresponding number of events from the power law spectrum with spectral index . The direction of primary protons was varied within a circle with aperture around the fixed primary direction, i.e. the VIEWCONE option was selected in the CORSIKA simulations.
3 Results
3.1 Image on the camera
In case of showers observed at large zenith angles the Cherenkov light has to undergo a long optical path, due to a thicker layer of the atmosphere. The shower maximum is located far from the observatory and the photon density at the mirrors decreases. This reduces the efficiency compared to lower zenith angles, especially at low energies. Images on the camera will be dimmer and smaller in size.
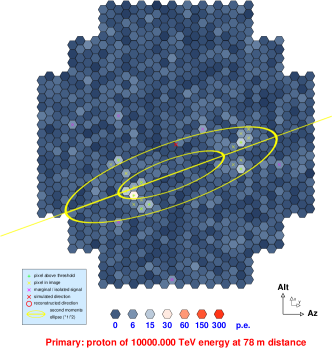
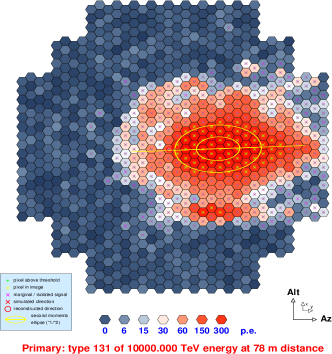
As an example, in Figure 2 we show a representative shower image for a 10 PeV proton injected at the top of the atmosphere and a 10 PeV tau lepton injected close to the detector, respectively. As expected, the shower image on the focal camera plane for the tau lepton has a much larger image size and contains much more photons compared to the proton one. Note also, that for inclined showers the hadronic and electro-magnetic component is almost completely absorbed in the atmosphere while the muonic component (muons) can reach the Earth. Thus, the showers images on the cameras from -induced showers will mostly contain the muon ring (if muons propagate parallel to the optical axis) or incomplete ring (arcs) in the camera, see Figure 2 (Left) as an example.
3.2 Trigger efficiency
The trigger efficiency (trigger probability) depends on the response of a given detector and is usually estimated based on MC simulations. The trigger efficiency, in an energy range interval , is defined as the number of simulated showers with positive trigger decision over the total number of generated showers for fixed zenith angle , initial energy of primary particle and injection depth . In this work, simulations were done for a two level trigger, so-called Majority trigger. The first level is a camera level trigger (L1) defined by 3 pixels above 4 photo-electrons (p.e.) within a short time window and the second level is basically a coincidence level trigger among all telescopes in the defined array or sub-array (L2) and requires at least 2 neighboring triggered telescopes.
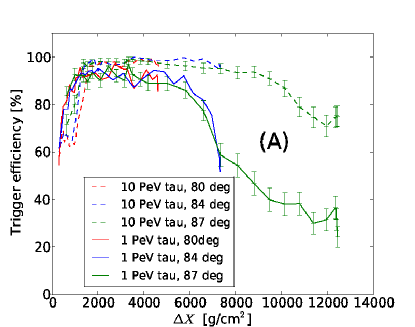
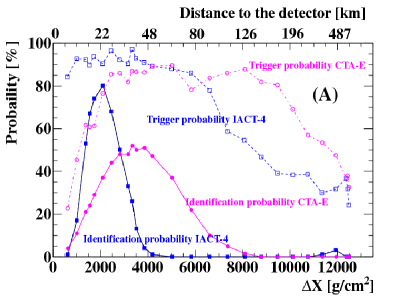
Figure 3 (A) shows the trigger probability (L2) for -induced showers with different zenith angles and energies of the tau lepton in case of the IACT-4 array. The calculated trigger probabilities for different zenith angles are quite similar, within errors, if plotted as a function of the distance between the injection point and the detector measured in g/cm2 (in this work this distance to the detector was labeled as ). This is understood, if we note that amount of Cherenkov light detected depends essentially on the distance between the Cherenkov telescope and the shower maximum. At its maximum a shower has the largest lateral extension and Cherenkov light production, thus is capable of producing the largest signal seen by IACTs telescopes.
As expected (see Figure 3 (A)) the trigger probability increases with primary energy of the tau lepton and decreasing distance to the detector. Only, at g/cm2, the trigger efficiency drops due to the fact that the shower maximum is too close to the detector or the shower did not reach yet the maximum of shower development, decreasing the amount of Cherenkov light seen by telescopes. It is also worth to mention, that below g/cm2 the trigger probability is at the level of about 90%. In this case the corresponding geometrical distance to the detector (in meters) depends on the zenith angle , but for is of about km. This provides an estimate of the size of the active volume for -induced showers seen by IACTs.
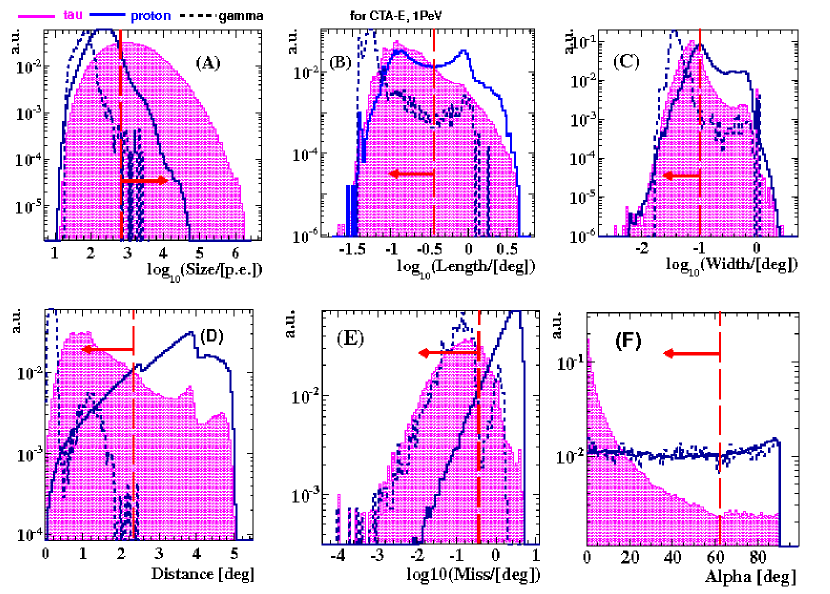
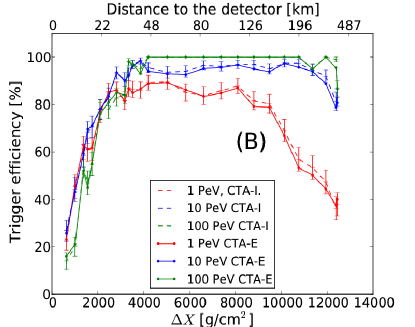
Figure 3 (B) shows the trigger probability for the considered CTA arrays shown in Figure 1 (B) and (C) and different primary energy of lepton tau. As for IACT-4, the trigger probability increases because the higher is the energy, the more Cherenkov light is produced, and the larger the number of triggered events. Comparing with results from Figure 3 (A) calculated for larger CTA arrays, with more telescopes with different optics and camera structures, we find basically a similar fraction of triggered events (above g/cm2). The difference in the trigger probability seen for g/cm2 between IACT-4 and CTA-E it is due to the different altitudes of detectors i.e. a higher altitude for CTA-E. The altitude difference is only 200 m, but for zenith angle it translates into a difference of about 4 km in the detector to shower distance. In case of IACT-4 this leads to a larger fraction of triggered showers than for CTA-E, because more showers can reach their maximum of shower development. Moreover, for the considered CTA arrays, the trigger efficiency only slightly depend on the array structure. This can be explained by the fact, that for inclined showers studied in this work (with ) the radius of the Cherenkov light pool distribution at detector level is larger than 1 km 111For index of refraction at an altitude of 1800 m, the Cherenkov opening angle is . Thus, for geometrical distance from the shower maximum to detector of about 50 km the Cherenkov ring radius on the ground, assuming not changes of refraction index within this distance, is given by: 50 km =1.04 km/) km for fixed zenith angle ., which is much more than the distance between telescopes in the considered arrays. Thus, the fraction of triggered events is expected to be similar and to be only weakly dependent on the density of telescopes.
3.3 Discrimination of induced showers
In this section we show how to discriminate of induced showers from background hadronic showers. The results presented here are based on simulation of down-going showers with zenith angle , but they can be applied to any neutrino flavour, since all neutrinos with different flavours can induced down-going air showers, which produce a large amount of Cherenkov light at high energies ( PeV). We already show in Figure 3 (A) that the trigger probability does not depend on zenith angle for inclined showers, thus it can be used for down-going neutrino searches, as well. Of course, in such a case the neutrino sensitivity is reduced due to small target density for neutrino interaction (happening in the atmosphere), compared to the sensitivity obtained for Earth-skimming neutrinos.
Each simulated event recorded and calibrated consists of a number of photoelectrons collected by each pixel in the camera while the trigger gate is opened. The standard trigger configuration requires at least three connected pixels with a signal above the discriminator threshold. However, most of the camera pixels collect light not from the Cherenkov shower but from background. To eliminate the background contribution an image cleaning is performed [16]. The resulting cleaned shower image contains only the pixels considered to have physical information on the shower development. The cleaned camera image is characterized by a set of image parameters introduced by M. Hillas in [18]. These parameters provide a geometrical description of the images of showers and are used to infer the energy of the primary particle, its arrival direction and to distinguish between ray showers and hadronic showers. It is interesting to study these parameters also in the case of deep -induced showers.
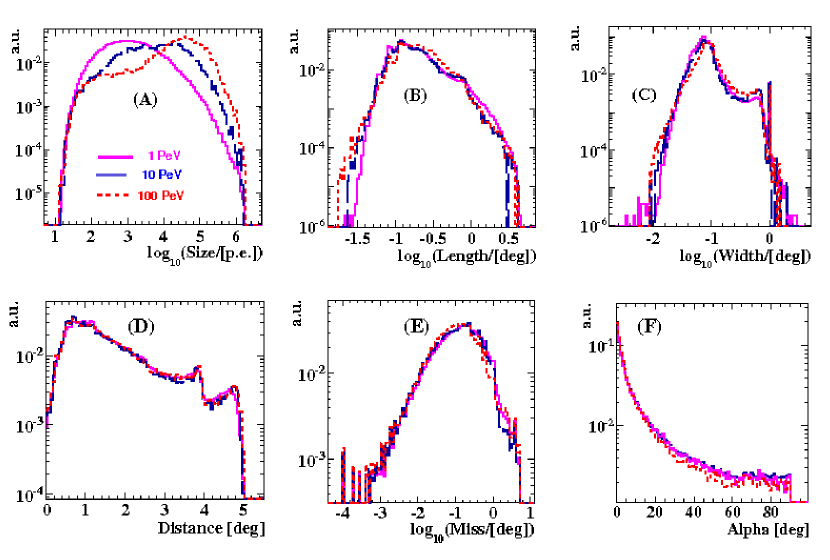
In Figure 4 the distribution of Hillas parameters for deep -induced showers are shown, in comparison to the one obtained for and induced showers. In general, these parameters depend on the geometrical distance of the shower maximum to the detector, which for deep -induced showers is much smaller than for inclined and -induced showers which develop at the top of the atmosphere. For example, at this distance is about a few hundred kilometers for particles interacting at the top of the atmosphere and only a few tens kilometers for deep -induced showers. This geometrical effect leads to a rather good separation of close (-induced) and far-away (, ) events in the Hillas parameter phase space. This is evident in the -parameter, see Figure 4 (A). This parameter measures the total amount of detected light (in p.e.) in all camera pixels, and it is correlated with the primary energy of the shower. The size distribution for -induced showers is shifted to larger values compared to and induced events, due to closer distances to the detector.
The difference is also seen for parameters characterizing the longitudinal and lateral shower development like Length and Width, Figure 4 (B) and (C). For showers induced by hadron (proton) the image on the camera is more irregular and is typically larger compared to showers induced by photons. Thus, the average value of Length and Width for photons is expected to be smaller than for protons. At larger inclinations, the so-called the /hadron separation is weaker since images become smaller in size. However, still the difference between and induced showers is well visible in our simulations.222The peak in the Length distribution around comes from single muons, which create a ring/arc in the camera and lead to a large value of length from reconstruction. An example of this class of events is shown in Figure 2 (Left). . For induced showers, the maximum of Length and Width distribution lies somewhere between the maximum for and protons. This can be explained by the fact, that the lepton tau decays according to different decay channels [19], and a induced shower is usually a superposition of electromagnetic sub-showers coming from decays of neutral pions and hadronic sub-shower coming from decaying of charged pion. Thus, the shower image in the camera can have different topologies i.e. it can look like events or events.
The angular distance between the center of the shower image and the camera center is called the Distance-parameter. It is correlated with the angle between the shower and the telescope axis, and for larger zenith angles it decreases due to larger detector-to-shower distance. However, this parameter can also increase when the detector-to-shower distance becomes smaller for fixed zenith angles. The effect it well seen in Figure 4 (D) in case of point-like simulations (i.e. when a normal mode of CORSIKA simulations without VIEWCONE option was used), when the ellipse center of the shower image for deep -induced showers compared to -induced showers moves away from the camera center. For the proton simulations, when the direction of primary protons within 5∘ around 87∘ was varied, the distribution is shifted to higher values of distance parameter. Three peaks seen at Distance distributions, as for example at 2.5∘, 4∘ and 5∘ for -induced showers, are due to structures of CTA-E array, which consists of three different telescopes types with different FOV.
Another Hillas parameter, which describes the orientation of the shower image on the camera according to its center is Miss-parameter. As we can see in Figure 4 (E) the distribution for -events is shifted to lower values compared to events, showing that this observable has also a strong separation power from the background of hadronic events.
Figure 4(F) shows the distribution of Alpha for deep , and induced showers. Alpha is the angle between the major axis of the ellipse and the direction from the image Center of Gravity to the center of camera. This parameter has the highest /hadron separation power (for single IACT observation data), since -ray induced images point to the position of the source in the camera, thus they are characterized by a small value of Alpha. On the contrary, hadronic showers are distributed isotropically in the sky implying a rather flat Alpha distribution. However, at large zenith angles -induced images have a rather circular shape 333 For -induced shower at large zenith angle, the Cherenkov light due a long optical path trigger only a few pixels, thus the shape of the image is less well determined in terms of Hillas parameters. In order to see the elliptical structure of typical -induced showers we need camera with a pixel size much smaller than what proposed right now for CTA (i.e. between and ). rather than an elongated elliptical one implying that the Alpha-parameter is less well determined. At zenith angles the distribution is quite flat and becomes similar to the distribution for events. For deep -induced showers the distribution peaks at small values of Alpha, showing a strong separation power from the background of hadronic events.
, and only slightly depend on the primary particle energy (as it is shown in Figure 5 (D-F) and the shower zenith angle (in the range above )). However, as expected, for energy dependent parameters like: we observe the expected shift to higher values for higher primary particle energies. It is also worth to mention, that the largest differences between deep -induced showers and and -induced showers are observed for the , and parameter. Such observables can be used to distinguish deep -induced showers from the background of inclined hadronic showers.
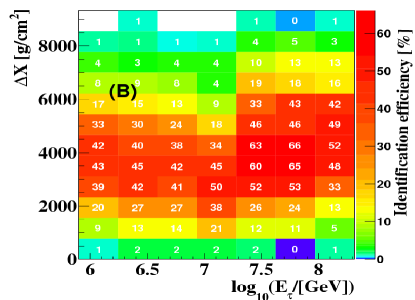
In order to evaluate the best set of cuts to identify deep -induced neutrino showers, we used the program GARCON [20], returning the cuts yielding the maximal signal efficiency with minimal background contamination. We considered a six parameter phase space . For signal we considered deep induced showers (with g/cm2 i.e. km from the detector and ). As a source of background we considered showers, initiated by primary protons with energies between 1 PeV and 1000 PeV with a differential spectral index of , and interacting at the top of the atmosphere, with g/cm-2 and zenith angle 444For zenith angles: , and , the Hillas distributions looks similar, except the distribution for which we observed a small shift of maximum to higher values, when the zenith angles decreases.. The set of optimized cuts retaining most signal and zero left protons are listed in Table 1 for IACT-4 and CTA-E.
| array | E | Signal Efficiency | ||||||
|---|---|---|---|---|---|---|---|---|
| type | [PeV] | [p.e.] | [deg] | [deg] | [deg] | [deg] | [deg] | [%] |
| IACT-4 | 1 | 2010 | 1.81 | 0.17 | 0.91 | 0.15 | 51 | 31 |
| CTA-E | 791 | 0.35 | 0.10 | 2.34 | 0.35 | 62 | 32 | |
| IACT-4 | 10 | 11500 | 0.52 | 0.47 | 1.09 | 0.27 | 90 | 33 |
| CTA-E | 2590 | 0.39 | 0.20 | 3.47 | 0.66 | 19 | 27 | |
| IACT-4 | 100 | 43100 | 0.71 | 0.72 | 2.26 | 0.131 | 17 | 30 |
| CTA-E | 8700 | 0.39 | 0.30 | 3.47 | 0.66 | 19 | 27 |
The selection cuts presented in Table 1 (and also in Figure 4) demonstrate that background events triggering the IACT/CTA telescopes when pointing below (or close to) the horizon can be distinguished from MC neutrino signatures. This criterion gives a possibility to identify tau neutrinos from the background of hadronic showers and can be used to calculate the identification efficiency for -induced showers.
In Figure 6 (A) the influence of cuts on the trigger probability is shown, while Figure 6 (B) gives the identification efficiency as a function of the primary energy of the tau lepton. At vertical depths smaller than g/cm2, we have lower values of identification efficiency for CTA-E than IACT-4 due to the different altitudes of detectors i.e. a higher altitude for CTA-E of 200 m. However, the CTA-E distribution is extended to higher values of distance to the detector, up to g/cm2.
3.4 Event rate calculations
The total observable rates (number of expected events) were calculated as , where is the neutrino flux, the observation time and the point source acceptance. The acceptance for a point source can be estimated as the ratio between the diffuse acceptance and the solid angle covered by the diffuse analysis, multiplied by the fraction of time the source is visible i.e. is given by: . The fraction of time where source is visible depends on the source declination () and the latitude of the observation site ().
In this work, the detector diffuse acceptance for an initial neutrino energy is calculated from:
| (1) |
where is the number of generated neutrino events. is the number of leptons with energies larger than the threshold energy PeV and a decay vertex position inside the interaction volume555Only tau leptons which decays in the interaction volume are considered, so the tau decay probability is included.. is the probability that a neutrino with energy and zenith angle produces a lepton with energy (this probability was used as ”weight” of the event). is the physical cross-section of the interaction volume seen by the neutrino. is the trigger efficiency for tau-lepton induced showers with the decay vertex position at (, ) and height above the ground.
As we already mentioned, in our previous work [9] we assumed an average trigger efficiency of % in the energy range 1-1000 PeV. However, as seen for example from Figure 6 (A) the average trigger efficiency is significanly larger than 10%, even for 1 PeV tau leptons. For tau leptons interacting below 4000 g/cm2 with energy in the range 1-1000 PeV the average trigger efficiency is about 90%(77%) for IACT-4/(CTA), thus we also expect a larger acceptance and event rates by a factor 9 to 8 compared to what was shown in [9].
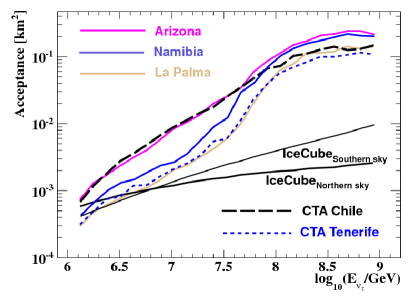
In Figure 7 we show our new estimates for the acceptance to neutrinos for different IACT-4 sites: La Palma (MAGIC), Namibia (H.E.S.S.) and Arizona (VERITAS) and recently chosen locations of CTA for the North: Chile, (Armazones: Latitude S, Longitude W) or Tenerife ( S, W). As expected, the acceptance depends on local topographic conditions with the largest acceptance for Arizona and Chile site 666Due to the lack of results from IceCube in the tau-neutrino channel, we use IceCube’s muon neutrino acceptance [21] for a sensitivity comparison. This is motivated by the fact that at the Earth we expect an equal flavor flux from cosmic neutrino sources due to full mixing [22]. In [24, 25] it is also shown that for neutrino energies between 1 PeV and 1000 PeV, the muon-neutrino acceptance is only slightly larger than that for tau neutrinos..
To calculate the acceptance for up-going -induced showers we used the trigger efficiency instead of the shower identification efficiency, since in the studied angular range () the expected background from protons and photons will be negligible. This is also expected in case of Cherenkov telescopes observations in the direction of mountains, when they are shielded against cosmic rays and star light. However, in some cases like for example for La Palma or Tenerife Cherenkov telescopes can be pointed to the sea. Thus, for high energies ( 1 PeV) we can expect a non zero background component due to the presence of high energetic muons or muons bundles (as for example seen by IceCube [26]) or even gamma showers induced by interacting muons via bremsstrahlung or pair production [27, 28]. If the identification efficiency is used instead of the trigger efficiency, the calculated acceptance for IACT-4/CTA and the expected event rate is of about two/three times lower.
In Table 2 the expected event rates for IACTs, Tenerife and Chile site compared to that of IceCube is shown for fluxes used in our previous work [9]. The rate is calculated for tau neutrinos with zenith angles between 90∘ and 105∘ assuming that the source is in this FOV for a period of 3 hours. The Flux-1 and Flux-2 are predictions for neutrino from -ray flare of 3C 279 [29]. Flux-3 and Flux-4 are predictions for PKS 2155-304 in low-state and high-state, respectively [30]. Flux-5 corresponds to a prediction for 3C 279 calculated in [31], and it is at a similar level in the PeV energy range like the flux reported by IceCube in case of astrophysical high-energies neutrinos [32]. For Flux-3 and Flux-4 (i.e. those models covering the energy range beyond GeV) the event rate is a factor 16 to 30 larger what expected for IceCube in the northern sky assuming three hours of observation. For neutrino fluxes covering the energy range below GeV (Flux-1, Flux-2, Flux-5), the number of expected events for these sites is at least three times larger (La Palma) or seven times larger (Arizona) to what estimated for IceCube.
| Flux-1 | Flux-2 | Flux-3 | Flux-4 | Flux-5 | |
|---|---|---|---|---|---|
| 2.5 | 1.4 | 0.77 | 7.7 | 2.3 | |
| 4.3 | 2.3 | 0.99 | 9.9 | 3.8 | |
| 7.4 | 3.4 | 1.44 | 14.4 | 6.2 | |
| 3.0 | 2.2 | 0.73 | 7.3 | 2.8 | |
| 7.9 | 3.3 | 0.98 | 9.8 | 6.0 | |
| 0.68 | 0.25 | 0.046 | 0.46 | 0.88 | |
| 1.1 | 0.32 | 0.076 | 0.76 | 0.88 |
The influence on the expected event rate arising from uncertainties on the tau-lepton energy loss and different neutrino-nucleon cross-sections was studied in our previous work [9]. The influence of systematic uncertainties on the event rate was estimated to be about +14%/-7% for Flux-1 and +43%/-16% for Flux-3.
4 Summary
In this paper, we present results of MC simulations of -induced air showers for IACTs and for selected CTA arrays. We calculated the trigger and identification efficiencies for -induced showers and study the properties of their images on the camera focal plane, as described by Hillas parameters. In our previous work [9], which assumed a trigger efficiency of 10% we predicted, that the calculated neutrino rates are comparable or even larger (above PeV) to what expected for the IceCube neutrino telescope assuming observation times for Cherenkov telescopes of a few hours. In this work we have carried out more realistic simulations and we predict even larger efficiencies expected for IACTs. In the most favorable case in Table 2, we expect 1 event during 210 hours of observation. Taking into account that for this purpose IACTs have to be pointed below the horizon during moonless nights, the detection of tau neutrinos seems to be difficult. However, such observation time/or even larger can be an accumulated during periods with high clouds, when those instruments are normally not operated. Very often (for example for the La Palma site this is of about 100 hours/year) high clouds prevent the observation of -ray sources, but still allow pointing the telescopes to the horizon. This makes the perspective of detection tau neutrino induced shower by IACT more attractive.
References
- [1] M. G. Aartsen et al. (IceCube Collab.), PRL 113, 101101 (2014) [arxiv1405.5303].
- [2] MAGIC Collaboration: http://http://magic.mppmu.mpg.de/.
- [3] VERITAS Collaboration: http://veritas.sao.arizona.edu/.
- [4] H.E.S.S. Collaboration: http://www.mpi-hd.mpg.de/hfm/HESS/pages/about/telescopes.
- [5] D. Fargion et. al., J. Phys. Conf. Ser. 110 (2008) 062008; Nucl. Instrum. Meth. A588 (2008) 146 [arXiv:0710.3805].
- [6] M. Gaug, C. Hsu, J.K. Becker et al., Proc of 30th I.C.R.C. (Merida) (2007) 1273.
- [7] Y. Asaoka, M. Sasaki, Astropart. Phys. 41 (2013) 7 and M.S. Sasaki et al. [arXiv:1408.6244].
- [8] S. Cavazzani et al., MNRAS 411 (2) (2011) 1271.
- [9] D. Góra et al., Astropart. Phys. 61 (2015) 12.
- [10] B.S. Acharya et al., Astropart. Phys. 43 (2013) 6.
- [11] D. Góra et al., Astropart. Phys. 26 (2007) 402.
- [12] D. Heck, J. Knapp, J.N. Capdevielle, G. Schatz, T. Thouw, Report FZKA 6019 (1998).
- [13] D. Heck, Report FZKA 7366 (2008), Forschungszentrum Karlsruhe; http://wwwik.fzk.de/h̃eck/publications
- [14] T. Sjöstrand, S. Mrenna, and P. Skands JHEP 0605 (2006) 026; http://www.thep.lu.se/torbjorn/pythia.html.
- [15] A.M. Hillas, Nucl. Phys. Proc. Suppl. 52B (1997) 29.
- [16] K. Bernlöhr et al., Astropart. Phys. 20 (2003), 111.
- [17] K. Bernlöhr et al., Astropart. Phys. 43 (2013), 171.
- [18] A.M. Hillas, Proc. of 19nd I.C.R.C. (La Jolla), 3 (1985) 445.
- [19] http://pdg.lbl.gov/2012/reviews/rpp2012-rev-tau-branching-fractions.pdf
- [20] S. Abdullin et al. (2006) [hep-ph/0605143].
- [21] J.A.Aguilar, astro-ph 1301.6504v1.
- [22] J. Beacom et al.,Phys. Rev. D68 (2003) 093005; H. Athar et al.,Phys. Rev. D62 (2000) 103007.
- [23] Consortium for Spatial Information (CGIAR-CSI). http://srtm.csi.cgiar.org/.
- [24] R. Abbasi et. al, Phys.Rev. D86 (2012) 022005.
- [25] M.G. Aartsen, Phys. Rev. D88 (2013) 112008.
- [26] M. G. Aartsen et all., Astropart.Phys. 78 (2016) 1.
- [27] P. Kiraly, M.G. Thompson and A. W. Wolfendale, J.Phys. A4 (1971) 367.
- [28] A.N. Cilli and S.J. Sciutto,P hys.Rev. D64 (2001) 013010.
- [29] A.Reimer, Int. Journ. of Mod. Phys. D 18 (2009) 1511.
- [30] J.K.Becker, et al., Nucl. Instr. and Meth. in Phys. Res. Sect. A: 630 (1) (2011) 269.
- [31] A.Atoyan, C.D.Dermer, Phys. Rev. Lett. 87 (2001) 221102.
- [32] M.G.Aartsen et al., Phys. Rev. Lett. 113 (2014) 101101.
- [33] H.Abramowicz, A.Levy, hep-ph/9712415.
- [34] M.Gluck, E.Reya, A.Vogt, Eur. Phys. J. C5 (1998) 461.