Spontaneous emergence of van der Waals interaction in piezo-resonators - a road to phase coherence at mK temperatures
Abstract
We present the experimental results on the spontaneous emergence of the phase coherence in the system of oscillating electric dipoles in quartz piezo-resonators caused by the van der Waals interaction. Spontaneous emergence of the phase coherence in these systems is manifested via temperature-dependent, extremely accurate tune-up of their resonance frequencies in 9th order with relative spectral line-width less than 3.10-8 (this number is comparable with that in lasers) along with the very high frequency stability characterized by the low values of the Allan deviations. We also show that the application of an incoherent (noise) excitation signal leads to a spontaneous formation of the phase coherent state, and that the dissipation processes do not affect this phase coherent state (i.e. the resonance frequency of the system). All above-mentioned signatures are typical characteristics for a Bose-Einstein condensate of excitations. Smallness of the relative spectral lime-width in quartz piezo-resonators opens their potential application as alternative time etalons.
pacs:
07.20.Mc, 34.20.Cf, 77.84.-S, 77.65.FsBose-Einstein (B-E) condensation is a fundamental physical phenomenon when a macroscopic number of bosons condense into a collective quantum ground state governed by a single wave function. Text-book examples of the B-E condensates are superfluid 4He and ultracold atomic gases kapitza ; ketterle ; cornell . In case of the fermions, the scenario of the B-E condensation is provided via a mutual coupling interaction between pair of fermions allowing them the formation of the bosonic Cooper pairs, and these pairs condense and occupy the single energy level that is lower than the Fermi energy by the energy gap . Examples of such B-E condensates are superconductivity of electrons and superfluid 3He bcs ; osheroff . Recently, however, a concept of the B-E condensation was extended also to the physical systems with a spontaneous emergence of the phase coherence snoke1 . These can be the systems of excitations, the lifetime of which is longer than the time they need to scatter and there is an interaction acting between them allowing to set a single energy state governed by the single wave function snoke2 ; stoof . Typical examples of such excitations involve magnons, excitons, polaritons, etc. demo ; magnons ; kasp ; exci1 ; exci2 ; szym . It is worth to note that phenomenon of the spontaneous emergence of the order (or a synchronization process) is considered to be a vast and more general process acting in many complex systems report .
In physical systems, the criterium of the spontaneous emergence of the phase coherence means that particular system under consideration should exhibit a weak long-range interaction being comparable with its thermal energy, and by cooling the system, this interaction (i) should overwhelm the thermal energy and (ii) should couple and tune the excitations in a phase-coherent state. The dipole-dipole interactions, and in particular the van der Waals interactions are one of the fundamental, but relatively weak interactions which could satisfy above mentioned criteria and they are presented in many physical systems.
We focused our investigation on the presence of the van der Waals interactions in piezoelectric resonators. We used commercially available quartz tuning forks resonating at nominal frequencies 32 kHz, 77 kHz and 100 kHz. These devices are intensively used in AFM and STM techniques afm1 ; afm2 ; stm , physics of superfluids (3He and 4He) rob ; blaz1 ; hel1 , etc. It is generally known that when the standard quartz tuning forks oscillating in vacuum are cooled down to temperatures below 15 K, these resonators undergo a ”thermodynamic” transition into the high Q-value oscillation mode with the Q-value of the order of 106 or more rob ; fork1 . In order to measure quartz tuning fork with high Q-value, instead of using a traditional technique of the frequency sweep with continuous voltage excitation, we adapted and applied a pulsed-demodulation (P-D) technique (or heterodyning technique with pulsed excitation) fork2 . The P-D technique transforms the frequency of the measured signal to lower values without losing information about the original frequency and allows reduction of the sampling rate and increases the resolution of the frequency measurements. This allows to measure the decay signals from the freely oscillating resonators with high resolution in the frequency in 9th order. Free oscillations of the tuning forks at resonance frequency generate an alternating piezoelectric current being detected by a custom-made current-to-voltage (I/V) converter in order to minimize the losses in detection circuit IV ; JLTP . The I/V converter’s output voltage signal is then measured by a lock-in amplifier operating as a demodulator.
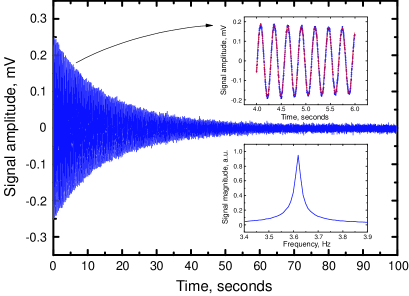
Before their installation the tuning forks were removed from the original metal can and the former (magnetic) leads were replaced by copper wires having a diameter of 120 m. These copper wires were electrically connected to tuning fork’s pads using a conductive silver epoxy and glued to a small piece of Stycast 1266 - epoxy impregnated paper in order to achieve a mechanical stiffness of the set-up. Cooling of the tuning forks was ensured by clamping these copper wires between two copper blocks and these blocks were screwed to the mixing chamber of the cryogen-free dilution refrigerator Triton 200. As an example, Fig. 1 shows the decay signal of 32 kHz tuning fork’s free oscillations measured in vacuum at temperature of 25 mK. The deposited energy (250 pulses with 5 mVRMS amplitude) used to excite the fork is equal to 3310-15 Joule. The tuning fork’s high Q-value is demonstrated by a long lasting decay signal of the order of several tens of seconds. Decay signals measured from 77 kHz and 100 kHz tuning forks had the same form, however, the duration of their decay signals in time was slightly shorter, up to 30 seconds for both 77 kHz and 100 kHz tuning forks. All measured decay signals were fitted using the expression
| (1) |
where is the initial amplitude of the signal, is the relaxation time constant characterizing a damping process, is the signal frequency and is the signal phase. Insets to Fig. 1 show a time window with the fit to experimental data using equation (1) and FFT spectrum of the signal. Fit applied to the data measured by P-D technique has the resolution in frequency measurement, , determined by , while that using traditional FFT technique is , where is the sampling frequency ( 1000 Hz) and is the signal duration in time. For the decay signal presented in Fig. 1, the fit to experimental data measured by the P-D technique gives the resolution in frequency to be 30 Hz, while the resolution of traditional FFT technique is 10 mHz.
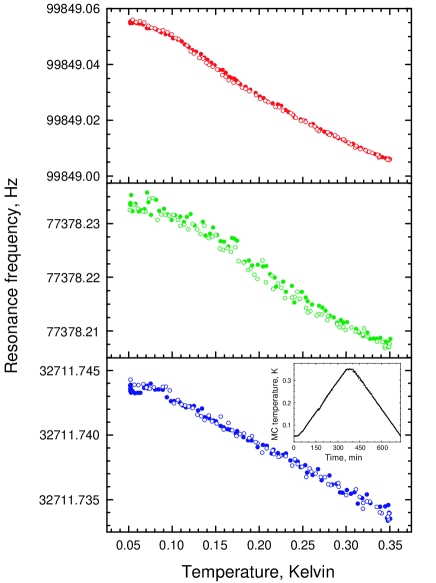
Figure 2 shows measured temperature dependencies of the tuning forks’ resonance frequencies during warming and cooling sweeps of the dilution refrigerator in temperature range between 50 mK and 350 mK. Temperature of the mixing chamber was measured using SQUID noise thermometer MFFT-1 provided by Magnicon and the temperature calibration was cross-checked using home-made fixed-point device fpd . The rate of the temperature sweeps was 1 mK per minute. We found that during warm up process the resonance frequencies of the tuning forks are decreasing. At a constant temperature, the resonance frequencies stay constant and on subsequent cooling process, the resonance frequencies rise reproducibly again. It is worth to note that we were not able to measure the temperature of the tuning forks themselves and presented measurements are related to temperature of the mixing chamber. However, based on the reproducibility we assume that the tuning forks were in thermal equilibrium with mixing chamber in temperature range presented. Inset to Fig. 2 shows the time evolution of mixing chamber temperature. What could be a physical origin of the fine temperature dependence of tuning forks’ resonance frequencies? Below we present a simple phenomenological physical model.
In contrast to a classical mechanical oscillator, there are oscillating induced electric dipoles ( is the charge and is the distance between the charges that is proportional to deflection of the ions from equilibrium position ) in the tuning fork, and each of them experiences a local electric field intensity produced by other electric dipoles (and an initial voltage pulse). Once the electric dipole moment is formed its potential energy equals to . This energy has a tendency to orient the dipole into direction of local field , but on the other side, the thermal energy violates this dipole order. We presume that during ”thermodynamic” transition into high Q-value mode the potential energy of the van der Waals interaction overwhelms the thermal energy and, similar to the dipole-dipole interaction in superfluid 3He, this energy is always minimized i.e. it orients the dipole into direction of the electric field and in such way provides the phase coherence. The total potential energy of the dipole including the elastic energy associated with lattice deformation
| (2) |
produces the restoring force , where is the spring constant, is the temperature dependent polarizability and is the deflection of the ion from equilibrium value. Polarizability of the quartz excited by the pulse can be expressed in form blakemore
| (3) |
where is the vacuum permittivity, is the density of dipoles and is the mean value of , which is equal to the Langevin function with . Therefore, the frequency of the tuning fork oscillations is determined by two terms
| (4) |
While the first, constant term, in presented model, corresponds to the resonance frequency determined by the elastic properties of the quartz, the second term reflects the temperature contribution to the resonance frequency due to the rising stiffness of the potential energy provided by the van der Waals interaction with decreasing temperature.
Figure 3 shows the temperature dependencies of the tuning forks’ resonance frequencies normalized to the maximal values, measured in temperature range from 25 mK to 1 K. Solid lines represent the fits to experimental data using expression (see Eq. (4)), where , is the fitting constant characterizing the additional contribution to the stiffness due to van der Waals interaction, is the critical temperature and is the above-mentioned Langevin function. Presented fits show a good qualitative agreement with the experimental data. In fact, the values of critical temperatures for all three forks are almost the same: they are in range between 1.1 K and 1.5 K, which allows to estimate the energy of the van der Waals interaction to be of the order of 210-23 Joule ( 0.12 meV).
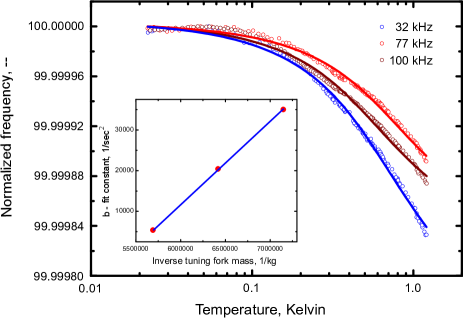
Inset to Fig. 3 shows the dependence of the -constants obtained from the fits as a function of the effective mass . The -constant is expressed as
| (5) |
The values of the effective mass for individual tuning forks were calculated using expression , where are the geometrical length, the thickness and the width of the arms of individual forks, respectively, and is the mass density of the . Pre-factor counts for an effective displacement of the forks’ arm (mass) during oscillations. The calculated values of the effective mass for individual forks are as follow: 32 kHz fork - = 1.7573E-7 kg; 77 kHz fork - = 1.5582E-7 kg; 100 kHz fork - = 1.3992E-7 kg. A linear dependence of the experimental values of -constants on shown in inset of Fig. 3 supports presented phenomenological model.
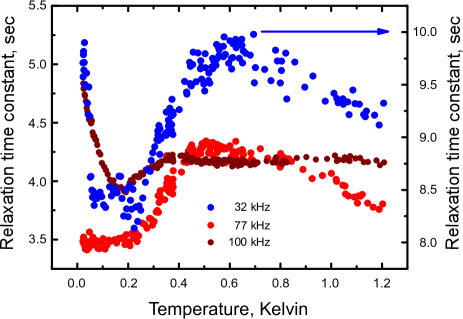
Now, let us discuss the influence of intrinsic damping process on tuning forks’ resonance frequencies. As mentioned above, the intrinsic damping processes are reflected in the relaxation time constant (). Figure 4 shows measured temperature dependencies of the relaxation time constants for individual tuning forks. Dependencies presented in Fig. 4 clearly demonstrate contradiction with properties of the standard linear harmonic oscillators, where the resonance frequency depends on damping (). Temperature dependencies of the resonance frequencies for measured forks behave independently on damping process, and this reveals that dissipation mechanisms are acting rather near the quartz surface than in its volume i.e. at the boundary, where the coherence is violated. Moreover, temperature dependencies of relaxation time constants show “Schottky-like anomalies” i.e. the temperature extrema, which one can attribute to a presence of thermally activated dissipation mechanisms. As the surfaces of the individual quartz tuning forks are covered by the metal electrodes made of various elements (tin, silver, etc.), Schottky barriers are formed on this interface due to difference in energy spectra between metal electrodes and quartz tersoff . These Schottky barriers can open additional dissipation channels caused by thermally activated injection of the electric charges from metal alloy to quartz. However, the physical nature of the dissipation processes remain unclear up to now and an additional work needs to be done to elucidate this problem.
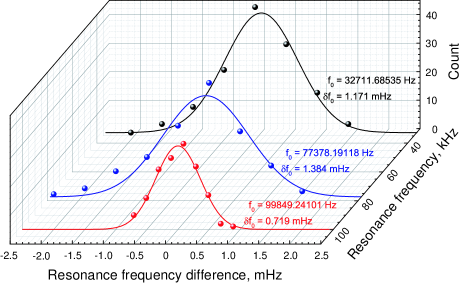
Observed temperature dependencies of the tuning forks’ resonance frequencies and their independence on the damping processes indicate that the system of oscillating dipoles in quartz tuning forks preserves the phase rigidity i.e. the phase coherence due to van der Waals interaction, thus revealing the characteristics of a coherent state of the oscillating dipoles. In order to justify this assumption we performed several measurements of the temperature stability of the resonance frequencies of individual tuning forks at different but constant temperatures. Figure 5 presents the distributions of the tuning forks’ resonance frequencies measured at base temperature of the dilution refrigerator. In order to show all three dependencies, we plot the difference from resonance frequency obtained from the Gaussian fits to measured data of individual tuning forks. Presented dependencies demonstrate extremely well defined resonance frequency for all tuning forks - for 32 kHz fork: 32711.68535 Hz 32 Hz, for 77 kHz fork: 77378.19118 Hz 57 Hz and for 100 kHz fork: 99849.24101 Hz 19 Hz, with relatively narrow line-width equal to 1.171 mHz for 32 kHz fork, 1.384 mHz for 77 kHz fork and 0.719 mHz for 100 kHz fork. Temperature of the mixing chamber was 8.2 mK 80 K during measurements. Taking a temperature derivative of the expression (4), one can estimate a frequency variation with temperature changes . Calculated values of the frequency variations corresponding to the temperature changes K for all forks are of the order of 10 Hz. Comparison of the calculated values of with measured data suggests that tuning forks themselves are exposed to a heating effect or there are temperature gradients present inside the forks leading to the frequency fluctuations, but sources of the heat or origin of the temperature gradients remain unknown yet.
The measurements of the piezo-resonator’s resonance frequencies at constant temperature, i.e. the frequency stability were also analyzed in terms of the Allan deviation allan ; cleland . The calculated Allan deviations of the resonance frequencies for the individual tuning forks are: 1.0E-8 for 32 kHz fork, 1.5E-8 for 77 kHz fork, and 2.4E-9 for 100 kHz fork. Considering that ”the sample time” is of the order of several tens of seconds and relatively low values of the resonance frequencies, the values of the Allan deviations demonstrate very high frequency stability comparable with the lasers stability.
In order to show the presence of spontaneous emergence of the phase coherence in the system of oscillating dipoles in quartz tuning forks, we tried to excite the fork’s oscillations using incoherent white noise signal, similar to the experiment performed with B-E condensate of magnons in superfluid 3He-B spinlaser .
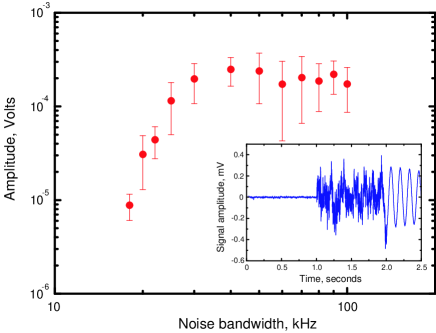
Noise measurements were performed by applying the white noise excitation with known bandwidth for 1 second period of time and amplitude of 5 mVrms to the 32 kHz tuning fork. The inset to Fig. 6 shows the dynamics of the birth and formation of the coherent signal. Due to statistical nature of the noise signal, measurements of the decay signals were repeated several times for given noise bandwidth. Figure 6 shows expected dependence of the signal initial amplitude as a function of noise bandwidth: the tuning fork is excited by white noise, when the frequency bandwidth of white noise includes the fork resonance frequency. It is worth to note that no decay signals were detected, when the noise signal having the bandwidth less than 18 kHz was applied.
In conclusion - we presented the experimental results on the spontaneous emergence of the phase coherence in the system of oscillating electric dipoles in quartz piezo-resonators caused by the van der Waals interaction. Spontaneous emergence of the phase coherence in these systems is manifested via temperature-dependent, extremely accurate tune-up of their resonance frequencies in 9th order with relative spectral line-width less than 3.10-8 along with the very high frequency stability characterized by the low values of the Allan deviations. These characteristics open potential application of piezo-resonator as alternative time etalons. Moreover, we showed that the application of an incoherent (noise) excitation signal leads to a spontaneous formation of the phase coherent state and that dissipation processes do not affect this phase coherent state (i.e. the resonance frequency of the system). All above mentioned signatures are typical characteristics for a B-E condensate of excitations. Whether this phenomenon is universal for the broad class of piezoelectric materials, and what is the nature of the dissipation mechanisms, these are the questions that need to be answered.
We wish to thank to Grigory Volovik for fruitful comments. This work was supported by projects APVV-14-0605, VEGA 2/0157/14, EU project ERDF-ITMS 26220120005 (Extrem-I), European Microkelvin Platform (H2020 project 824109) and by the U.S. Steel Košice.
References
- (1) P. Kapitza, Nature 141, 3558, 74 (1938).
- (2) K. B. Davis, M. O. Mewes, M. R. Andrews, N. J. van Druten, D. S. Durfee, D. M. Kurn, and W. Ketterle, Phys. Rev. Lett. 75, 3969 (1995).
- (3) D. S. Jin, J. R. Ensher, M. R. Matthews, C. E. Wieman, and E. A. Cornell, Phys. Rev. Lett. 77, 420 (1996).
- (4) J. Bardeen, L. N. Cooper, and J. R. Schrieffer, Phys. Rev. 106, 162 (1957).
- (5) D. D. Osheroff, R. C. Richardson, and D. M. Lee, Phys. Rev. Lett. 28, 885 (1972).
- (6) D. W. Snoke, Nature 443, 403 (2006).
- (7) D. W. Snoke and J. P. Wolfe, Phys. Rev. B 39, 4030 (1989).
- (8) H. T. C. Stoof, Phys. Rev. A 45, 8398 (1992).
- (9) S. O. Demokritov, V. E. Demidov, O. Dzyapko, G. A. Melkov, A. A. Serga, B. Hillebrands, A. N. Slavin, Nature 443, 430 (2006).
- (10) Yu. M. Bunkov, G. E. Volovik, J. Low Temp. Phys. 150, 135 (2008).
- (11) J. Kasprzak, M. Richard, S. Kundermann, A. Baas, P. Jeambrun, J. M. J. Keeling, F. M. Marchetti, M. H. Szymanska, R. André, J. L. Staehli, V. Savona, P. B. Littlewood, B. Deveaud, Le Si Dang, Nature 443, 409 (2006).
- (12) L. V. Butov, C. W. Lai, A. L. Ivanov, A. C. Gossard, D. S. Chemla, Nature 417, 47 (2002).
- (13) J. P. Eisenstein, A. H. MacDonald, Nature 432, 691 (2004).
- (14) M. H. Szymanska, J. Keeling, and P. B. Littlewood, Phys. Rev. Lett. 96, 230602 (2006).
- (15) A. Arenas, A. Diaz-Guilera, J. Kurths, Y. Moreno, Ch. Zhou, Physics Reports 469, 93 (2008).
- (16) J. Rychen, T. Ihn, P. Studerus, A. Hermann, K. Ensslin, Rev. Sci. Instrum. 70, 2765 (1999).
- (17) J. Rychen, T. Ihn, P. Studerus, A. Herrmann, K. Ensslin, H. J. Hug, P. J. A. van Schendel, H. J. Güntherodt, Rev. Sci. Instrum. 71, 1695 (2000).
- (18) A. Castellanos-Gomez, N. Agraït, G. Rubio-Bollinger, Nanotechnology 20, 215502 (2009).
- (19) R. Blaauwgeers, M. Blažková, M. Človečko, V. B. Eltsov, R. de Graaf, J. Hosio, M. Krusius, D. Schmoranzer, W. Schoepe, L. Skrbek, P. Skyba, R. E. Solntsev, D. E. Zmeev, J. Low Temp. Phys. 146, 537 (2007).
- (20) M. Blažková, M. Človečko, V. B. Eltsov, E. Gažo, R. de Graaf, J. J. Hosio, M. Krusius, D. Schmoranzer, W. Schoepe, L. Skrbek, P. Skyba, R. E. Solntsev, W. F. Vinen, J. Low Temp. Phys. 150, 525 (2008).
- (21) D. I. Bradley, P. Crookston, S. N. Fisher, A. Ganshin, A. M. Guénault, R. P. Haley, M. J. Jackson, G. R. Pickett, R. Schanen, V. Tsepelin, J. Low Temp. Phys. 157, 476 (2009).
- (22) M. Človečko, E. Gažo, M. Kupka, M. Skyba, P. Skyba, J. Low Temp. Phys. 162, 669 (2011).
- (23) M. Človečko, M. Grajcar, M. Kupka, P. Neilinger, M. Rehák, P. Skyba, F. Vavrek, J. Low Temp. Phys. 187, 573 (2017).
- (24) S. Holt, P. Skyba, Rev. Sci. Instrum. 83, 064703 (2012).
- (25) P. Skyba, J. Low Temp. Phys. 160, 219 (2010).
- (26) E. Gažo, L. Lokner, R. Scheibel, P. Skyba, N. Smolka, Cryogenics 40/7, 441 (2000).
- (27) J. S. Blakemore, Solid State Physics, Second edition, Cambridge University Press, Cambridge, 1985.
- (28) J. Tersoff, Phys. Rev. Lett. 52, 465 (1984).
- (29) D. Allan, Proc. IEEE 54, 221 (1966).
- (30) A. N. Cleland, M. L. Roukes, J. Appl. Phys. 92, 2758 (2002).
- (31) S. N. Fisher, A. M. Guénault, G. R. Pickett, P. Skyba, Physica B 329-333, 80 (2003).