Superconductivity and Charge Density Wave in ZrTe3-xSex
Abstract
Charge density wave (CDW), the periodic modulation of the electronic charge density, will open a gap on the Fermi surface that commonly leads to decreased or vanishing conductivity. On the other hand superconductivity, a commonly believed competing order, features a Fermi surface gap that results in infinite conductivity. Here we report that superconductivity emerges upon Se doping in CDW conductor ZrTe3 when the long range CDW order is gradually suppressed. Superconducting critical temperature in ZrTe3-xSex () increases up to 4 K plateau for . Further increase in Se content results in diminishing and filametary superconductivity. The CDW modes from Raman spectra are observed in = 0.04 and 0.1 crystals, where signature of ZrTe3 CDW order in resistivity vanishes. The electronic-scattering for high crystals is dominated by local CDW fluctuations at high temperures, the resistivity is linear up to highest measured and contributes to substantial in-plane anisotropy.
Correspondence and requests for materials should be addressed to Y.H.Z (zhangyh@hmfl.ac.cn) and C.P. (petrovic@bnl.gov).
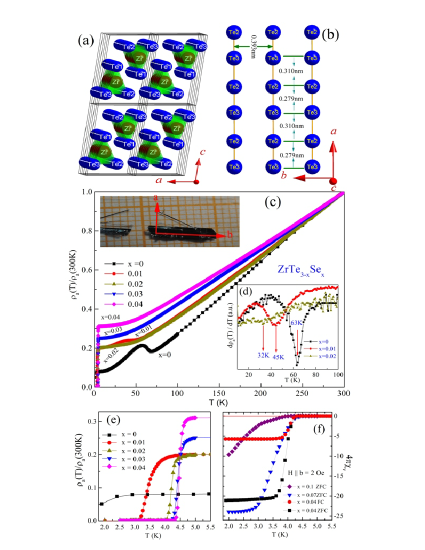
Charge density wave (CDW) and superconductivity (SC), both Fermi surface instabilities and low-temperature collective orders in solids, are commonly believed to compete with each other Gruner ; Gabovich . Recently, dynamic CDW fluctuations have also been discussed in copper oxide superconductors NM in connection with quantum critical transition between CDW and superconductivity. CDW favors low dimensional systems, especially transition metal (M) MX2 and MX3 chalcogenides (X represents S, Se and Te) Gruner ; Wilson . Among them, ZrTe3 is of interest since its crystal structure (Fig. 1a) is quasi-two dimensional (2D), yet it contains two quasi-one dimensional (1D) trigonal prismatic ZrTe6 chains with inversion symmetry along the -axis Felser . From the view along -axis (Fig. 1b), the top Te2/Te3 atoms form a rectangular network with the distances of 0.279/0.310 nm along the axis and 0.393 nm along the -axis. The first principle calculation gives evidence that the electron-type band (Te2/Te3 5 in origin) provides the major contribution, whereas the contribution of the partially filled hole-type band that originates in Te1 5 and Zr 4 orbitals is minor at the Fermi surface Felser . Angular resolved photoemission (ARPES) demonstrates that CDW originates from the Te2/Te3 5 band Hoesch .
ZrTe3 features not only a CDW transition temperature () 63 K with a CDW vector (; 0; ) but also a nearly isotropic in-plane and quasi-two-dimensional (2D) electronic transport Felser ; Eaglesham ; Takahashi . There is a filamentary SC in a stoichiometric single crystal with higher onset of for -axis from resistivity measurement than for -axis Felser ; Yamaya . Heat capacity data suggest that SC transitions in ZrTe3 are successive from filamentary-to-bulk with local pair fluctuations above Tc; SC phase first condenses into filaments along a-axis, becoming phase coherent below 2 KYamaya . Pressure(), intercalation, and disorder can tune ZrTe3 into bulk SC with suppression of CDW order Yomo ; Zhu ; Zhu2 .
Here we provide evidence for the pronounced upper critical field anisotropy and emerging 1D electronic transport along the ZrTe6 chain-direction axis in ZrTe3-xSex (). The anisotropy and new Raman modes suggest coexistence of local CDW modes and enhanced superconducting in ZrTe3-xSex.
Results
Normalized [/(300K)] [Fig. 1(c)] shows that the CDW anomaly is suppressed with increasing Se content. The [Fig. 1(d)] decreases whereas the bulk superconductivity sets in [Fig. 1(e,f)]. For , as shown in Fig. 1(e), the superconducting transition temperature () determined from the curves tends to increase, and transition width decreases. With increasing Se content , [Fig. 1(f)], somewhat lower = 4 K is observed for = 0.07, and the superconducting transition becomes wide and filamentary for = 0.1 with 3.1 K. ZrTe2.96Se0.04 shows typical behaviour of a type-II superconductor, whose field cooling (FC) is smaller than in zero field cooling process (ZFC) [Fig. 1(f)].
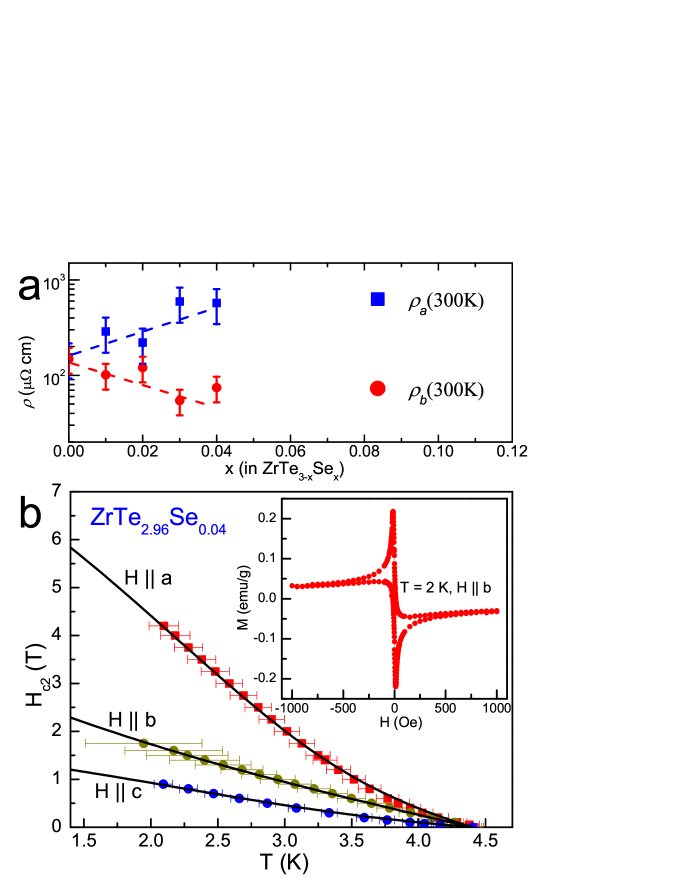
The and are almost identical to each other in ZrTe3 (x = 0), however with increasing Se content , room temperature tends to increase, while tends to decrease [Fig. 2(a)]. This indicates that ZrTe3-xSex becomes highly conducting along -axis in the normal state. If ZrTe3-xSex is an anisotropic superconductor with dominant quasi-1D (super)conductivity along the -axis, upper critical field along axis () should be larger than , according to the single band anisotropic Ginzburg-Landau theory since
| (1) |
To confirm this, we choose the ZrTe2.96Se0.04 crystal where the ratio of (T)/(T) is about 10 at 300 K [Fig. 2(a)]. The magnetic hysteresis () loop for ZrTe2.96Se0.04 [Fig. 2(b) inset] confirms that it is a typical type-II superconductor with some electromagnetic granularity. In ZrTe2.96Se0.04, relation can be observed [Fig. 2(b)]. This is in contrast to the -axis quasi-1D conductivity in the normal state suggesting multiband effects and/or additional factors that can contribute to mass tensor anisotropy. The upward curvature of -T curves implies that the multiband effects should be considered.
The for the two-band BCS model with orbital pair breaking is Gurevich :
| (2) | |||
| (3) |
where , is the digamma function, , and are band 1 and band 2 diffusivities, , and Wb is the magnetic flux quantum. , , and , where , , and . Interband coupling in two bands is given by and whereas and are intraband coupling constants in band 1 and 2, When , this simplifies to the one-band model orbital pair breaking in the dirty limit WHH . Dominant intraband (interband) coupling is obtained for ( ). The fits to the multiband model using in Table I are excellent [solid lines in Fig.2(b)]. Overall, the fitting results indicate dominant intraband couplingJaroszynski ; LeiH2 . Interestingly, the suggest different and , i.e. approximately an order of magnitude different carrier mobilities in the two bands. This difference in the intraband diffusivities could be due to differences in scattering or effective masses Gurevich ; Jaroszynski .
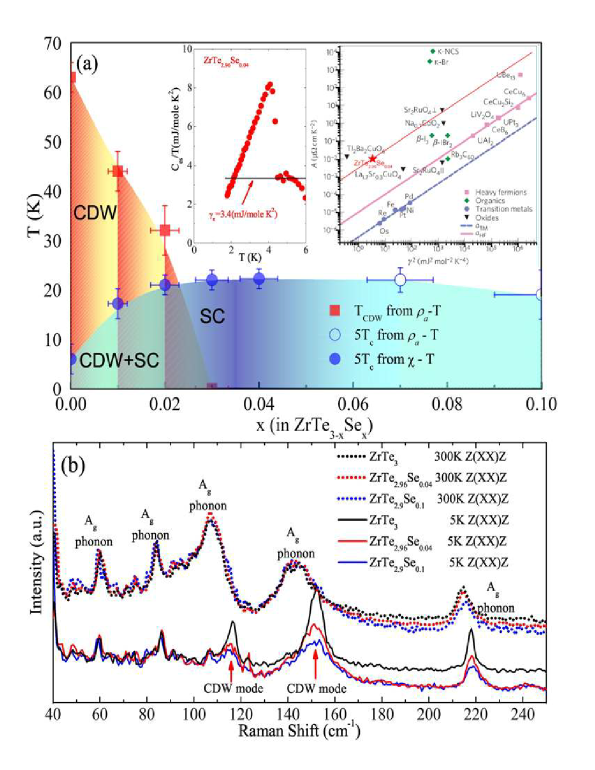
Figure 3(a) depicts the phase diagram of and versus Se content for ZrTe3-xSex. With increasing Se content , the CDW order detected by -axis resistivity anomaly is suppressed, vanishing around = 0.03. SC gradually increases up to the maximum = 4.4 K around = 0.04. With further increase in Se the superconducting appears to have onset near 4 K, becoming much broader and with smaller shielding factor suggesting percolative nature of SC. Even though the sample with higher Se content cannot be grown at present, it is clear that the SC should decrease to since ZrSe3 is a band insulator with a band gap of 1 eV Patel . In contrast, Hf substitution on Zr site in Zr1-xHfxTe3 does not suppress the CDW order, and no SC is observed. This is different from IrTe2, in which only 5d Ir site substitution can suppress the charge/orbital order and induce SC Yang . The Hf doping does not alter the Te2/Te3 bands, which explains why Hf doping cannot suppress the CDW order and induce SC.
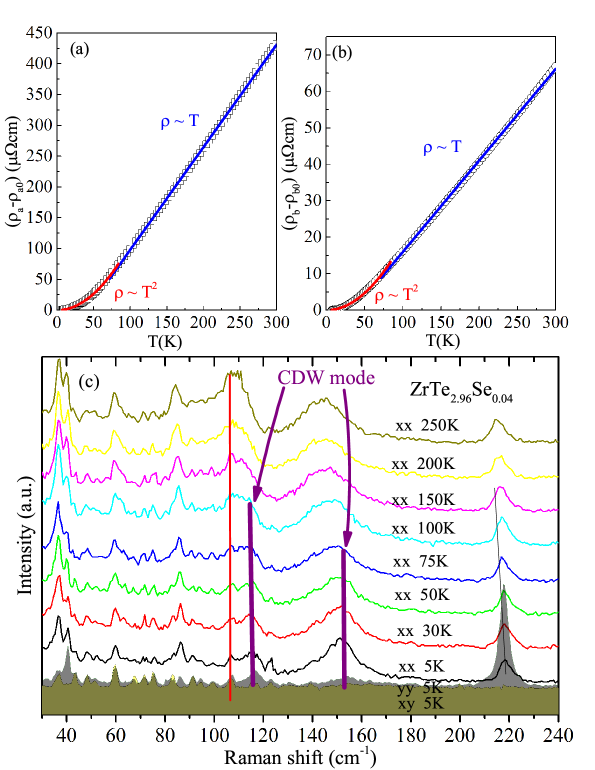
In what follows we compare the Raman signal of superconducting crystals to Raman signal of pure ZrTe3 with long range CDW order. Figure 3(b) depicts the Raman spectra normalized to 86 cm-1 mode of ZrTe3-xSex measured at 5K and 300K with Z(XX)Z polarization for different Se content. Small Se doping should not change the phonon spectrum at the room temperature and indeed, the 300 K spectra nearly overlap with each other. As expected, the Raman spectrum of ZrTe3 measured at 5K is different from the one measured at 300K. Two new modes appear around 115 cm-1 and 152 cm-1, which we assign to CDW (CDW mode) Raman1 ; Raman2 . Periodic lattice distortions in the CDW state will result in the new phonon modes below and some (CDW modes) can be observed in the Raman spectra, for example in 1T-TiSe2 Snow and 2H-NbSe2 Measson . The 108 cm-1, 140 cm-1 and 145 cm-1 modes are suppressed to low intensity with small temperature dependent shift at low temperature. The intensity of the two CDW modes 115 at cm-1 and 152 cm-1 becomes weaker for = 0.04 and 0.1. It should be noted that CDW modes are detected outside the phase boundary of CDW order. The normalized amplitudes of the two CDW modes exist for = 0.04 and 0.1, in crystals with no CDW signature in resistivity. This suggests a coexistence of superconductivity and CDW-related lattice distortions.
Discussion
Fermi surface of ZrTe3 contains multiple bands with both flat and dispersive portions as well as substantial hybridization of high mobility chalcogen-derived bands with low mobility metal-derived bandsFelser . We note that in ZrTe3 CDW fluctuations affect the angular resolved photoemission spectral function ) at temperatures above 200 K Yokoya . Scattering in such multiband CDW electronic system in the presence of local CDW fluctuations is dominated by scattering off collective CDW excitations below [; where is a constant parameter] and the electron-phonon and impurity-like scattering off local CDW fluctuations above the []Naito . Both and are perfecly linear from about 60 K up to highest measured temperature of 300 K, whereas a resistivity is observed from superconducting up to about 80 K [Fig. 4(a,b)]. With suppression of the CDW order by pressure or doping, CDW mode should vanishBarath , and indeed the absence of characteristic CDW-related hump is observed in resistivity. However as evident in Fig. 4(c), the signature of CDW mode in ZrTe3-xSex appears below about 100 K suggesting that the crystallographic vibration of the unit cell still senses CDW presence, but we speculate with no phase coherence.
The resistivity shows that electron-electron scattering due to CDW fluctuations dominates over the electron-phonon scattering and provides temperature dependence with relatively high values of coefficient . As a result, Kadowaki-Woods scaling / is comparable to Tl2Ba2CuO6, Sr2RuO4 or Na0.7CoO2 [Fig. 3(a) insets]KW ; Jacko ; Nozieres . In ZrTe3, with increasing , CDW order is first enhanced and reaches maximum around 2 GPa Yomo , then decreases, vanishing around 5 Gpa, whereas superconducting increases monotonically up to highest pressures. The phase diagram in Fig. 4b is different from this but Se could act as a chemical pressure due to its smaller size. Therefore slight increase in band filling of the quasi-1D Fermi surface sheet seen in pure ZrTe3 under pressure could be the mechanism for the in-plane anisotropy and promotion of SC Hoesch2 . However, due to very small Se content (up to about 3 atomic %) and no appreciable change in the unit cell parameters, this would imply strong sensitivity of CDW to substitutions on Te site and possibly to disorder.
As doping increases beyond the superconducing forms a weak dome or plateau-like temperature dependence similar to PrFeAsO1-xFx Rotundu . Charge-mediated attraction is involved in both CDW and SC. For well nested Fermi surface long range CDW is stable and superconductivity is only filamentary along a axis arising in the Te2/Te3 5px band Felser ; Yamaya . With Se doping the CDW is no longer detected in scattering but dominant intraband interaction could ensure that patches of CDW still survive, as seen by Raman. The small Se substitution is unlikely to remove the nesting condition but may perturbe the long range phase coherence of CDW and consequently resistivity hump. Broad superconducting transition, small reduction of SC transition temperature and significant decrease in the superconducting volume fraction suggest that the percolative SC is independent of Se content once the CDW-related resistivity anomaly is absent.
The above discussion suggests a possibility for a CDW-fluctuation induced heavy-fermion-like mass enhancement contribution to mass tensor anisotropy Murray . Moreover, superconductivity on the verge of the breakdown of the long-range CDW order is reminiscent to magnetic fluctuation mediated superconductivity in copper oxide and heavy fermion materials where the magnetic order is tuned by doping or pressure to at the Quantum Critical Point Monthoux ; Si ; Sebastian ; Cortes .
Conclusion
In summary, we show that superconductivity in ZrTe3-xSex single crystals arises in the background of CDW fluctuations that contribute to significant anisotropy of the both normal state resistivity and the upper critical field in the superconducting state. The CDW fluctuations exist outside of the phase boundary of CDW order.
Methods
Single crystals of ZrTe3-xSex were grown via iodine vapor transport method Zhu . The as grown single crystals can be easily cleaved along -axis and -axis, which usually produces needle- or tape- like crystals along -axis in the plane (shown in inset of Fig. 1c). Elemental analysis was performed by energy-dispersive X-ray spectroscopy (EDS) on an FEI Helios Nanolab 600i to determine the Se content. The Se content in as grown crystal is found to be less than the content in the starting material; measured EDS values are presented in figures. Powder X ray diffraction confirms phase purity however there were no appreciable changes of the lattice parameters (below 0.002 Å for and below 0.005 Å for lattice parameter), as expected for atomic substitution of up to about 3%. The crystal size becomes smaller when the Se content increases, reducing from about 3 x 5 mm2 for down to 1.5 x 1.5 mm2 in -plane for . Magnetization was measured in Quantum Design MPMS-XL-5. Resistance and magneto-resistance were measured by four probe method on Quantum Design PPMS-9 and PPMS-16. Raman spectra were measured on Horiba T64000, with excitation wavelength 647.4 nm and the power density was kept below 20 mW cm-2 in order to minimize the heating effects.
References
- (1) Gruner, G. Density Waves in Solids (Addison-Wesley, Reading MA 1994).
- (2) Gabovich, A. M., Voitenko, A. I. and Ausloos, M. Charge-density waves and spin-density waves in existing superconductors: competition between Cooper pairing and Peierls or excitonic instabilities. Phys. Rep. 367, 583-709 (2002).
- (3) Torchinsky, D. H. et. al. Fluctuating charge-density waves in a cuprate superconductor. Nature Materials, 12, 387-391 (2013).
- (4) Wilson, J. A. and Yoffe, A. D. The transition metal dichalcogenides discussion and interpretation of the observed optical, electrical and structural properties. Adv. Phys. 18, 193-335 (1969).
- (5) Felser, C. et. al. Electronic properties of ZrTe3. J. Mater. Chem. 8, 1787-1798 (1998).
- (6) Hoesch, M. et. al. Splitting in the Fermi surface of ZrTe3: A surface charge density wave system. Phys. Rev. B 80, 075423;DOI:10.1103/PhysRevB.80.075423 (2009).
- (7) Eaglesham, D. J. et. al. Electron microscope study of superlattices in ZrTe3. J. Phys. C 17, L697-L698 (1984).
- (8) Takahashi, S., Sambongi, T. and Okada, S. Conduction properties of ZrTe3. J. de Physique 44, 1733-1736 (1983).
- (9) Yamaya, K. et. al. Mixed bulk-filament nature in superconductivity of the charge-density-wave conductor ZrTe3. Phys. Rev. B 85, 184513;DOI: 10.1103/PhysRevB.85.184513 (2012).
- (10) Yomo, R. et. al. Pressure effect on competition between charge density wave and superconductivity in ZrTe3: Appearance of pressure-induced reentrant superconductivity. Phys. Rev. B 71, 132508;DOI: 10.1103/PhysRevB.71.132508 (2005).
- (11) Zhu, X. D., Lei, H. C. and Petrovic, C. Coexistence of bulk superconductivity and charge density wave in CuxZrTe3. Phys. Rev. Lett. 106, 246404;DOI: 10.1103/PhysRevLett.106.246404 (2011).
- (12) Zhu, X. et. al. Disorder-induced bulk superconductivity in ZrTe3 single crystals via growth control. Phys. Rev. B 87, 024508;DOI: 10.1103/PhysRevB.87.024508 (2013).
- (13) Gurevich, A. Enhancement of the upper critical field by nonmagnetic impurities in dirty two-gap superconductors. Phys. Rev. B 67, 184515;DOI: 10.1103/PhysRevB.67.184515 (2003).
- (14) Werthamer, N. R. Helfand, E. and Hohenberg, P. C. Temperature and Purity Dependence of the Superconducting Critical Field, Hc2. III. Electron Spin and Spin-Orbit Effects. Phys. Rev. 147, 295-302 (1966).
- (15) Jaroszynski, J. et. al. Upper critical fields and thermally-activated transport of NdFeAsO0.7F0.3 single crystal. Phys. Rev. B 78, 174523;DOI: 10.1103/PhysRevB.78.174523 (2008).
- (16) Lei, Hechang et. al. Multiband effects on -FeSe single crystals. Phys. Rev. B 85, 094515;DOI: 10.1103/PhysRevB.85.094515 (2012).
- (17) Patel, K. et. al. Optical and electrical properties of ZrSe3 single crystals grown by chemical vapour transport technique. Bulletin of Materials Science 28, 405-410 (2005).
- (18) Yang, J. J. et. al. Charge-Orbital Density Wave and Superconductivity in the Strong Spin-Orbit Coupled IrTe2:Pd. Phys. Rev. Lett. 108, 116402;DOI: 10.1103/PhysRevLett.108.116402 (2012).
- (19) Hu, Yuwen et. al. Charge density waves and phonon-electron coupling in ZrTe3. Phys. Rev. B 91, 144502;DOI: 10.1103/PhysRevB.91.144502 (2015).
- (20) Gleason, S. L. et. al. Structural contributions to the pressure-tuned charge-density-wave to superconductor transition in ZrTe3: Raman scattering studies. Phys. Rev. B 91, 155124; DOI: 10.1103/PhysRevB.91.155124 (2015).
- (21) Snow, C. S. et. al. Quantum Melting of the Charge-Density-Wave State in 1T-TiSe2. Phys. Rev. Lett. 91, 136402;DOI: 10.1103/PhysRevLett.91.136402 (2003).
- (22) M. A. Méasson et. al. Amplitude Higgs mode in the 2H-NbSe2 superconductor. Phys. Rev. B 89, R060503;DOI: 10.1103/PhysRevB.89.060503 (2014).
- (23) Yokoya, T. et. al. Role of charge-density-wave fluctuations on the spectral function in a metallic charge-density-wave system Phys. Rev. B 71, 140504;DOI: 10.1103/PhysRevB.71.140504 (2005).
- (24) Naito, M. and Tanaka, S. Electrical transport properties in 2H-NbS2, -NbSe2, -TaS2 and -TaSe2. J. Phys. Soc. Jpn. 51, 219-227 (1982).
- (25) Barath, H. et. al. Quantum and Classical Mode Softening Near the Charge-Density-Wave Superconductor Transition of CuxTiSe2. Phys. Rev. Lett. 100, 106402;DOI: 10.1103/PhysRevLett.100.106402 (2008).
- (26) Kadowaki, K. and Woods, S. B. Universal relationship of the resistivity and specific heat in heavy-fermion compounds. Solid State Commun. 58, 507-509 (1986).
- (27) Jacko, A., C., Fjrestad, J. O. Powell, B., J. A unified explanation of the Kadowaki-Woods ratio in strongly correlated metals. Nature Physics 5, 422-425 (2009).
- (28) Nozières, P. and Pines, D. The theory of Quantum Liquids (Perseus Books, 1999).
- (29) Hoesch M. et. al. Evolution of the charge density wave superstructure in ZrTe3 under pressure. Phys. Rev. B 93, 125102;DOI: 10.1103/PhysRevB.93.125102 (2016).
- (30) Rotundu, C. et. al. Phase diagram of the PrFeAsO1-xFx. Phys. Rev. B 80, 144517;DOI: 10.1103/PhysRevB.80.144517 (2009).
- (31) Murray J. M. and Tesanovic, Z. Theory of charge order and heavy-electron formation in the mixed-valence compound KNi2Se2 Phys. Rev. B 87, 081103;DOI: 10.1103/PhysRevB.87.081103 (2013).
- (32) Monthoux, P., Pines D. and Lonzarich, G. G. Superconductivity without phonons Nature (London) 450, 1177-1183 (2007).
- (33) Si, Qimiao and Steglich, F. Heavy fermions and quantum phase transitions Science 329, 1161-1166 (2010).
- (34) Sebastian, S. E. et. al., Metal-insulator quantum critical point beneath the high superconducting dome, Proc. Natl. Acad. Sci. USA 107, 6175-6179 (2010).
- (35) Cano-Cortes, L., Merino J. and Fratini, S. Quantum critical behavior of electrons at the edge of charge order Phys. Rev. Lett. 105, 036405;DOI: 10.1103/PhysRevLett.105.036405 (2010).
Acknowledgements.
We thank Shile Zhang, Zhe Qu, Wenhai Song, Lanpo He, Shiyan Li for help on heat capacity measurements. Work at High magnetic field lab (Hefei) was supported by National Basic Research Program of China (973 Program), No. 2011CBA00111, and National Natural Science Foundation of China (Grants No. U1432251, 11204312, 11474289). Work at Brookhaven National Laboratory is supported by the US DOE under Contract No. DE-SC00112704.§Present address: CNAM, Department of Physics, University of Maryland, College Park, Maryland 20742, USA
Author contributions
X.D. Z., C. P. and Y. H. Z. designed the experiments and wrote the draft. L. P, M. L. T. and Y. P. S. discussed the results and commented on the manuscript. Single crystals growth: X. D. Z., L. J. L. SEM and EDS: H. F. D Resistivity measurements and fits: W. N., K. F. W., L. J. L., X. D. Z and C. P.. Magnetization: L. S. L., Y. C. M, Y. L. Raman: R. R. Z., X. D. Z. Heat Capacity: J. L. Z
Competing financial interests: The authors declare no competing financial interests.
| a | 0.098 | 0.60 | 0.25 | 0.25 | 0.80 |
| b | 0.124 | 0.60 | 0.50 | 0.50 | 0.60 |
| c | 0.145 | 0.60 | 0.25 | 0.25 | 0.80 |