Collective Influence of Multiple Spreaders Evaluated by Tracing Real Information Flow in Large-Scale Social Networks
Abstract
Identifying the most influential spreaders that maximize information flow is a central question in network theory. Recently, a scalable method called “Collective Influence (CI)” has been put forward through collective influence maximization. In contrast to heuristic methods evaluating nodes’ significance separately, CI method inspects the collective influence of multiple spreaders. Despite that CI applies to the influence maximization problem in percolation model, it is still important to examine its efficacy in realistic information spreading. Here, we examine real-world information flow in various social and scientific platforms including American Physical Society, Facebook, Twitter and LiveJournal. Since empirical data cannot be directly mapped to ideal multi-source spreading, we leverage the behavioral patterns of users extracted from data to construct “virtual” information spreading processes. Our results demonstrate that the set of spreaders selected by CI can induce larger scale of information propagation. Moreover, local measures as the number of connections or citations are not necessarily the deterministic factors of nodes’ importance in realistic information spreading. This result has significance for rankings scientists in scientific networks like the APS, where the commonly used number of citations can be a poor indicator of the collective influence of authors in the community.
keywords:
Collective Influence, Complex Networks, Information SpreadingIntroduction
Identification of the most influential nodes in social networks has broad applications in a variety of network dynamics [1, 2, 3, 4, 5, 6, 7, 8, 11, 12, 9, 10]. For example, in viral marketing, advertising a small group of influential customers to adopt a new product can inexpensively trigger a large scale of further adoption [1, 2, 3, 4]; in epidemics control, the immunization of structurally important persons can efficiently halt global epidemic outbreaks in contact networks [8, 11, 9, 10]; and in biological systems like brain networks, some significant nodes are responsible for broadcasting information and therefore locating and protecting them are crucial for the whole information processing system [12]. Given its practical significance, the problem of finding the optimal set of influencers in a given network has attracted much attention in network science [13, 14, 15].
For a long time, researchers have developed numerous heuristic measures as predictors of nodes’ importance in information spreading. Among the most frequently used topological properties are the number of connections (degree) [7, 8], betweenness [16] and eigenvector centralities [17], PageRank [18], k-core [19, 20, 21, 22, 23], etc. All of them are established in the non-interacting setting, where nodes’ significance is evaluated by taking them as isolated agents. As a result, these ad-hoc approaches, designed for finding single superspreaders, fail to provide the optimal solution for the general case of multiple influencers. To address this many-body issue, a rigorous theoretical framework based on collective influence (CI) theory has recently been presented[24, 25]. With a broader notion of influence – collective influence, the CI method pursues the goal of maximizing the overall influence of multiple spreaders. Such explicit optimization objective enables CI to give the minimal set of spreaders.
Although CI exhibits good performance with scalability in the optimal percolation model, more validation work regarding its efficacy in real-world information spreading still needs to be done. Previously, the lack of real data of information diffusion has led to the mainstream adoption of artificial spreading models to simulate spreading dynamics. However, the over-simplified spreading models usually neglect such important factors as activity frequency [26], connection strength and behavioral preferences, thus fail to reproduce some observed characteristics of real information spreading [27]. More importantly, different models may produce model-dependent contradictory results [22]. Therefore, it is necessary to evaluate CI’s performance empirically through realistic information diffusion before applying it to real-world applications like marketing and advertising.
Here, we address this problem by tracking and analyzing the real-world information flows in a wide range of social media: journals of American Physical Society (APS), an online social network Facebook.com (Facebook) [28], a microblogging service Twitter.com (Twitter) and a blog website LiveJournal.com (LiveJournal). Rather than tracking the spreading range of single spreaders [22], we intend to investigate the overall spreading range, i.e., the collective influence, of multiple spreaders. To achieve this, the most straightforward idea is to extract and examine the real instances of information diffusion that are triggered by multiple spreaders. Unfortunately, such ideal multi-source spreading instances in which spreaders send out the same piece of message at the same time rarely exist in reality. Even though we can find such instances, the initial spreaders are hardly the same as the set of nodes selected by CI or other heuristic strategies, making the comparison between those methods impossible.
To overcome the aforementioned difficulties, we construct “virtual” multi-source spreading processes by following users’ behavioral patterns in the data. In particular, under the assumption that users will maintain their personal preferences in spreading processes, we measure the strength of directed social ties shown in historical diffusion records to represent the influence strength of a user imposing on another. For a node under influence of several spreaders, the overall influence on it is defined as the highest influence strength. In this way, we are able to quantify the collective influence imposing on the entire network, corresponding to the collective spreading range of virtual processes initiated by any given set of seeds. Through comparisons with competing heuristic methods, including high degree (HD) [7, 8], adaptive high degree (HDA) [24], PageRank (PR) [18] and k-core [19, 20, 21, 22], we find that the set of spreaders selected by CI can exert larger collective influence on the population with the same number of initial seeds. This provides a direct empirical validation of CI’s good performance in real information spreading. In addition, some individual properties such as the number of connections and citations, which were previously regarded as reliable predictors of influence, are found to be invalid in the context of collective influence. This in turn reflects that it is the interplay between spreaders that determines the collective influence rather than individual features.
Results
Introduction of Datasets
In the following empirical study, four datasets are examined: the journals of American Physical Society (APS), an online social network Facebook.com (Facebook) [28], a microblogging service Twitter.com (Twitter), and a blog website LiveJournal.com (LiveJournal). All datasets are available at kcore-analytics.com. During the period of data collection, people not only maintain social relations with their friends but also interact with others to spread and receive information. Certainly, there are diverse manifestations with respect to the social relation and interaction in distinct platforms. For instance, in the academic data of APS, authors show their social relations, i.e. coauthorship, through jointly publishing articles, and they reveal their interactions and information transmission by citing others’ papers. While in the online social media like Facebook, Twitter and LiveJournal, users reflect their social relations by becoming “cyber friends”, and they interact with each other by creating, receiving, and transmitting messages [29]. With the collection of such information, we can obtain the full network structure as well as the empirical information flows. Details about these data are explained as follows.
-
•
The American Physical Society (APS) is the world’s largest organization of physicists. APS data contains the information of all the scientific papers published on APS journals until 2005, including Physical Review A, B, C, D, E and Physical Review Letters. From the author lists and references of scientific publications, we can obtain the information about collaborations and citations. In total, there are 299,996 articles and 230,521 authors in the data, along with 2,356,525 records of citations. We construct the underlying collaboration network according to their coauthorship. If two authors have published one article together, one undirected edge is built between them. Beyond that, we trace the information diffusion based on the reference flows. If a scientist cites one paper written by , then we can say that information spreads from to .
-
•
Facebook is an online social networking service. In Facebook, each registered user maintains a friend list, which is a good representation of actual social relationships. Users can exchange messages, post status updates and photos, share videos, and browse the posts published by their friends. The Facebook data contains the friend lists and the entire records of wall posts from the New Orleans regional network, over a period of two years from September 26th, 2006 to January 22nd, 2009. This data contains 63,731 users and 838,092 wall posts in total. The social network is extracted from the friend lists. If user is added into user ’s friend list (or is in ’s friend list), we assume that they are friends so that we build an undirected edge between them. According to the wall posts, we can infer the information diffusion flows. If user makes comments on user ’s page, we presume that has gained information from to motivate him/her to write comments.
-
•
Twitter is a microblogging service that enables users to send and read short word-limited messages called “Tweets”. In the 2016 election year, Donald Trump, who is the presumptive nominee of the Republican Party for President of the United States, has become one of the most popular topics being discussed in Twitter. From February 10, 2016 to March 14, 2016, we collect approximately 670,000 Tweets that contain the key word “Donald Trump” or “Trump”. In the collection of Tweets, we extract four kinds of Tweets: mention, replies, retweet and quote. A mention is a Tweet that contains another user’s @username anywhere in the body of the Tweet. A reply is a response to another user’s Tweet that begins with the @username of the person you’re replying to. Replies are also considered as mentions. Besides, a retweet is a re-posting of someone else’s Tweet, in which such character RT@username appears at the beginning to indicate that users are re-posting others’ content. A quote is a special form of retweet that users can write their own comments when they are re-posting. We consider the mention (and also reply) relationship as a representative of strong social ties and use them to construct the network structure. Meanwhile, we use retweets (and quotes) to obtain information flows. If user retweets a Tweet from user , we assume information diffuses from user to user .
-
•
LiveJournal is a blog-sharing website where users can maintain friend lists, keep a blog, journal or diary. Our data contains the friend lists for all users and their blog posts published from February 14th, 2010 to November 21st, 2011, which involves 9,573,127 users and 3,462,504 records of blog reference. Similar to Facebook, we depend on the friend list to build the underlying network topology. More importantly, LiveJournal users usually add URL links pointing to other relevant blogs when they refer them. As a result, we could use the URL reference to trace the information diffusion among users.
The originally constructed network is indicated by in which stands for the set of nodes and the set of edges. In the raw datasets of online social platforms including Facebook and LiveJournal, we find many inactive users who neither spread nor receive messages in network. Actually, they just register an account but do nothing during the period of time we collect data. Considering that no contributions are made by those inactive nodes to the information diffusion process, we exclude them from the original networks and construct an active network . Different from the online social platforms, APS has no such inactive nodes as all the authors have to publish papers and cite others’ work. However, APS data contains a minority of articles () whose number of coauthors are so large (more than coauthors) that they would produce extremely dense cliques. Therefore, we neglect those articles in constructing the APS network. In all the social networks, we only consider the largest connected component, denoted by . Properties of the original and truncated networks are provided in Table 1.
Construction of Virtual Information Spreading
In order to decide which strategy to use to locate the most influential nodes in networks, we intend to evaluate the collective influence exerted by the same number of influencers. The one that achieves the largest collective influence would be our first choice. To this end, the most straightforward idea is to compare the spreading range of multi-source spreading processes triggered by a fixed number of seeds selected by different methods. However, the multi-source spreading is an ideal process. In the ideal setting, multiple sources should be activated by the same piece of message at the same time. While in reality, such ideal situation rarely exists because of the intrinsic properties of real data. Users are interested in a wide range of topics, and they are receiving and delivering multifarious messages from time to time. It is unlikely that we can find enough real instances in which the spreaders happen to send out a same piece of message at the same time. Therefore, rather than enforcing real data to match the ideal expectation, we propose an alternative way - to construct a virtual multi-source spreading process.
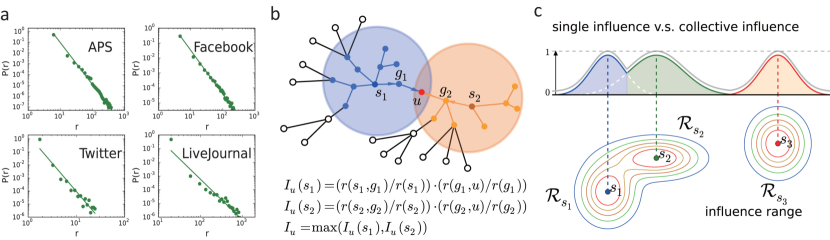
The main idea behind the virtual multi-source spreading processes is that users are expected to follow the behavioral patterns expressed in real data [30]. For user with neighbors who have chances to access information from , the closely-tied neighbors interested in user ’s publications or posts would be more likely to inherit messages from . On the contrary, those weakly-tied friends would occasionally be influenced by the information released from . To reflect this effect, we propose a notion named the strength of directed ties . For a directed link from to , the strength is defined by the number of messages, e.g., publications or posts, passed from to . By definition, the strength of directed tie from to is not generally equal to from to . Figure 1a reveals that the strength of directed tie follows a power-law distribution. We assume that, in the virtual processes, people would continue to maintain such behavioral patterns. In this way, we can approximate the multi-source information diffusion and obtain the collective influence as follows.
In the virtual processes, suppose a -percentage of initial spreaders are activated at the beginning, denoted by . We introduce a quantity to represent the single influence strength that node is affected by spreader . Correspondingly, we employ to indicate the collective influence strength enforced by all seeds . Both of their calculations can rely on the above mentioned strength of directed ties (shown in Figure 1b). For an arbitrary spreader , the influence strength from to its neighbor depends on the strength of directed tie , or in other words, depends on the tendency of to receive information from . Assume that, during one period of time, has totally sent out pieces of messages and has accepted of them []. The proportion of acceptance can be viewed as a proxy of influence strength from to , i.e. . Next, might affect its neighbor in the same way. Then we follow the spreading paths, multiply the proportions together and then acquire the influence strength enforcing on its -step neighbor , say
| (1) |
where . Figure 1b gives an example with . As none of messages can spread infinitely, we set a number as the maximum layer of spreading, so that the influence range, denoted by , could be approximated by a ball around with the radius (shown in Figure 1c). Within each , we have for the central spreader , then the value decreases as becoming larger, and for any external node. The schematic diagram regarding the distribution of influence strength within can be seen in Figure 1c. For APS and LiveJournal data, we know more information about references, the detailed calculation of influence strength is shown in Methods.
To obtain the collective influence for node , we apply
| (2) |
Referring to Figure 1b,c, it is straightforward to understand when node does not belong to any influence range, for any , in which case the collective influence should be zero. For the case that node is only influenced by one spreader, for example and for any , the collective influence should be chosen as the positive (largest) one . More generally, if node lies within the overlapping areas of more than one influence ranges, i.e. it is affected by more than one sources, we ought to choose the largest potential influence to be its collective influence during the virtual spreading process. Finally, we sum up all the together to obtain the collective influence that spreaders impose on the entire system through
| (3) |
Since , we have , which corresponds to the collective spreading range for the virtual process (see Figure 1c).
In general, the virtual process of multi-source spreading constructed here is an approximation of real information diffusion. We take advantage of real data to extract users’ behavioral patterns, base on which, we can calculate the single influence and collective influence that spreaders impose on each node. Given that, we can finally compute the collective influence exerted by all influencers on the entire network.
Comparison of Different Methods
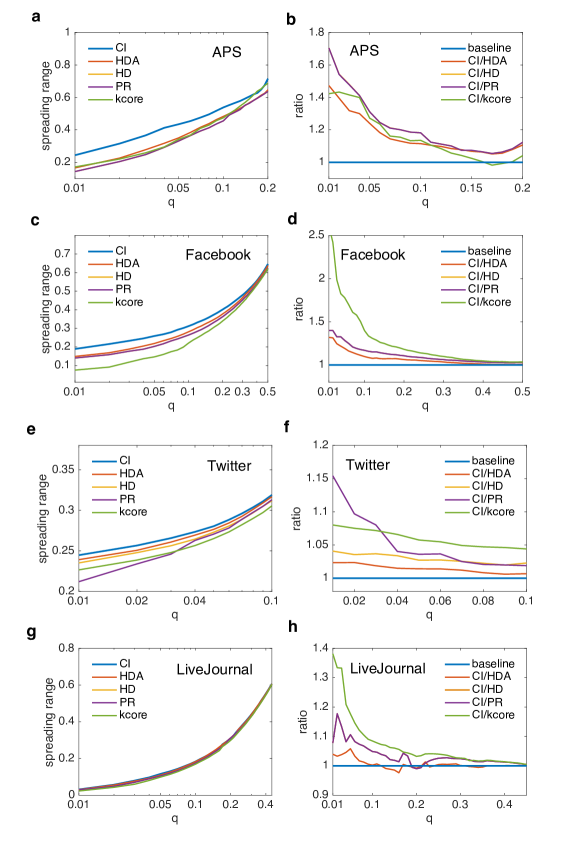
In this section, we compare CI algorithm with four other widely-used heuristic measures, including adaptive high-degree (HDA) [24], high-degree(HD) [7, 8], PageRank (PR) [18] and k-core [19, 20, 21, 22] (details about methods are shown in Methods). Recall that, our first step is to identify the -percentage of initial spreaders according to different methods. Secondly, we construct a virtual multi-source spreading process. Finally, we compare the virtual spreading range , i.e. the collective influence of those initial influencers.
Figure 2a,c,e,g show the virtual collective influence scores obtained by CI, HDA, HD, PR and k-core for the four networks – APS, Facebook, Twitter and LiveJournal. It can be seen that for a certain value of , the set of nodes selected by CI can diffuse the information to a larger scale of populations than those obtained by other methods. CI’s good performance is more prominent for APS and Facebook data as their diffusion instances are relatively abundant. To clearly distinguish the performances of different methods, we also present the ratios between CI’s collective influence score and those of other approaches (Figure 2b,d,f,h). It reveals that the ratios are always larger than one (indicated by the baseline at ) for all datasets. Besides, the ratio is relatively large when is small. As increases, it would decline accordingly, suggesting that if we select a larger amount of influencers, the collective influence score obtained by all methods would become similar. Among the competing heuristic methods, HDA can be viewed as a special case of CI with the calculation radius being zero [24] (see Methods). However, HDA’s capability in locating influencers is limited by the lack of knowledge of the surrounding nodes, so it is a strategy obtained from the non-interacting point of view. K-core method, a good predicator for locating single “superspreaders” [21, 22], whereas fails to identify multiple spreaders in the multi-source spreading process. This is because the selected influential nodes tend to cluster together in the core shells which induces large overlapping of their influence areas.
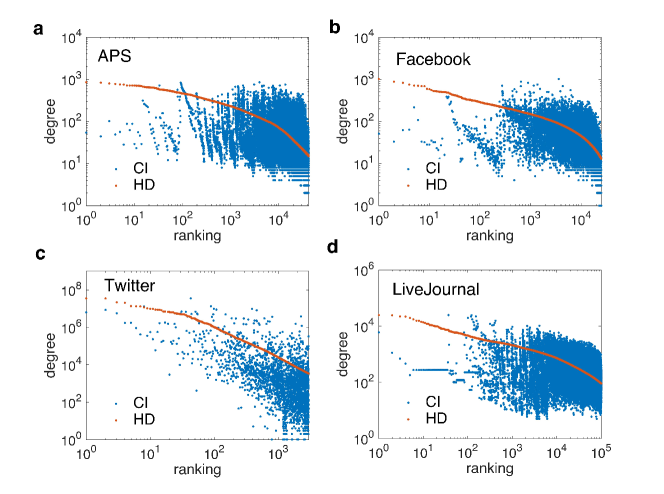
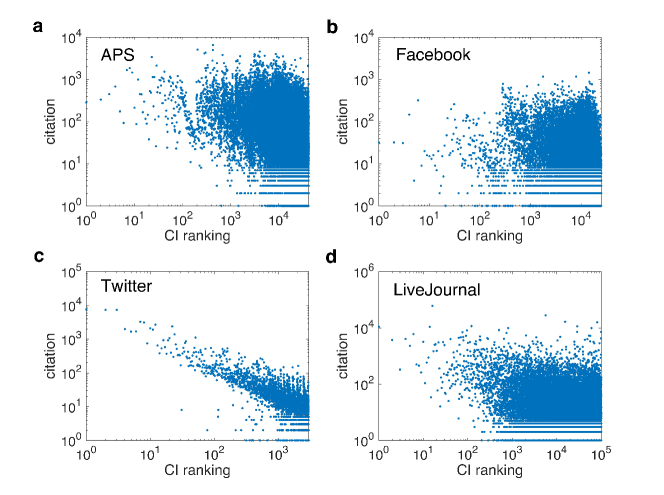
Besides, we also investigate the characteristics of influencers that CI has identified. Figure 3a shows the degree comparison of nodes ranked by CI and HD (from the most influential to the least). Unlike HD finding influencers just relying on degree, CI’s most important nodes contain not only hubs but also many weakly-connected nodes. Besides, some of the most connected nodes turn out to be moderate influencers. It confirms the former conclusion that collective influence is determined by the interplay of all the influencers. Under certain circumstances, some low-degree nodes surrounded by hierarchical coronas of hubs have larger contributions to collective influence than those high-degree nodes connecting to peripheral leaves [24]. In addition, we have also examined the correlation between CI ranking and the number of citations in Figure 4. The number of citation for each user is defined as how many times other people have accepted or inherited information from him/her directly. We acquire such information through checking the citations (APS), comments (Facebook), retweets (Twitter) as well as URLs reference (LiveJournal). Except for Twitter, the other datasets show us that the most influential nodes are not necessarily those with the largest number of citations. The uniqueness of Twitter might be explained by considering the mechanism of network formation and the way of data collection. Twitter platform facilitates users arbitrarily following others, making it possible that super hubs with millions of followers emerge and hold significant influence; Besides, Twitter is gathered by focusing on a popular topic ”Donald Trump”, the topic-based data might easily detect those extremely popular users who also play important role in spreading. Therefore, the phenomenon shown in APS, Facebook and LiveJournal suggest practical implications for academic rankings. When evaluating a researcher’s scientific impact within a field, his/her number of citation is not the determinative factor [31, 32]. It also reminds us that influence is an emergent property arising from interactions rather than an evaluation by viewing nodes individually.
Discussion
It is of importance to search for the most influential nodes in social networks. For a long time, heuristic approaches have been widely used to find superspreaders, yet without an ultimate solution for finding multiple influencers. Recently, a rigorous framework called collective influence (CI), along with a scalable algorithm, has been put forward to resolve the many-body problem. Even though CI has been shown to be effective in percolation model, we still need to verify its performance particularly in the real case of information diffusion. To achieve this, we collect data from four social media – APS journals, Facebook, Twitter as well as LiveJournal platforms. Different from the situation of finding single superspreaders where we check each node’s spreading range, under the circumstance of multiple spreaders, we should examine the collective spreading range. Given the difficulty that ideal multi-source spreading processes triggered by same messages at the same time are scarce in real-world diffusion, we propose a virtual multi-source spreading according to users’ behavioral patterns to approximate the ideal process. Finally, by comparing the collective influence, i.e. the spreading ranges in virtual process, we find that CI is effective in finding multiple influencers.
Moreover, our finding indicates that quantities from a non-interacting viewpoint, such as degree and the number of citations, are not reliable in measuring nodes’ importance in collective influence. Our investigation for influencers’ properties confirms that influence is an effect of cooperation in multi-source spreading. Our results can be transformed into an effective way to rank scientist in academic communities according to their collective influence rather than on the commonly used local connectivity metric, like the number of citations or collaborations in the H-index (Hirsch number). Using the number of citations, as shown in Fig. 4, can be a poor indicator of the collective influence of a researcher on other researchers in the community. A global quantity like the Collective Influence that takes into account the optimization of influence of all researchers at once, provides a meaningful ranking of researchers according to the maximization of their influence. More studies will follow to elaborate on this particular point.
Methods
Collective Influence Method
Collective Influence (CI) Algorithm [24]. CI is an optimization algorithm that aims to find the minimal set of nodes that could fragment the network in optimal percolation. In percolation theory [33], if we remove nodes randomly, the network would undergo a structural collapse at a critical fraction where the probability that the giant connected component exists is . The optimal percolation is an optimization problem which attempts to find the minimal fraction of influencers to achieve the result . Let the vector represent whether a node is removed () or not (), and the vector represent whether a node belongs to the giant connected component () or not (). The relationship between n and v can be derived in locally tree-like networks using message passing (MP) approach [34, 35]:
| (4) |
where indicates the probability of being in the giant component when is absent, and is the neighbors of besides . The equation’s possible solution for all is associated with the special situation where the giant connected component is absent; therefore, to obtain , the stability of this solution must be guaranteed. As a matter of fact, the stability of is controlled by the largest eigenvalue of the linear operator , which is defined on the directed edges of networks as
| (5) |
It can be expressed as
| (6) |
where is the non-backtracking matrix of the network [36, 37]. stores the topological interconnections of network whose element if . So far, the original optimal percolation problem has been rephrased as a mathematical statement: finding the optimal configuration of with size that achieves the critical threshold:
| (7) |
The eigenvalue can be calculated according to power method [38]:
| (8) |
At a finite , is the cost energy function of influence that needs to be minimized. Take Equation 8 as a starting point, the problem of finding the optimal set of influencers can be solved by minimizing the following cost function:
| (9) |
where is the set of nodes inside the ball of radius around the central node , and is the shortest path of length connecting and . To minimize the energy function of a many-body system, an adaptive method is developed with the main idea of removing the nodes causing the biggest drop in the energy function - CI algorithm. In general, CI algorithm can be stated as follows. Firstly, it considers the nodes at the frontier and assigns to node a collective influence value at the level of as
| (10) |
Starting with the node with the highest , CI adaptively removes nodes and after each removal, it recalculates for all the rest nodes in the system. From the calculation we know that CI has richer topological contents and its performance will be improved as increases, but no larger than the network diameter because this case amounts to random identification. In our analysis, we adopt the parameter in the adaptive calculation of CI, which has been shown to be sufficient for optimal percolation. At the opposite extreme , we have . Under this situation, CI algorithm is reduced to the High-degree adaptive (HDA) method. For , CI also considers the surrounding neighborhoods and the interactions among nodes; meanwhile, it is an easily-implemented algorithm as it only needs local topological structure within the ball of the radius instead of the whole network structure. More importantly, its computational complexity is , which guarantees its application for large real networks [41].
Heuristic Methods
k-core [19, 20, 21, 22]. In k-core method, nodes are ranked based on their values, which are calculated during the process of -shell decomposition. In -shell decomposition, nodes are removed iteratively. Firstly, nodes with are removed and continue pruning the networks until no leaf nodes are available. The set of removed nodes compose the peripheral k-shell with index . Similarly, the next k-shells with index are generated and the nodes located within the core area have the highest values. Actually, in -shell composition, all the nodes are divided into different shells according to their relative locations in networks. Compared with the peripheral nodes, the core nodes have higher probabilities to cause large-scale diffusions. This method has been revealed to perform well in searching for single spreaders who can yield large influence areas. However, it has a poor performance when being used to optimizing the collective spreading caused by multiple spreaders [21]. Because k-core would select a bunch of nodes within or near the network core, so their influence areas would heavily overlap and produce a bad collective outcome [21].
PageRank(PR) [18]. PageRank algorithm was firstly proposed by S. Brin and L. Page and used by Google in order to rank websites. It extends the idea in academic citation that the number of citations or backlinks give some approximation of a page’s importance, by not counting links equally but normalizing by the number of links on a page. Its calculation is as follows: if page has pages citations with the associated PageRank as , then the PageRank of is given by
| (11) |
in which is defined as the number of links going out of page . PageRank outputs a probability distribution used to represent the likelihood that a person randomly clicking on links will arrive at any particular page. The higher the probability, the higher the PR value of this page. In practice, PageRank can be calculated using a simple iterative algorithm and corresponding to the principal eigenvector of the normalized link matrix of the web network.
High-Degree(HD) [7, 8]. HD method ranks nodes directly according to the number of connections. Compared with other methods requiring global network structures like k-core and PageRank, HD only needs local information and is easily implemented. However, it cannot deal with the circumstance in which hubs form tight community such that their spreading areas would heavily overlap [39, 40].
High-Degree Adaptive(HDA). HDA is the refined adaptive version of HD method. To help mitigate the above mentioned situation, HDA recalculates the degrees after each removal. It can also be viewed as a special case of CI algorithm at . Compared with CI, HDA represents the one-body scenario where the influencers are considered in isolation and therefore, it lacks the collective influence effects from the neighborhood.
Data Processing
Analyzing APS and LiveJournal. In terms of APS, we know the specific article pairs , which means paper cites paper , In other word, the authors of spread their scientific discoveries to the authors of . Therefore, for an arbitrary author , we can know his or her journal set in which indicates each piece of paper and stands for the number of papers published by . By tracking the spreading for each paper through citation flows, we can determine its influence range containing all people who have cited this paper . For each receiver , we calculate the individual influence strength by where if and only if . Large values of means that is more likely to cite the work of than other peers. Next, the collective influence strength from all sources can be obtained by . In LiveJournal, we know information about blog references. So, we can follow the similar method as in APS to process LiveJournal data.
References
- [1] Valente, T. W. & Davis, R. L. Accelerating the diffusion of innovations using opinion leaders. Ann. Am. Acad. Polit. Soc. Sci. 556, 55-67 (1999).
- [2] Domingos, P. & Richardson, M. Mining knowledge-sharing sites for viral marketing. In Proc. 8th ACM SIGKDD Int. Conf. on Knowledge Discovery and Data Mining, 61-70 (ACM, 2002).
- [3] Van den Bulte, C. & Joshi, Y. V. New product diffusion with influentials and imitators. Market. Sci. 26, 400-421 (2007).
- [4] Iyengar, R., Van den Bulte, C. & Valente, T. W. Opinion leadership and social contagion in new product diffusion. Market. Sci. 30, 195-212 (2011).
- [5] Watts, D. J. A simple model of global cascades on random networks. Proc. Natl. Acad. Sci. USA 99, 5766-5771 (2002).
- [6] Watts, D. J., & Dodds, P. S. Influentials, networks, and public opinion formation. J. Cons. Res. 34, 441-458 (2007).
- [7] Albert, R., Jeong, H. & Barabási, A. Error and attack tolerance of complex networks. Nature 406, 378-382 (2000).
- [8] Pastor-Satorras, R. & Vespignani, A. Epidemic spreading in scale-free networks. Phys. Rev. Lett. 86, 3200-3203 (2001).
- [9] Yan, S., Tang, S., Pei, S., Jiang, S., & Zheng, Z. Dynamical immunization strategy for seasonal epidemics. Phys. Rev. E. 90, 022808 (2014).
- [10] Yan, S., Tang, S., Fang, W., Pei, S., & Zheng, Z. Global and local targeted immunization in networks with community structure. J. Stat. Mech. P08010 (2015).
- [11] Newman, M. E. J. Spread of epidemic disease on networks. Phys. Rev. E. 66, 016128 (2002).
- [12] Morone, F., Roth, K., Min, B., Stanley, H. E. & Makse, H. A. A model of brain activation predicts the collective influence map of the human brain. arXiv:1602.06238 (2016).
- [13] Leskovec, J. et al. Cost-effective outbreak detection in networks. In Proc. 13th ACM SIGKDD Int. Conf. on Knowledge Discovery and Data Mining, 420-429 (ACM, 2007).
- [14] Kempe, D., Kleinberg, J. & Tardos, É. Maximizing the spread of influence through a social network. In Proc. 9th ACM SIGKDD Int. Conf. on Knowledge Discovery and Data Mining, 137-143 (ACM, 2003).
- [15] Altarelli, F., Braunstein, A., Dallásta, L. & Zecchina, R. Optimizing spread dynamics on graphs by message passing. J. Stat. Mech. P09011 (2013).
- [16] Freeman, L. C. A set of measures of centrality based on betweenness. Sociometry 40, 35-41 (1977).
- [17] Freeman, L. C. Centrality in social networks: conceptual clarification. Soc. Networks 1, 215-239 (1978).
- [18] Brin, S. & Page, L. The anatomy of a large-scale hypertextual web search engine. Computer Networks 30, 107-117 (1998).
- [19] Dorogovtsev, S. N., Goltsev, A. V. & Mendes, J. F. F. K-core organization of complex networks. Phys. Rev. Lett. 96, 040601 (2006).
- [20] Carmi, S., Havlin, S., Kirkpatrick, S., Shavitt, Y. & Shir, E. A model of Internet topology using k-shell decomposition. Proc. Natl. Acad. Sci. USA 104, 11150-11154 (2007).
- [21] Kitsak, M. et al. Identification of influential spreaders in complex networks. Nature Phys. 6, 888-893 (2010).
- [22] Pei, S., Muchnik, L., Andrade J. S. Jr, Zheng, Z. & Makse, H. A. Searching for superspreaders of information in real-world social media. Sci. Rep. 4, 5547 (2014).
- [23] Pei, S., Makse, H. A. Spreading dynamics in complex networks. J. Stat. Mech. P12002 (2013).
- [24] Morone, F. & Makse, H. A. Influence maximization in complex networks through optimal percolation. Nature 524, 65-68 (2015).
- [25] Pei, S., Teng, X., Shaman, J., Morone, F., & Makse, H. A. Collective influence maximization in threshold models of information cascading with first-order transitions. arXiv:1606.02739 (2016).
- [26] Muchnik, L. et al. Origins of power-law degree distribution in the heterogeneity of human activity in social networks. Sci. Rep. 3, 1783 (2013).
- [27] Goel, S., Watts, D. J., & Goldstein, D. G. The structure of online diffusion networks. In Proc. 13th ACM Conf. on Electronic Commerce, 623-638 (ACM, 2012).
- [28] Viswanath, B., Mislove, A., Cha, M. & Gummadi, K. P. On the evolution of user interaction in Facebook. In Proc. 2nd ACM SIGCOMM Workshop on Social Networks, 37-42 (ACM, 2009).
- [29] Cheng, J., Adamic, L., Dow, P. A., Kleinberg, J. M., & Leskovec, J. Can cascades be predicted? In Proc. 23rd Int. Conf. on World Wide Web, 925-936 (ACM, 2014).
- [30] Pei, S., Muchnik, L., Tang, S., Zheng, Z., Makse, H. A. Exploring the Complex Pattern of Information Spreading in Online Blog Communities. PloS One 10, e0126894 (2015).
- [31] Wang, D., Song, C. and Barabási, A. L. Quantifying long-term scientific impact. Science 342, 127-132 (2013).
- [32] Radicchi, F., Fortunato, S., Markines, B. & Vespignani, A. Diffusion of scientific credits and the ranking of scientists. Phys. Rev. E. 80, 056103 (2009).
- [33] Bollobás, B. & Riordan, O. Percolation (Cambridge Univ. Press, 2006)
- [34] Bianconi, G. & Dorogovtsev, S. N. Multiple percolation transitions in a configuration model of network of networks. Phys. Rev. E. 89, 062814 (2014).
- [35] Karrer, B., Newman, M. E. J. & Zdeborová, L. Percolation on sparse networks. Phys. Rev. Lett. 113, 208702 (2014).
- [36] Hashimoto, K. Zeta functions of finite graphs and representations of p-adic groups. Adv. Stud. Pure Math. 15, 211-280 (1989).
- [37] Angel, O., Friedman, J. & Hoory, S. The non-backtracking spectrum of the universal cover of a graph. Trans. Amer. Math. Soc. 367, 4287-4318 (2015).
- [38] Bhatia, N. P. & Szegö, G. P. Stability theory of dynamical systems (Springer-Verlag, Berlin Heidelberg, 2002).
- [39] Wasserman, S. & Faust, K. Social Network Analysis (Cambridge Univ. Press, Cambridge, 1994).
- [40] Colizza, C., Flammini, A., Serrano, M. A. & Vespignani, A. Detecting rich-club ordering in complex networks. Nature Phys. 2, 110-115 (2006).
- [41] Morone, F., Min, B., Bo, L., Mari, R. & Makse, H. A. Collective Influence Algorithm to find influencers via optimal percolation in massively large social media. Sci. Rep. 6, 30062 (2016).
Acknowledgements
This work was supported by NIH-NIGMS 1R21GM107641, NSF-PoLS PHY-1305476 and ARL Cooperative Agreement Number W911NF-09-2-0053, the ARL Network Science CTA. We thank Lev Muchnik for providing the data on LiveJournal.
Author contributions statement
H.A.M. designed research; X.T., S.P. , F.M., H.A.M. analyzed data, prepared figures and wrote the main manuscript text; All authors reviewed the manuscript.
Additional information
Competing financial interests
The authors declare no competing financial interests.
| Networks | |||||||||
|---|---|---|---|---|---|---|---|---|---|
| APS | 230,521 | 1,607,305 | 230,521 | 1,607,305 | 190,161 | 1,582,710 | 16.4 | 37.4 | 20% |
| 63,731 | 817,090 | 45,746 | 703,924 | 45,459 | 703,803 | 31.0 | 18.8 | 45% | |
| 311,334 | 151,654 | 311,334 | 151,654 | 29,463 | 143,220 | 9.7 | 5.1 | 6% | |
| LiveJournal | 9,573,126 | 188,240,039 | 304,858 | 19,785,460 | 290,362 | 19,783,730 | 136.3 | 7.7 | 46% |