Metastability of Mn3+ in ZnO driven by strong (Mn) intrashell Coulomb repulsion: experiment and theory
Abstract
Depopulation of the Mn2+ state in ZnO:Mn upon illumination, monitored by quenching of the Mn2+ EPR signal intensity, was observed at temperatures below 80 K. Mn2+ photoquenching is shown to result from the Mn2+ Mn3+ ionization transition, promoting one electron to the conduction band. Temperature dependence of this process indicates the existence of an energy barrier for electron recapture of the order of 1 meV. GGA calculations show that after ionization of Mn2+ a moderate breathing lattice relaxation in the 3+ charge state occurs, which increases energies of (Mn) levels. At its equilibrium atomic configuration, Mn3+ is metastable since the direct capture of photo-electron is not possible. The metastability is mainly driven by the strong intra-shell Coulomb repulsion between (Mn) electrons. Both the estimated barrier for electron capture and the photoionization energy are in good agreement with the experimental values.
pacs:
71.55.-i, 71.55.Gs, 76.30.-v, 71.15.MbI Introduction
ZnO is a promising material for photocatalysis Maeda et al. (2005) and photovoltaic applications. Law et al. (2005); Riaz et al. (2015) Mn substituting for the divalent cation in ZnO introduces a Mn2+/Mn3+ level located in the forbidden gap. Johnson et al. (2010) The mid-gap position of Mn2+ has been already practically utilized and powers the research on water splitting. Maeda et al. (2005) Mn-doped ZnO also exhibits a chromatographic effect: the undoped transparent crystals upon doping with Mn turn reddish-brown due to the strong absorption interpreted as Mn (Mn) photo-ionization transition, Johnson et al. (2010) where denotes a photoelectron in the conduction band. This absorption is accompanied by photoconductivity. Johnson et al. (2010) The nature of this transition has been inferred only indirectly. Though the presence of Mn in the 2+ charge state in ZnO was detected with use of electron paramagnetic resonance (EPR), Hausmann and Huppertz (1968); Chikoidze et al. (2005) no optical spectra related to intra-center transitions of Mn2+ were observed. Since these transitions can occur at energies higher than the observed photo-ionization band, it was concluded that the excited states of Mn2+ are degenerate with the conduction band of ZnO Godlewski et al. (2010), consistent with the midgap position of the Mn2+ energy level. However, no direct evidence of the depopulation of the Mn2+ state under illumination was presented so far.
In this paper we study directly the occupancy of Mn2+ ions under illumination by means of photo-EPR spectroscopy. We observe a temperature dependent decrease of the EPR signal intensity under excitation with light of energies corresponding to the Mn related absorption band. The kinetics of the EPR signal photo-quenching points out to a process involving photocarriers and the Mn ions directly. First principles calculations indicate that the observed photoquenching is due to a transition of Mn3+ to a metastable state after photoionization. Metastability of defects and/or dopants typically originates in strong lattice relaxations after the change of the defect charge state. In the case of the As antisite in GaAs studied in the past (the EL2 center), optical excitation is followed by a large displacement, exceeding 1 Å, of the defect towards the metastable interstitial site. Dabrowski and Scheffler (1989, 1988) A similar mechanism is operative also in the case of donors, which can acquire the DX configuration when a shallow donor captures an electron and becomes a deep one with a strongly localized electronic state in the band gap, Chadi and Chang (1988); Dobaczewski et al. (1992); Bogusławski and Bernholc (1997); Wetzel et al. (1997); Thio et al. (1996) and in the case of native defects, Lany and Zunger (2008) where the (meta)stability is responsible for quenching of doping efficiency. A metastable configuration can also consist in a breathing-like displacement of the surrounding host atoms. Jones and Öberg (1991); Schmidt et al. (1996) According to the present results, metastability of Mn in ZnO also requires substantial lattice relaxations induced by the change of the charge state. However, a novel factor that drives metastability of Mn3+ is the strong intracenter Coulomb coupling between the (Mn) states, which prevents the electron capture by Mn3+ followed by recombination. Finally, regarding the absorption measurements, the calculations predict that intracenter transitions should occur at energies higher than photoionization, in agreement with experimental data.
The paper is organized in the following way: in Sec. II the experimental setup and results are presented and discussed. In Sec. III, details of the theoretical approach, based on the Generalized Gradient Approximation (GGA) to the Density Functional Theory, are given. The corrections Anisimov et al. (1991, 1993); Cococcioni and de Gironcoli (2005) are applied to (Zn), (O), and the (Mn) shell. The proposed mechanism of metastability of the photoionized Mn is presented in Sec. III D. Section IV summarizes the obtained results.
II Results and discussion
II.1 Experimental methods
Mn doped ZnO single crystals were grown by chemical vapor transport. Mycielski et al. (2004) For the photo-EPR experiments the Mn concentration of 0.2 % was chosen, as it ensures well resolved, narrow-line EPR spectra of Mn2+. The sample was placed in an Oxford Instruments He gas flow cryostat enabling temperature dependent measurements in the range of 3-300 K. The EPR experiments were performed at 9.5 GHz, with use of a BRUKER ESP300 spectrometer equipped with Oxford Instruments ESR 900 cryostat operating in the temperature range 1.8-300 K. The magnetic field was oriented perpendicular to the -axis of the crystal. The sample was illuminated at right angle to the magnetic field direction with a set of laser diodes of wavelengths varying from 445 nm to 980 nm. For power dependent measurements a set of gray filters was employed.
II.2 Experimental results
The as-grown ZnO:Mn 0.2 % sample is highly resistive, in contrast to the n-type conductivity of undoped ZnO crystals grown with the same method. A part of the Mn ions occurs in the Mn2+ charge state and can be easily detected by EPR. Annealing the crystal in hydrogen atmosphere leads to a substantial (more than fivefold) increase of the Mn2+ ion fraction accompanied by the appearance of n-type conductivity.
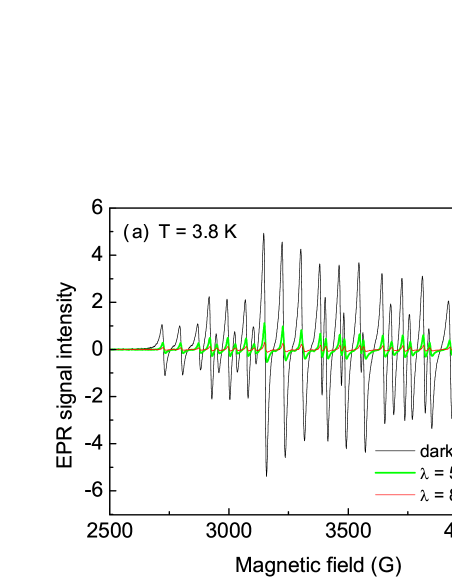
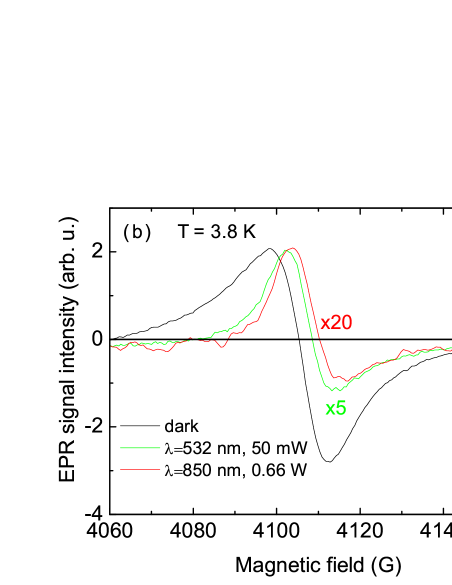
Figure 1a shows the EPR spectrum of Mn2+ in the as grown ZnO:Mn sample at 3.8 K taken with the magnetic field oriented perpendicular to the -axis of the crystal. The spectrum consists of 30 partly overlapped resonances grouped into 5 sextets. The five so-called fine structure groups stem from allowed transitions between electronic spin levels of a ion with the electronic spin of . Each group consist of 6 equally intense lines due to hyperfine interaction with the nuclear spin of Mn55. The spectrum is characteristic of isolated Mn2+ ions in ZnO. Hausmann and Huppertz (1968); Chikoidze et al. (2005) Analysis of the angular dependence of the resonance peak positions measured not (a) yields the spin Hamiltonian parameters , G, G, G, and G at 3 K, consistent with earlier studies. Johnson et al. (2010); Gluba and Nickel (2013)
Apart from the EPR spectrum of isolated Mn2+ ions, no other EPR signals were detected in our crystals, in particular neither complexes of Mn2+ with other defects (up to second nearest neighbors), nor spectra related to Mn-Mn pairs were observed.
Illumination with light in the 980 - 445 nm range leads to a drastic reduction of the detected EPR signal intensity of Mn2+. Exemplary spectra recorded at 3.8 K under illumination with 532 nm and 850 nm laser lines are shown in Fig. 1b. The laser power was 50 and 660 mW, respectively. Not all of the observed signal reduction can be attributed to a change of Mn2+ concentration alone. The dominant mechanism of the EPR intensity quenching shown in Fig. 1 comes from the skin effect, i.e., absorption by photogenerated free carriers, which reduces the microwave penetration depth and hence the effective volume of the sample. The skin effect manifests itself in a change of the resonance line shape from Gaussian to Dysonian, as shown in Fig. 1b. In addition, we observe a small shift of the resonance line positions towards higher magnetic fields under illumination. This shift is due to exchange interaction between localized magnetic moments of Mn2+ and free carrier spins, Story et al. (1996) an analogue of the Knight shift in nuclear magnetic resonance. Both the change of the EPR lineshape and the shift of the resonance fields directly prove that illumination with light in the whole wavelength range (445 - 980 nm) studied leads to generation of free carriers.
To eliminate the skin effect the sample was thinned down to 100 m. This thickness was found to be sufficient to ensure microwave penetration of the entire sample. We no longer observed changes of the line shape accompanying the reduction of the Mn2+ EPR signal intensity upon illumination. We can also exclude another possible source of intensity decrease in our experiment, i.e., sample heating due to incident laser power. Since the fine structure (high field resonances in Fig. 1a) and transitions (low field resonances) have the same probability, the difference in the intensities of the high field and low field resonance lines reflects the difference in the thermal population of the -5/2 and 3/2 levels. At low temperatures (see Fig. 1a) the intensity of high field resonances is more than twice higher than that of the low field ones. With increasing sample temperature the intensity ratio decreases, and at 300 K both EPR resonances are almost equally intense. Even under illumination with 2.4 W at the lowest applied wavelength of 980 nm we observed no measurable change in the EPR signal intensity ratio between the and resonances. Thus, any light induced changes of the EPR signal intensity measured in the so prepared sample reflect solely the change in the occupancy of the manganese 2+ charge state. Unless explicitly specified, all further data reported here refer to measurements performed on the thin sample.

The spectral dependence of the Mn2+ EPR signal photoquenching is presented in Fig. 2a. Depicted is the relative reduction of the EPR signal intensity, , under illumination at a constant power of 50 mW. is defined as the difference between the signal intensities in the dark, , and under illumination, , divided by the dark intensity:
| (1) |
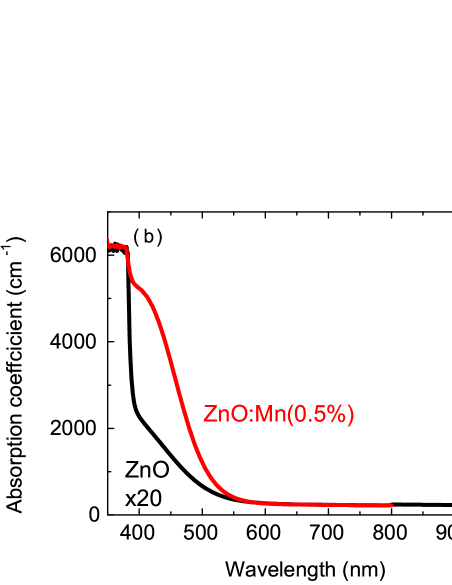
For comparison, the room temperature absorption spectra of ZnO:Mn 0.5 % and undoped ZnO are shown (Fig. 2b). As can be seen in Fig. 2b, the onset of the Mn-related absorption is close to 620 nm (2 eV), which is consistent with the optical ( eV) and thermal ( eV) ionization energies determined in Ref. Godlewski et al., 2009 for the postulated Mn 2+ to 3+ photoionization transition. The agreement between the spectral dependence of the Mn2+ EPR signal photoquenching below 600 nm in Fig. 2a and the absorption shown in Fig 2b proves unambiguously that the absorption band is indeed due to photoionization of Mn2+. However, above 600 nm there is a non-vanishing tail in , which we attribute to an indirect quenching mechanism, i.e., capture of holes generated in the photoneutralization processes of other defects present in the sample. Although the tail seems to be weak at the excitation power of 50 mW, at high incident powers due to the indirect mechanism is comparable to that observed for direct photoionization of Mn2+. This means that the concentration of the defects involved is not negligible.
We note that the spectral dependence of in Fig. 2 may not be very accurate, as in the photoquenching experiment different light sources for each wavelength were used. Although the light path was always optimized for the maximum response, there still remains the error connected to the difference in the spot sizes of the laser diodes.
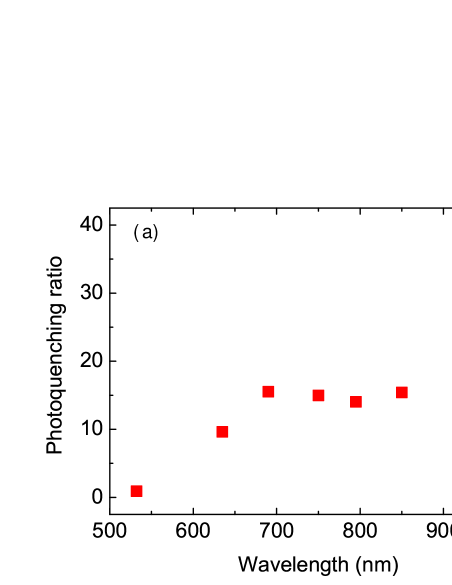
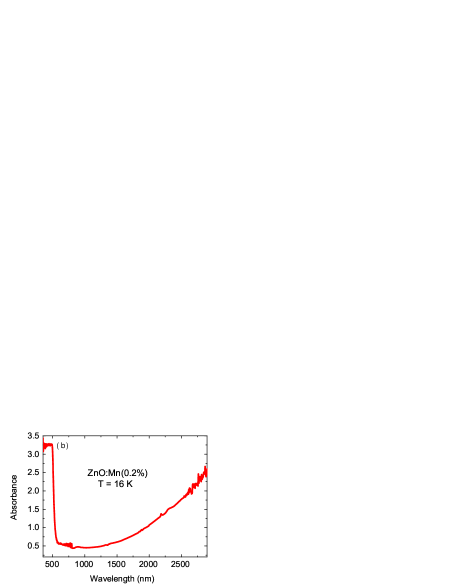
As already mentioned, in the thick ZnO:Mn sample we observe an additional reduction of the Mn2+ signal intensity under illumination, related to microwave absorption by free carriers. This reduction should increase with the concentration of photogenerated carriers as the effective volume penetrated by microwaves decreases. If the free carriers would originate solely from Mn2+, the spectral dependencies measured in thin and thick samples should scale with the behavior of the Mn2+ photoionization band. In Fig. 3a we show the spectrally dependent quenching of the EPR signal intensity of Mn2+ measured in the thick sample divided by the quenching measured after the sample was thinned down to 100 m, (thick)/(thin). The measurements were performed at a constant temperature of 3.8 K. As can be seen, the photoquenching ratio increases with increasing wavelength, in contrast to the behavior expected if Mn2+ photoionization would be the only mechanism of free carrier generation. This result demonstrates that there is at least a second channel of carrier photogeneration, dominant for wavelengths longer than 500 nm. Absorption extending to even longer wavelengths than applied in the photoquenching experiment is also observed in the optical spectrum of ZnO:Mn 0.2 % measured at low temperatures (16 K) shown in Fig. 3b. The nature and number of the defects responsible for carrier generation cannot be determined in our experiment as they give no paramagnetic signal. In the studied samples no EPR signal other than that of Mn2+ was detected.
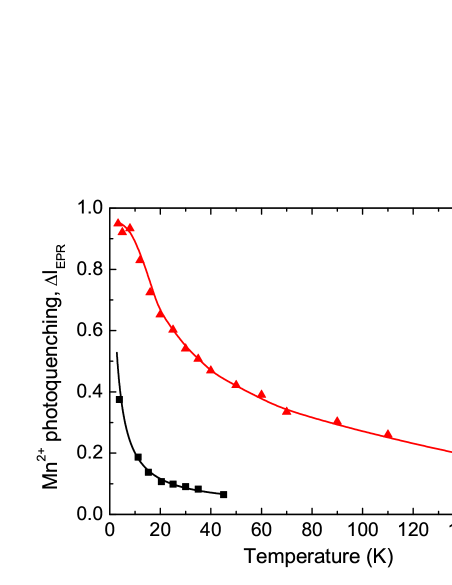
In contrast to absorption measurements, where the photoionization transition is observed up to room temperature, in the photo-EPR experiment photoquenching was found to be temperature dependent, as shown in Fig. 4. This is due to a fundamental difference between the two experiments. Whereas in absorption the signal is predominantly proportional to the occupancy of the initial state (Mn2+), in photo-EPR the change of the signal is proportional to the transient occupancy of the final state (Mn). This means that a fast recapture of the ionized electron by Mn3+ decreases photoquenching. In other words, photoquenching can only be observed if the occupancy of the final state is metastable. This can be achieved in two ways: either the photoionized electrons are trapped on other defect centers, or the recapture proceeds via an energy barrier. In both processes the recapture has a thermally activated character. Shown in Fig. 4 are the temperature dependencies of in the as-grown sample (squares) and the same sample after hydrogenation (triangles) illuminated with 532 nm light at 50 mW. The solid lines were calculated with use of the following simple relation:
| (2) |
where the parameter is the ratio of the concentration of Mn2+ ions in the dark to the total Mn concentration. Parameter depends on the electron concentration , light intensity , Mn2+ absorption cross section , and the temperature independent part of electron capture probability by Mn3+, . is the energy barrier for recapture of photoionized electrons. This relation was obtained assuming that the concentration of photogenerated electrons is much higher than that photoionized from Mn2+. Unfortunately, as we do not know the fraction of occupied Mn2+ ions in the sample (given by the parameter ), the parameters cannot be determined independently of each other. However, we obtain a reasonable agreement with experimental data with a finite barrier with the lowest estimated value of meV.
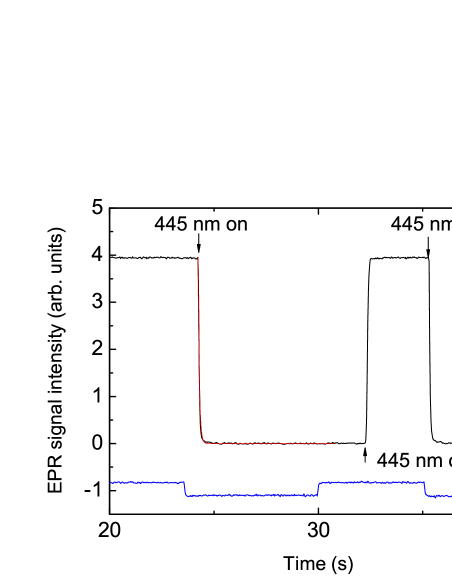
The kinetics of Mn2+ photoionization is very abrupt, as shown in Fig. 5. The kinetics was measured at 3 K at a constant field value, corresponding to a maximum intensity of one of the resonance lines. The upper and lower traces show the change of the signal intensity under 445 nm excitation at a power of 190 and 20 mW, respectively. The red line is calculated assuming a decay time of 63 ms (apparatus response time). This decay constant is much too short to account for the kinetics of a process involving charge transfer between Mn and other trap centers, which is usually of the order of minutes. Godlewski (1985) Moreover, the observed decay time does not depend on excitation power, which suggests that the real decay time is shorter than the spectrometer response. However, at wavelengths above 600 nm there is also a slower component, responsible for a few percent of the signal decrease.
The photo-EPR experiments have confirmed that the Mn3+/Mn2+ level is located at 2.1 eV below the conduction band minimum of ZnO. In addition, it was shown that in as grown ZnO: Mn crystals the manganese impurity occurs predominantly in the 3+ charge state. To account for the partial occupancy of the Mn2+ state, there have to be other acceptors centers in the sample which push the Fermi level below the impurity level. One of the candidates is the complex of manganese with interstitial oxygen, Mn-Oi, postulated by Gluba and Nickel. Gluba and Nickel (2013) The presence of such an acceptor center, however, is not confirmed in our experiment. We observe only the recharging of isolated Mn ions. It should be also noted that apart from Mn2+ we detect no other EPR signals, whether of acceptors nor donors, in our crystals.
In particular, the EPR signal of a residual donor with the factor of 1.956, identified as hydrogen related shallow donor, Hofmann et al. (2002) is not observed even after hydrogenation of the sample. This signal does not appear also under illumination, which suggests that if this donor is present it is not effectively populated, i.e., the electron capture rate is much lower than that of Mn3+ ions. It should be also stressed that the temperature dependence of Mn2+ photo-quenching is not governed by activation energies typical for ZnO donors, which range from 35 to about 70 meV. Meyer et al. (2005) Instead, activation energies of the order of 1 meV, slightly dependent on sample treatment, are detected. All these point out to the conclusion that another temperature dependent mechanism must lead to a metastable change of the Mn2+ occupancy under illumination.
III Theory
III.1 Calculation details
The calculations are performed within the density functional theory in the generalized gradient approximation (GGA) of the exchange-correlation potential. Hohenberg and Kohn (1964); Kohn and Sham (1965); Perdew et al. (1996) The corrections are included. Anisimov et al. (1991, 1993); Cococcioni and de Gironcoli (2005) We use the pseudopotential method implemented in the QUANTUM ESPRESSO code, QE with the valence atomic configuration for Zn, for O and for Mn, respectively. The plane-waves kinetic energy cutoffs of 30 Ry for wavefunctions and 180 Ry for charge density are employed. The electronic structure of the wurtzite ZnO is examined with a -point grid. Analysis of a single Mn impurity in ZnO is performed using supercells with 72 atoms (2.8 atomic per cent of Mn). -space summations are performed with a -point grid for density of states (DOS) calculations, while calculations with fixed occupation matrices are performed using the point only. The terms for (Zn), (O), and (Mn) orbitals are treated as free parameters, whose values are discussed below. Ionic positions are optimized until the forces acting on ions became smaller than 0.02 eV/Å.
III.2 Pure ZnO
It was previously shown that both the local density approximation (LDA) and GGA fail to give correct band characteristics of ZnO. In particular, the band gap, , of ZnO calculated within LDA/GGA Schröer et al. (1993); Jaffe et al. (2000); Lim et al. (2012) is about 1 eV. This is due to the universal ”band gap problem”, i.e., the underestimation of the gap within LDA/GGA on the one hand, but also to the too high calculated energies of the (Zn)-derived bands Wei and Zunger (1988) on the other hand. The inclusion of the (Zn) term Zhou et al. (2007); Lim et al. (2012); Dong et al. (2004) solves this problem only partially, since the band gap is still underestimated by about 2 eV. For example, we find that when (Zn)=10 eV is employed the (Zn) band is at about 8 eV below the valence band maximum (VBM), in agreement with experiment, Lim et al. (2012); Dong et al. (2004); Ley et al. (1974); Vesely and Langer (1971) but eV is still wrong. This is because the coupling between (Zn) and VBM is weak due to the large energy difference between those states, and thus is not sensitive to the energy of the (Zn) band. To obtain a correct value of one should observe that the upper valence band is derived from (O) orbitals. Indeed, the inclusion of the (O) term for the (O) orbitals, in addition to (Zn), gives a correct band structure. Ma et al. (2013); Lim et al. (2012); Agapito et al. (2015) We find that (Zn)=12.5 eV and (O)=6.25 eV reproduce both the experimental of 3.3 eV Dong et al. (2004) and the energy of the (Zn) band, centered about 8 eV below the VBM, in excellent agreement with Ref. Agapito et al., 2015. These values also lead to the correct width of eV of the upper valence band of mostly (O) character, and the lower conduction band of (Zn) character. The relaxed crystal structure agrees well with experiment: the lattice parameters Å and Å, as well as the internal parameter are underestimated by less than 1 % in comparison with experimental values: Å, Å, and . Karzel et al. (1996) One should finally observe that the electronic structure of ZnO represents a problem even for the GW approach: as it is discussed in Refs. Lim et al., 2012; Lany et al., 2008 different GW calculations, including quasiparticle self-consistent GW calculations, still place the (Zn) band at an energy too high by about 1 eV, and an additional potential on Zn cations is needed to achieve the correct band structure.
III.3 Mn impurity in ZnO
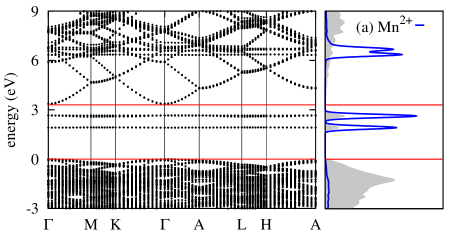
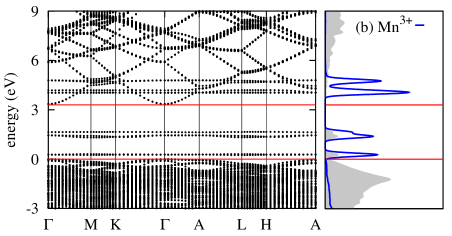
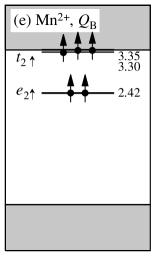
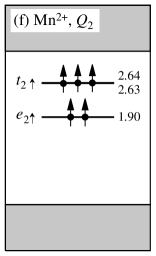
Properties of the Mn ion in ZnO depend on its charge state. The band structure and DOS of ZnO doped with Mn2+ and Mn3+ are shown in Fig. 6 for (Mn)=0. Mn2+ introduces two levels into the gap, a triplet at 2.64 eV above VBM and an doublet at 1.90 eV. (Actually, is split into a singlet and a doublet by the wurtzite crystal field with a small splitting of about 0.1 eV.) The spin-down states form resonances degenerate with the conduction band, and thus, in agreement with experiment, Mn cannot assume the 1+ charge state in n-type ZnO.
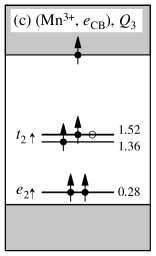
The and levels of Mn3+ are at about 1.45 and 0.28 eV above VBM, respectively, i.e., they are lower by eV than those of Mn2+. This large difference in the level energies of Mn2+ and Mn3+ stems from the strong intra-center Coulomb repulsion between (Mn) electrons caused by the localization of their wavefunctions. Moreover, the localized character of (Mn) is responsible for the relatively large 6 % reduction of the Mn-O bond length, from 2.02 Å for Mn2+ to 1.90 Å for Mn3+, which is induced by the decrease in the Coulomb coupling between Mn and O anions. We also mention that the energies of the gap states of the isolated Mn3+ and those of Mn3+ with a photoelectron in the conduction band are the same to within 0.02 eV, and the Mn-O bond lengths are the same to within 0.01 Å. This is because of the delocalized character of the wave function from the bottom of the conduction band. The results for Mn3+ with we are shown in Fig. 8c.
III.4 Photoionization, recombination, and mechanism of metastability

Due to the strong dependence of gap levels on the Mn charge state, the energies of absorption and/or recombination cannot be deduced directly from single particle states of Mn2+ (or Mn3+), as it was indicated in, e.g., Refs. Badaeva et al., 2009; Kittilstved et al., 2006. Consequently, energies of processes analyzed below are calculated from the total energy difference between final and initial states. not (b)
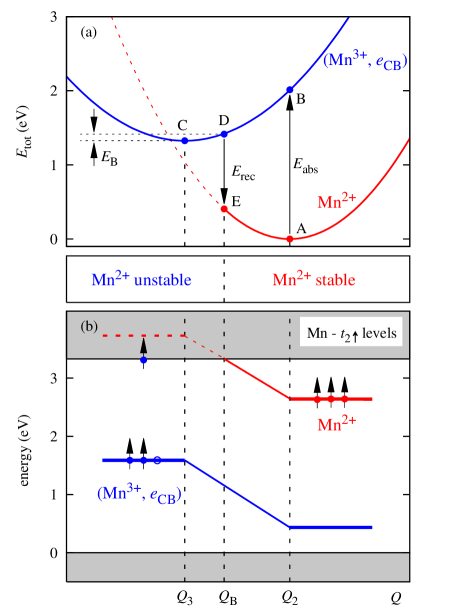
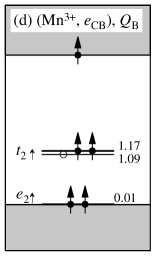
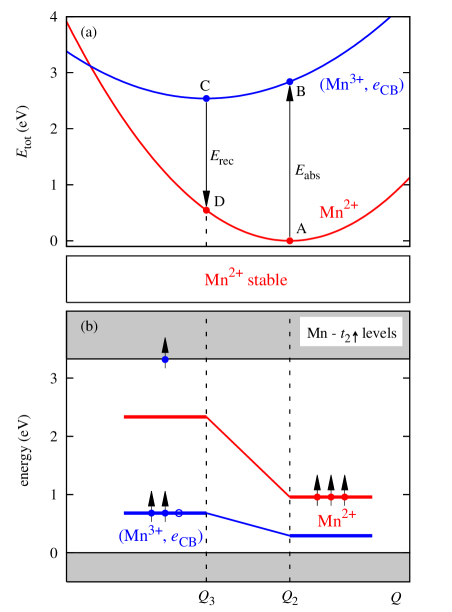
The absorption-recombination cycle of Mn2+ occurs in five steps. They are presented in Fig. 7, which shows both the total energy and the Mn energy levels for each step for (Mn)=0. Mn levels are shown in Fig. 8 in detail.
(i) In the first step (Fig. 7a, A B) one electron from of Mn2+ is excited to the conduction band, with the atomic positions kept fixed at the equilibrium configuration of Mn2+, . The excitation energy is eV. Photoionization induces a strong decrease of the energy by about 2 eV, see Figs 7b and 8b, because the depopulation of the (Mn) shell reduces the strength of the Coulomb repulsion.
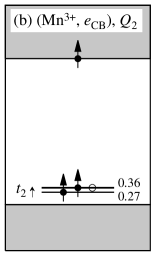
(ii) In the second step (B C), atoms are allowed to relax towards the equilibrium configuration of Mn3+ with the photoelectron in the conduction band. This case is denoted by (Mn) in Figs 7 and 8. During this step the Mn-O bonds are reduced by %, and the energy of increases by about 1 eV (Figs 7b and 8c), in agreement with its antibonding character. The corresponding energy gain ((B)(C)) is 0.69 eV.
This energy gain takes place in spite of the fact that the single particle gap level increase in energy by more than 1 eV, see Figs. 7b and 8c. This illustrates the fact that total energy differences cannot be deduced directly from single particle states of Mn2+ (or Mn3+), since other factors such as the Madelung ion-ion energy are dominant.
According to our results, the relaxed (Mn) state of Mn3+ with one electron in the conduction band is metastable, because its energy is higher than that of the relaxed Mn2+ by 1.32 eV (((C)-(A)) in Fig. 7a), but a direct recombination of the photoelectron to the level of Mn2+ is not possible. The instability stems from the fact that in the configuration the energy of the level of Mn2+ occupied with 3 electrons is above the conduction band bottom (CBB), see Fig. 7b. Indeed, the calculated dependence of of Mn2+ on the configuration coordinates, presented in Fig. 7b, shows that increases in energy with the decreasing Mn-O bond lengths, and merges with the conduction band for the atomic configuration . For smaller bond lengths, in particular in the configuration, it is a resonance degenerate with the conduction band. The extrapolated energies are shown by dashed lines in Fig. 7b, and the corresponding extrapolated total energy is shown by the dashed line in Fig. 7a. We use extrapolated values because for the configuration coordinates in the range we could not arrive at convergent results when fixing the occupation of the level by 3 electrons. The occupancy of by 3 electrons is unstable since there are empty conduction states lower in energy. In other words, Mn2+ is stable for configuration coordinates in the range from to , when is a gap state, while (Mn) is locally stabilized for configuration coordinates in the range (, ). At , the electron recombination is possible, with the corresponding energy gain . The difference in total energy of (Mn) between and is the energy barrier .
The difference between total energy of Mn2+ and (Mn) states in the configuration is only estimated from single particle levels at the state halfway between, thanks to the Janak theorem. Janak (1978) It formally gives the lower energy of Mn2+ state by 0.59 eV. Actually, however, the Mn2+ state is unreachable in the configuration and does not converge in our calculations. The Janak theorem can be applied in this case, since the ionic positions are kept fixed at .
(iii) A thermally driven atomic transition from to the barrier configuration (C D), which is described in detail below. According to our estimates, the upper limit for the barrier is 60 meV.
(iv) The capture of the photoelectron by Mn3+ (D E), i.e., the transition to the Mn2+ state. This transition at the estimated configuration provides the energy gain of eV.
(v) The relaxation of Mn2+ from to (E A) with eV.
Finally, we notice that the metastable atomic configuration of (Mn3+, ) is an excited state of the crystal as a whole, since the corresponding total energy is higher than that of ZnO:Mn2+ in the ground state configuration . Importantly, however, in those particular atomic configurations electrons are in the respective ground states, which justifies the usage of GGA. Consequently, both the total crystal energies and the total energy difference between the metastable configuration and the ground state are well defined as well. Moreover, in the configuration small displacements of anions around Mn increase the total energy of (Mn), which proves that this is indeed a metastable state of the crystal, and the barrier for electron recombination is non-vanishing.
III.5 Estimation of the energy barrier
(a)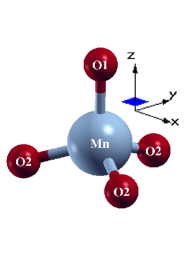 (b)
(b)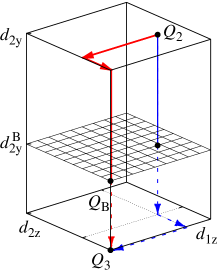
| ZnO: | 1.98 | 1.87 | -0.62 | 1.97 | 1.97 |
|---|---|---|---|---|---|
| Mn2+: | 2.03 | 1.92 | -0.63 | 2.02 | 2.02 |
| Mn3+: | 1.94 | 1.79 | -0.59 | 1.88 | 1.90 |
A detailed description of the metastability, in particular of the barrier height for return to the ground state, is difficult, because the atomic relaxations around Mn involve not only the nearest but also more distant neighbors. To make the problem tractable, we limit the parameter space to the four Mn-O bonds shown in Fig. 9a. The local symmetry of Mn is in all the considered cases, and consequently there are 3 parameters that define the geometry, , , and , which are defined in the caption to Fig. 9. The three basal O atoms are equivalent. Mn is assumed to be at , and the atoms beyond the first neighbors are allowed to relax. The calculated coordinates of the two non-equivalent oxygen ions for both Mn2+ and Mn3+ in the (Mn) configuration, together with the Zn-O bond lengths in ZnO for comparison, are given in Table 1. Two possible paths between and are displayed in Fig. 9b. In both cases we found that the level of Mn2+ is much more sensitive to the changes of than of or . For both paths, the Mn2+ instability begins at almost the same , which is denoted by in Fig. 9b. Therefore, the barrier configuration is taken as a point which is achieved from by changing only the coordinate. With this assumption we find as the configuration at which the level of Mn2+ is degenerate with CBM. This allows us to find the corresponding energy barrier, MnMn meV, which clearly represents the upper limit.
III.6 Dependence on (Mn)
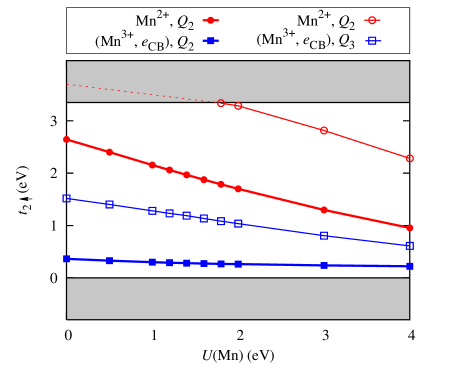
The analysis presented in the previous Section was conducted assuming (Mn)=0. As it was mentioned in Sec. III.1, the value of (Mn) is treated here as a free parameter, which can be adjusted to fit the experimental data. We have performed calculations for a few values of (Mn), and the results are presented in Fig. 10. As is follows from Fig. 10, the energies of gap levels of both Mn2+ and Mn3+ decrease with increasing . In particular, assuming (Mn)=4 eV brings about 0.9 eV above the VBM, and puts the level below the VBM. We also note that for (Mn)=4 eV, in the equilibrium configuration Mn-O bond lengths are 2.06 Å, while they are reduced to about 1.98 Å for , which shows that the impact of on bond lengths is moderate.
Comparing our results with previous theoretical investigations of Mn in ZnO we note that the LDA calculations including SIC corrections Toyoda et al. (2006) were performed for high Mn content, for which a wide Mn-induced band in the band gap was found in qualitative agreement with our results. LDA supplemented with the term imposed on the (Mn) orbitals was also used Raebiger et al. (2009); Chanier et al. (2009); Gluba and Nickel (2013). For (Mn)=3 eV, there is a reasonable agreement with Ref. Raebiger et al., 2009, which uses eV and eV (this corresponds to the effective eV), and with the time dependent DFT. Badaeva et al. (2009) The other applied (Mn) values were 6 eV Chanier et al. (2009) obtained from the fit to the experimental magnetisation data, and 3.2 eV Gluba and Nickel (2013) estimated according to Ref. Janotti et al., 2006. In these works, the Mn2+ level is situated at about 0.7-1.0 eV above the VBM. The levels of Mn3+ were not investigated. Our results obtained with (Mn)=3-4 eV are reasonably close to those quoted above.
To obtain the optimal value of (Mn) by fitting to our experimental results we note that the -induced downward shifts of the Mn levels imply that the excitation energy (step A B in Fig. 7a) increases from 2.0 to 2.84 eV when changes from 0 to 4 eV. Moreover, the barrier depends on the (Mn) term: it decreases with the increasing and it vanishes for (Mn) higher than about 1.7 eV. The decrease of is related with the -induced decrease of the Mn levels. In particular, for the level is degenerate with the conduction band for the configuration , while for eV it is below the CBM, and therefore a direct transition of the photoelectron from the conduction band to is possible. This feature is illustrated in Fig. 11 for (Mn) = 4 eV. Therefore, the best overall value of (Mn) is about 1.5 eV, giving a barrier of about 1 meV, and the excitation energy of about 2.4 eV.
IV Summary
Photo-EPR experiments performed on ZnO:Mn single crystals have confirmed that the Mn3+/Mn2+ level is located about 2.1 eV below the conduction band minimum of ZnO, as illumination of the crystal with photon energies higher than 2.1 eV leads to a partial, temperature dependent depopulation of the Mn2+ state at low temperatures, accompanied by photoconductivity. The unusually small thermal deactivation energy (of the order of 1 meV) together with the untypically fast kinetics of Mn2+ photoquenching point out to a process different from charge transfer from Mn2+ to other defect centers. We interpret the observed metastable change of Mn2+ occupancy under illumination as due to a small energy barrier for electron recapture from the conduction band by Mn3+.
GGA+ approach was employed to study both the Mn2+ - Mn3+ optical transitions, and the stability of the (Mn3+, ) photoexcited state. The excited state is found to be metastable, because in the relaxed configuration a direct recombination of the photoelectron is not possible, and recapture requires overcoming an energy barrier. The energy barrier decreases with the incrasing (Mn), and vanishes for eV. Comparing theory with experiment we find that (Mn) of about 1.5 eV leads to photoionization energy, 2.4 eV, and the barrier of the order 1 meV, in a reasonable agreement with the experimental data. Moreover, one should note that similar results hold for Mn and Fe ions in GaN, Volnianska et al. (2014); Zakrzewski and Boguslawski (2016) for which the experimental intra-center transition energies are reproduced with very small terms.
The metastability of (Mn3+, ) is related with the reduction of the Mn-O bonds after the Mn2+ ionization. This change of atomic configuration is coupled to electronic degrees of freedom, and it rises the energy of the d(Mn) donor level. More importantly, the Coulomb repulsion between the (Mn) electrons is strong, and it rises the Mn level energy by eV when Mn changes its charge state to Mn2+. In more detail, while the donor level of Mn3+ is situated below the bottom of the conduction band, after capturing the photoelectron the occupied donor level of Mn2+ would be above the empty conduction band, which is an unstable electronic configuration. This factor blocks the recombination of the photoelectron, and drives the metastability of Mn3+. While the role of the local lattice relaxatons was recognized and extensively discussed for metastable centers in semiconductors, Dabrowski and Scheffler (1989, 1988); Chadi and Chang (1988); Dobaczewski et al. (1992); Bogusławski and Bernholc (1997); Wetzel et al. (1997); Thio et al. (1996); Lany and Zunger (2008); Jones and Öberg (1991); Schmidt et al. (1996) the role of the strong Coulomb coupling between electrons represents a novel aspect of the physics of defect metastbility.
Acknowledgments
The authors acknowledge the support from the projects No. 2012/05/B/ST3/03095 and 2011/01/D/ST7/02657, which are financed by Polish National Science Centre (NCN). Calculations were performed on ICM supercomputers of University of Warsaw (Grant Nos. G46-13 and G16-11).
References
- Maeda et al. (2005) K. Maeda, T. Takata, M. Hara, N. Saito, Y. Inoue, H. Kobayashi, and K. Domen, J. Am. Chem. Soc 127, 8286 (2005), URL http://pubs.acs.org/doi/full/10.1021/ja0518777.
- Law et al. (2005) M. Law, L. E. Greene, J. C. Johnson, R. Saykally, and P. Yang, Nat. Mater. 4, 455 (2005).
- Riaz et al. (2015) U. Riaz, S. Ashraf, and J. Kashyap, Mater. Res. Bull. 71, 75 (2015), ISSN 0025-5408, URL http://www.sciencedirect.com/science/article/pii/S00255408153%00118.
- Johnson et al. (2010) C. A. Johnson, K. R. Kittilstved, T. C. Kaspar, T. C. Droubay, S. A. Chambers, G. M. Salley, and D. R. Gamelin, Phys. Rev. B 82, 115202 (2010), URL http://link.aps.org/doi/10.1103/PhysRevB.82.115202.
- Hausmann and Huppertz (1968) A. Hausmann and H. Huppertz, J. Phys. Chem. Solids 29, 1369 (1968), URL http://www.sciencedirect.com/science/article/pii/002236976890%1893.
- Chikoidze et al. (2005) E. Chikoidze, H. J. von Bardeleben, Y. Dumont, P. Galtier, and J. L. Cantin, J. Appl. Phys. 97, 10D316 (2005), URL http://scitation.aip.org/content/aip/journal/jap/97/10/10.106%3/1.1850372.
- Godlewski et al. (2010) M. Godlewski, A. Wąsiakowski, V. Ivanov, A. Wójcik-Głodowska, M. Łukasiewicz, E. Guziewicz, R. Jakieła, K. Kopalko, A. Zakrzewski, and Y. Dumont, Opt. Mater. 32, 680 (2010).
- Dabrowski and Scheffler (1989) J. Dabrowski and M. Scheffler, Phys. Rev. B 40, 10391 (1989), URL http://link.aps.org/doi/10.1103/PhysRevB.40.10391.
- Dabrowski and Scheffler (1988) J. Dabrowski and M. Scheffler, Phys. Rev. Lett. 60, 2183 (1988), URL http://link.aps.org/doi/10.1103/PhysRevLett.60.2183.
- Chadi and Chang (1988) D. J. Chadi and K. J. Chang, Phys. Rev. Lett. 61, 873 (1988), URL http://link.aps.org/doi/10.1103/PhysRevLett.61.873.
- Dobaczewski et al. (1992) L. Dobaczewski, P. Kaczor, M. Missous, A. R. Peaker, and Z. Żytkiewicz, Phys. Rev. Lett. 68, 2508 (1992), URL http://link.aps.org/doi/10.1103/PhysRevLett.68.2508.
- Bogusławski and Bernholc (1997) P. Bogusławski and J. Bernholc, Phys. Rev. B 56, 9496 (1997), URL http://link.aps.org/doi/10.1103/PhysRevB.56.9496.
- Wetzel et al. (1997) C. Wetzel, T. Suski, J. W. Ager III, E. R. Weber, E. E. Haller, S. Fischer, B. K. Meyer, R. J. Molnar, and P. Perlin, Phys. Rev. Lett. 78, 3923 (1997), URL http://link.aps.org/doi/10.1103/PhysRevLett.78.3923.
- Thio et al. (1996) T. Thio, J. W. Bennett, D. J. Chadi, R. A. Linke, and M. C. Tamargo, J. Electron. Mater. 25, 229 (1996), ISSN 1543-186X, URL http://dx.doi.org/10.1007/BF02666249.
- Lany and Zunger (2008) S. Lany and A. Zunger, Phys. Rev. Lett. 100, 016401 (2008), URL http://link.aps.org/doi/10.1103/PhysRevLett.100.016401.
- Jones and Öberg (1991) R. Jones and S. Öberg, Phys. Rev. B 44, 3407 (1991), URL http://link.aps.org/doi/10.1103/PhysRevB.44.3407.
- Schmidt et al. (1996) T. M. Schmidt, A. Fazzio, and M. J. Caldas, Phys. Rev. B 53, 1315 (1996), URL http://link.aps.org/doi/10.1103/PhysRevB.53.1315.
- Anisimov et al. (1991) V. I. Anisimov, J. Zaanen, and O. K. Andersen, Phys. Rev. B 44, 943 (1991), URL http://link.aps.org/doi/10.1103/PhysRevB.44.943.
- Anisimov et al. (1993) V. I. Anisimov, I. V. Solovyev, M. A. Korotin, M. T. Czyżyk, and G. A. Sawatzky, Phys. Rev. B 48, 16929 (1993), URL http://link.aps.org/doi/10.1103/PhysRevB.48.16929.
- Cococcioni and de Gironcoli (2005) M. Cococcioni and S. de Gironcoli, Phys. Rev. B 71, 035105 (2005), URL http://link.aps.org/doi/10.1103/PhysRevB.71.035105.
- Mycielski et al. (2004) A. Mycielski, L. Kowalczyk, A. Szadkowski, B. Chwalisz, A. Wysmołek, R. Stȩpniewski, J. Baranowski, M. Potemski, A. Witowski, R. Jakieła, et al., Journal of Alloys and Compounds 371, 150 (2004), ISSN 0925-8388, URL http://www.sciencedirect.com/science/article/pii/S09258388030%11101.
- not (a) Supplementary information.
- Gluba and Nickel (2013) M. A. Gluba and N. H. Nickel, Phys. Rev. B 87, 085204 (2013), URL http://link.aps.org/doi/10.1103/PhysRevB.87.085204.
- Story et al. (1996) T. Story, C. H. W. Swüste, P. J. T. Eggenkamp, H. J. M. Swagten, and W. J. M. de Jonge, Phys. Rev. Lett. 77, 2802 (1996), URL http://link.aps.org/doi/10.1103/PhysRevLett.77.2802.
- Godlewski et al. (2009) M. Godlewski, A. Wójcik-Głodowska, E. Guziewicz, S. Yatsunenko, A. Zakrzewski, Y. Dumont, E. Chikoidze, and M. Phillips, Opt. Mater. 31, 1768 (2009).
- Godlewski (1985) M. Godlewski, physica status solidi (a) 90, 11 (1985), ISSN 1521-396X, URL http://dx.doi.org/10.1002/pssa.2210900102.
- Hofmann et al. (2002) D. M. Hofmann, A. Hofstaetter, F. Leiter, H. Zhou, F. Henecker, B. K. Meyer, S. B. Orlinskii, J. Schmidt, and P. G. Baranov, Phys. Rev. Lett. 88, 045504 (2002), URL http://link.aps.org/doi/10.1103/PhysRevLett.88.045504.
- Meyer et al. (2005) B. K. Meyer, J. Sann, D. M. Hofmann, C. Neumann, and A. Zeuner, Semicond. Sci. Technol. 20, S62 (2005), URL http://stacks.iop.org/0268-1242/20/i=4/a=008.
- Hohenberg and Kohn (1964) P. Hohenberg and W. Kohn, Phys. Rev. 136, B864 (1964), URL http://link.aps.org/doi/10.1103/PhysRev.136.B864.
- Kohn and Sham (1965) W. Kohn and L. J. Sham, Phys. Rev. 140, A1133 (1965), URL http://link.aps.org/doi/10.1103/PhysRev.140.A1133.
- Perdew et al. (1996) J. P. Perdew, K. Burke, and M. Ernzerhof, Phys. Rev. Lett. 77, 3865 (1996), URL http://link.aps.org/doi/10.1103/PhysRevLett.77.3865.
- (32) Quantum ESPRESSO, www.quantum-espresso.org.
- Schröer et al. (1993) P. Schröer, P. Krüger, and J. Pollmann, Phys. Rev. B 47, 6971 (1993), URL http://link.aps.org/doi/10.1103/PhysRevB.47.6971.
- Jaffe et al. (2000) J. E. Jaffe, J. A. Snyder, Z. Lin, and A. C. Hess, Phys. Rev. B 62, 1660 (2000), URL http://link.aps.org/doi/10.1103/PhysRevB.62.1660.
- Lim et al. (2012) L. Y. Lim, S. Lany, Y. J. Chang, E. Rotenberg, A. Zunger, and M. F. Toney, Phys. Rev. B 86, 235113 (2012), URL http://link.aps.org/doi/10.1103/PhysRevB.86.235113.
- Wei and Zunger (1988) S.-H. Wei and A. Zunger, Phys. Rev. B 37, 8958 (1988), URL http://link.aps.org/doi/10.1103/PhysRevB.37.8958.
- Zhou et al. (2007) G. Zhou, L. Sun, X. Zhong, X. Chen, L. Wei, and J. Wang, Phys. Lett. A 368, 112 (2007), ISSN 0375-9601, URL http://www.sciencedirect.com/science/article/pii/S03759601070%04781.
- Dong et al. (2004) C. L. Dong, C. Persson, L. Vayssieres, A. Augustsson, T. Schmitt, M. Mattesini, R. Ahuja, C. L. Chang, and J.-H. Guo, Phys. Rev. B 70, 195325 (2004), URL http://link.aps.org/doi/10.1103/PhysRevB.70.195325.
- Ley et al. (1974) L. Ley, R. A. Pollak, F. R. McFeely, S. P. Kowalczyk, and D. A. Shirley, Phys. Rev. B 9, 600 (1974), URL http://link.aps.org/doi/10.1103/PhysRevB.9.600.
- Vesely and Langer (1971) C. J. Vesely and D. W. Langer, Phys. Rev. B 4, 451 (1971), URL http://link.aps.org/doi/10.1103/PhysRevB.4.451.
- Ma et al. (2013) X. Ma, Y. Wu, Y. Lv, and Z. Y., J. Phys. Chem. C 117, 26029 (2013).
- Agapito et al. (2015) L. A. Agapito, S. Curtarolo, and M. Buongiorno Nardelli, Phys. Rev. X 5, 011006 (2015), URL http://link.aps.org/doi/10.1103/PhysRevX.5.011006.
- Karzel et al. (1996) H. Karzel, W. Potzel, M. Köfferlein, W. Schiessl, M. Steiner, U. Hiller, G. M. Kalvius, D. W. Mitchell, T. P. Das, P. Blaha, et al., Phys. Rev. B 53, 11425 (1996), URL http://link.aps.org/doi/10.1103/PhysRevB.53.11425.
- Lany et al. (2008) S. Lany, H. Raebiger, and A. Zunger, Phys. Rev. B 77, 241201 (2008), URL http://link.aps.org/doi/10.1103/PhysRevB.77.241201.
- Badaeva et al. (2009) E. Badaeva, C. M. Isborn, Y. Feng, S. T. Ochsenbein, D. R. Gamelin, and X. Li, J. Phys. Chem. C 113, 8710 (2009), URL http://pubs.acs.org/doi/abs/10.1021/jp900392j.
- Kittilstved et al. (2006) K. R. Kittilstved, W. K. Liu, and D. R. Gamelin, Nature Materials 5, 291 (2006), URL http://www.nature.com/nmat/journal/v5/n4/full/nmat1616.html.
- not (b) We have also checked that the integration of Mn level energies over fractional occupancies in the range between 0 and 1 reproduces the exact results for absorption, in accordance with Janak’s theorem Janak (1978), while the approximation by the midpoint value (occupancy 1/2) gives an error lower than 0.2 eV.
- Janak (1978) J. F. Janak, Phys. Rev. B 18, 7165 (1978), URL http://link.aps.org/doi/10.1103/PhysRevB.18.7165.
- Toyoda et al. (2006) M. Toyoda, H. Akai, K. Sato, and H. Katayama-Yoshida, Physica B: Condens. Matter 376-377, 647 (2006).
- Raebiger et al. (2009) H. Raebiger, S. Lany, and A. Zunger, Phys. Rev. B 79, 165202 (2009), URL http://link.aps.org/doi/10.1103/PhysRevB.79.165202.
- Chanier et al. (2009) T. Chanier, F. Virot, and R. Hayn, Phys. Rev. B 79, 205204 (2009), URL http://link.aps.org/doi/10.1103/PhysRevB.79.205204.
- Janotti et al. (2006) A. Janotti, D. Segev, and C. G. Van de Walle, Phys. Rev. B 74, 045202 (2006), URL http://link.aps.org/doi/10.1103/PhysRevB.74.045202.
- Volnianska et al. (2014) O. Volnianska, T. Zakrzewski, and P. Boguslawski, J. Chem. Phys. 141, 114703 (2014), URL http://scitation.aip.org/content/aip/journal/jcp/141/11/10.10%63/1.4895790.
- Zakrzewski and Boguslawski (2016) T. Zakrzewski and P. Boguslawski, Journal of Alloys and Compounds 664, 565 (2016), ISSN 0925-8388, URL http://www.sciencedirect.com/science/article/pii/S09258388153%20478.