Sub-Story Detection in Twitter with Hierarchical Dirichlet Processes
Abstract
Social media has now become the de facto information source on real world events. The challenge, however, due to the high volume and velocity nature of social media streams, is in how to follow all posts pertaining to a given event over time – a task referred to as story detection. Moreover, there are often several different stories pertaining to a given event, which we refer to as sub-stories and the corresponding task of their automatic detection – as sub-story detection. This paper proposes hierarchical Dirichlet processes (HDP), a probabilistic topic model, as an effective method for automatic sub-story detection. HDP can learn sub-topics associated with sub-stories which enables it to handle subtle variations in sub-stories. It is compared with state-of-the-art story detection approaches based on locality sensitive hashing and spectral clustering. We demonstrate the superior performance of HDP for sub-story detection on real world Twitter data sets using various evaluation measures. The ability of HDP to learn sub-topics helps it to recall the sub-stories with high precision. Another contribution of this paper is in demonstrating that the conversational structures within the Twitter stream can be used to improve sub-story detection performance significantly.
keywords : sub-story detection, hierarchical Dirichlet process, spectral clustering, locality sensitive hashing
1 Introduction
Online social networks play a major role in generating and disseminating information. They provide a platform for people to voice their opinion and viewpoints. Moreover, social media provide main stream media, governments, companies, and citizens the opportunity to obtain real time information about events happening around the world. The challenge, however, due to the high volume and velocity nature of social media streams, is in how to follow all posts pertaining to a given event over time – a task referred to as story detection [Petrović et al., 2010].
Story detection is a specific form of Topic Detection and Tracking (TDT) [Allan, 2002], which is concerned with discovering posts pertaining to real-world stories as they unfold over time. This paper, in particular, is concerned with tracking event-related posts within the micro-blogging social network, Twitter.
When considering posts related to a given real-world event (e.g. the Ferguson unrest), researchers (e.g. [Zubiaga et al., 2016, Procter et al., 2013]) have found that there are often different sub-stories pertaining that event (e.g. ‘Ferguson police shot Brown’, ‘Ferguson police confiscated all video evidence’). In this paper we address the question how such substories can be identified automatically. This is particularly beneficial for mainstream media, governments, law enforcing agencies, companies, and other organisations who are increasingly faced with the challenge of tracking and responding to emerging sub-stories, rumours, and misinformation.
Automatic sub-story detection is a harder task than story detection as sub-stories on the same event have a lot of vocabulary in common. For instance, all the posts related to the Ferguson unrest share words such as ‘Ferguson’, ‘police’, ‘Brown’. Sub-stories tend to overlap considerably in time and are often associated with low tweet rates. Also, they are not necessarily true (e.g. different rumours emerged simultaneously during the England riots [Procter et al., 2013]) and thus may not have a corresponding sub-story in the real world. Standard story detection (also known as event detection) approaches fail to take these into account and do not perform well on sub-story detection task.
This paper investigates a sub-story detection approach based on hierarchical Dirichlet processes (HDP). This hierarchical topic model can detect sub-topics associated with a main topic and is thus well suited to the sub-story detection task. For instance, in the Ferguson unrest example, the approach can detect ‘Ferguson police’ as the main topic, while ‘shot Brown’ and ‘video evidence’ as different sub-topics. The effectiveness of the proposed approach is established by comparing it with state-of-the-art story detection approaches based on locality sensitive hashing (LSH) [Petrović et al., 2010] and spectral clustering (SC) [Preotiuc-Pietro et al., 2013] (see Section 6 for details).
Sub-story detection in Twitter streams is particularly challenging, since reply tweets often do not share sufficient vocabulary with the tweets they reply to. For instance, in one of the tweet data set used for experiments here [Zubiaga et al., 2016], there is a sub-story claiming that Fox News is not covering the Ferguson protests. In particular, one of the earlier tweets has text ‘Currently the #FoxNews website has zero, repeat, ZERO coverage of the #Ferguson protests’. A subsequent reply tweet, however, states “Too busy bitching about POTUS for sure”, i.e. does not mention neither Ferguson, nor Fox News explicitly. Since many reply tweets exhibit similar lack of linguistic overlap with the originating tweet, this makes it difficult to cluster them as pertaining to the same sub-story cluster. To address this problem, our approach takes into account the conversational structure, in addition to linguistic features, in order to improve sub-story detection performance.
Sub-story detection performance is evaluated on real world Twitter data sets. Twitter is ideal for this task because it provides a large source of publicly available posts on major events, e.g. the 2014 Ferguson unrest and the 2011 London riots. In particular, we experiment with five different Twitter data sets. Three of these arise from rumour detection research [Zubiaga et al., 2016, Procter et al., 2013] and come annotated with events (2011 London riots, the 2014 Ferguson unrest, and the 2014 Ottawa shooting) and tweets grouped by sub-story within each of the events. The fourth public data set was created for first story detection (FSD) with Locality Sensitive Hashing (LSH), which is one of our baselines [Petrović et al., 2010]. The fifth public data set (FAcup [Aiello et al., 2013]) contains tweets about various events occuring during a football match. The properties of the data sets are discussed further in Section 5 and comparative evaluation results for all methods and data sets are detailed in Section 7.
We propose to use a mutual information based evaluation measure, adjusted mutual information (AMI) [Vinh et al., 2009], in addition to the standard precision-recall metrics which avoids agreements by chance by considering the number of clusters produced. The experimental results establish the superior performance of HDP for sub-story detection task. The approach could detect sub-story specific topics which helps journalists and government agencies to monitor the evolution of new topics associated with a story. The runtime performance of HDP is comparable to established story detection approaches and can be used to perform real-time detection of sub-stories.
The main contributions of the paper are summarized as follows:
-
•
Introduces the sub-story detection task and proposes a hierarchical Dirichlet process based approach to solve the problem of sub-story detection.
-
•
Provides rigorous experimental comparison of the proposed sub-story detection approach with state-of-the-art story detection approaches, establishing the effectiveness of HDP for sub-story detection.
-
•
Proposes a mutual information based metric for evaluating the performance of sub-story detection approaches.
-
•
Demonstrates the usefulness of conversational structure in improving sub-story detection performance.
2 Related Work
A number of techniques have been employed for detecting and tracking stories in social media streams [Allan, 2002]. Story detection is typically done by extending traditional clustering algorithms to a streaming data setting [Aggarwal, 2014]. A comprehensive survey of the literature on story detection techniques in Twitter data is given in [Farzindar and Wael, 2015].
Clustering approaches were traditionally used to group data points with similar features [Jain et al., 1999]. Many of the classic clustering techniques such as K-means have been extended to a streaming data setting [Zhong, 2005, Aggarwal and Yu, 2010] and can be used to perform story detection [Aggarwal, 2014]. These algorithms aim to discover underlying groups within data by inferring a general representation to characterize the data in terms of a few key topics or stories.
Story detection in Twitter for a particular topic such as ‘earthquake’ is studied in [Sakaki et al., 2010]. Becket et al. [2011] use an online clustering algorithm to detect stories and distinguish real vs. non-real stories using a classification method. Twevent [Li et al., 2012] is a story detection approach which clusters bursty segments in Twitter data. A fast and efficient approach based on locality sensitive hashing (LSH) is first used in [Petrović et al., 2010] to detect the emergence of new stories (first story detection) in Twitter. Locality sensitive hashing reduced the computational complexity associated with nearest neighbor search and detected clusters of documents in constant space and time. Later, they extended this approach to counter lexical variations in documents by using paraphrases [Petrović et al., 2012]. An alternative approach to detect new events by storing the contents of already seen documents in a single hash table is proposed in [Wurzer et al., 2015b]. Further, LSH based techniques are also developed to handle topic streams emerging in Twitter [Wurzer et al., 2015a]. Here, topics are also hashed into a bucket in addition to the tweets.
Topic models are also used to detect stories in Twitter, for instance latent Dirichlet allocation (LDA) [Diao et al., 2012] to detect trending topics. A non-parametric topic model based on Dirichlet process is used in [Wang et al., 2013] to detect newsworthy stories in Twitter, where topics are shared among tweets from consecutive time periods. Topicsketch [Xie et al., 2013] uses a novel sketch based topic model to detect bursty topics from millions of tweets.
A spectral clustering based approach is developed in [Preotiuc-Pietro et al., 2016] to address the task of story detection. The approach uses a mutual information based metric to represent the similarity matrix in spectral clustering. Real world events happen at different scales of time and space. Multi-scale event detection [Dong et al., 2015] aims to detect stories evolving at different pace and spanning different geographic locations by using the properties of wavelet transform. Supervised machine learning techniques such as support vector machines and logistic regression are used to detect events corresponding to specific topics such as those related to traffic [D’Andrea et al., 2015], lifestyle and wellness [Akbari et al., 2016] and uprisings [Boecking et al., 2015]. These event detection techniques will not be able to distinguish different sub-stories associated with a main story due to content overlap.
Whilst story detection has received considerable attention, less attention has been paid to sub-story detection task. Aiello et al. [2013] discuss tasks similar to sub-story detection like finding important events happening over time in a main event such as a football match. They used standard story detection approaches to find events on their tasks. There exists approaches [Nichols et al., 2012, Zubiaga et al., 2012] which rely on tweet rates in an interval to detect major moments in a game. Chakrabarti and Punera [Chakrabarti and Punera, 2011] use a modified hidden Markov model combining tweet rate and text features to summarize events in a game. Shen et al. [2013] use a time-content mixture model which effectively combines burstiness and cohesiveness to detect key moments in a story. Chierichetti et al. [2014] use non-textual features based on tweet rate and communication pattern among users to detect points in time where an important event happens within a story. An approach based on graph-of-words to represent sequence of tweets was used in [Polykarpos et al., 2015] to detect important events happening within a football match. These approaches will not be effective for detecting sub-stories which overlaps considerably in time and have low tweet rates.
There exists a hitherto unaddressed problem – finding sub-stories related to a particular real world event. These sub-stories may or may not correspond to real-world events (e.g. false rumours about the London riots [Procter et al., 2013] do not), they tend to overlap in time (i.e. tweets on more than one sub-story circulate simultaneously), and share significant common vocabulary [Zubiaga et al., 2016]. As demonstrated in the rest of this paper, state-of-the-art approaches for story detection do not perform well on this type of task.
3 Research Objective
The following are our main research objectives:
-
1.
Introduce the task of sub-story detection in Twitter. Sub-story detection differs from story detection and we discuss the properties specific to sub-story detection which makes it a harder task than story detection.
-
2.
Propose hierarchical Dirichlet processes as an effective approach for sub-story detection. Unlike story detection approaches, HDP can learn sub-topics associated with sub-stories which makes it particularly useful for modeling sub-story detection task.
-
3.
Verify experimentally the effectiveness of HDP for sub-story detection task. We compare HDP with standard story detection approaches based on locality sensitive hashing and spectral clustering on real world Twitter data sets to establish the fitness of HDP for sub-story detection.
-
4.
Show the usefulness of conversational structure in Twitter for improving the performance of sub-story detection task. By considering conversational structure, reply tweets which does not share a topical similarity with the source tweets gets clustered along with the source tweet.
-
5.
Introduces adjusted mutual information score as an effective metric to measure clustering performance in sub-story detection. Standard metrics based on precision typically favor clustering approaches which produces large number of small sized clusters. Such clustering approaches are not useful in practice and we propose to use AMI as an effective alternative metric which can take care of such problems.
4 Problem Definition : Sub-Story Detection
This paper addresses the problem of detecting sub-stories as they emerge in social media streams. Automatic sub-story detection methods need to separate tweets related to different sub-stories into different clusters, even though they pertain to the same real-world event.
Sub-story detection differs from a story detection in that sub-stories share some common vocabulary and the tweet rates for the sub-stories are comparatively low. Table 1 shows 8 major sub-stories related to the Ferguson unrest from one of our five data sets. All these sub-stories are related to the shooting of M. Brown by the Ferguson police and thus share words such as ‘M. Brown’, ‘Ferguson’, ‘police’ etc. Standard story detection approaches fail to produce good results in this setting where vocabulary is shared across the sub-stories because they look at tweet similarity or overlaping words to cluster tweets.
| Sub-story id | Description | # tweets | # source |
|---|---|---|---|
| 1 | M. Brown was involved in a robbery before being shot | 2312 | 89 |
| 2 | Initial contact between police officer and M. Brown was not related to the robbery | 553 | 28 |
| 3 | Ferguson police to release name of police officer who shot M. Brown today (August 15) | 536 | 26 |
| 4 | Ferguson police are leading a smear campaign or character assassination of M. Brown | 623 | 18 |
| 5 | Ferguson police once beat up a man and charged him for bleeding on their uniforms | 369 | 24 |
| 6 | Ferguson police are lying about the circumstances leading up to M. Brown’s death | 426 | 23 |
| 7 | M. Brown was stopped by police for walking in the middle of the street | 236 | 10 |
| 8 | Fox News is not covering the Ferguson protests | 102 | 2 |
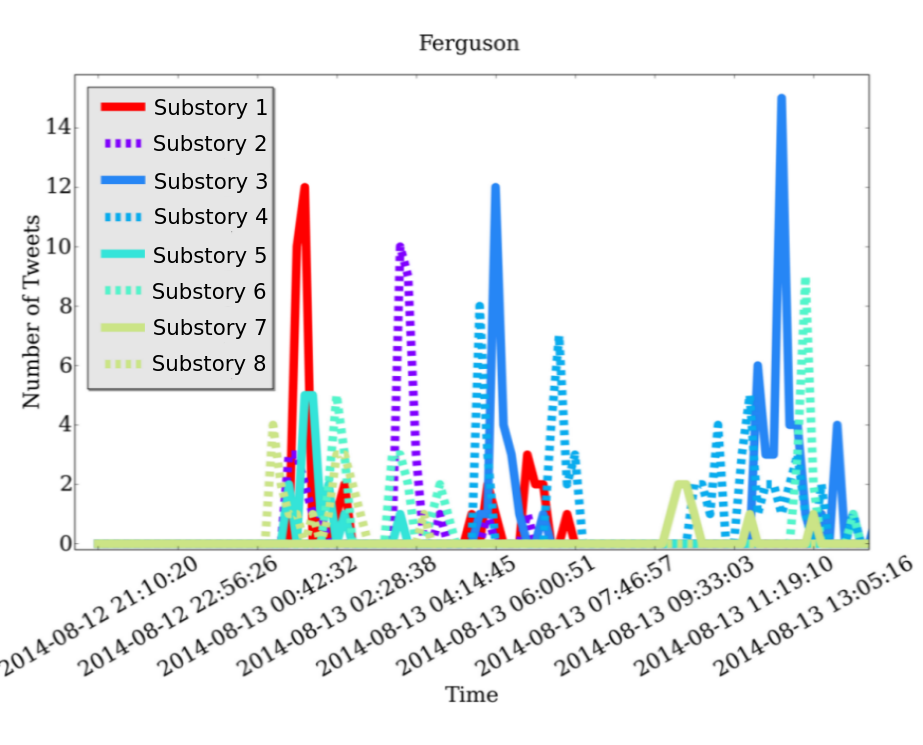
Sub-stories can have considerably larger lifespan, overlap in time, and are set within a broader over-arching story, that contains many thematically related sub-stories. The themes discussed in these sub-stories are referred to as sub-topics. For example, consider the temporal profile of sub-stories from the Ferguson data shown in Figure 1. 111These sub-stories are not the same as those listed in Table 1. We can observe that these sub-stories overlap in time and have relatively low tweet rate. This is mainly due to the fact that there are multiple conversations within a sub-story, each evolving at a different point in time. A sub-story which becomes active at some point in time can become dormant temporarily and then re-activate again at a later time (for instance, consider the temporal behavior of sub-stories 1 and 3 in Figure 1).
5 Data Set Description
The core of our experiments are carried out on three sub-story annotated data sets (Ferguson unrest, Ottawa shooting and London riots). The first two are very recent and have been collected and human annotated as part of a rumour analysis project [Zubiaga et al., 2016], while the London riots one arose from an earlier qualitative social science analysis of related tweets [Procter et al., 2013]. All three data sets consist of tweets, grouped together into human annotated sub-stories related to the particular real-world event. Other tweets pertaining to the same event count as background data.
We also consider two other publicly available data sets, FSD and FAcup, which have been created for story detection. Even though these data sets are not strictly suitable to the sub-story detection task, we use them for comparative purposes and have vocabulary overlap across some sub-stories.
Next we describe these data sets in more detail.
5.1 Ferguson
This data set consists of tweets collected between August and September 2014, all related to the unrest that took place in Ferguson, USA [Zubiaga et al., 2016]. This data set is not only sub-story annotated, but also includes “reply-to” information, which connects together subsets of tweets into conversational graphs. We refer to reply tweets as those that reply to a tweet present in the data set, and source tweets as all those which do not have such a “parent”. In other words, the data set is regarded as a collection of conversational threads, each of which has a single source tweet at its root.
As detailed in [Zubiaga et al., 2016], journalists categorised manually source tweets as belonging to one of 45 different sub-stories. A reply tweet is assumed automatically to belong to the sub-story to which its source tweet has been assigned (if any).
After discounting sub-stories with fewer than 10 tweets, the final data set consists of 6,598 labeled tweets spread across 35 sub-stories and 18,650 tweets as background, i.e. not belonging to any of those sub-stories. Considering source tweets alone, there are 284 labeled source tweets and 899 background source tweets. Table 1 lists major sub-stories in the data [Zubiaga et al., 2016], illustrating how the sub-stories are very similar and have the Ferguson unrest as a common topic.
5.2 Ottawa
The Ottawa data set consists of tweets related to shootings at the parliament building in Ottawa during October 2014 [Zubiaga et al., 2016]. Similar to the Ferguson data, it also has a conversational structure including source and reply tweets. The data set consists of 6,414 tweets spread across 39 sub-stories and 5,975 tweets as background.
Considering source tweets alone, there are 462 labeled tweets and 439 background tweets. Some major sub-stories associated with the Ottawa shooting event are ‘Soldier shot dead is Nathan Cirillo’, ‘Soldier shot at War Memorial has died’, ‘Suspected shooter is dead’, etc. All these sub-stories have a common theme of shooting and death which makes them an ideal candidate for the sub-story detection task. With respect to temporal patterns, the evolution of sub-stories is very similar to the patterns observed in the Ferguson data.
5.3 London Riots
The London riots data set consists of 2.5 million tweets related to the riots that took place in London during August, 2011 [Procter et al., 2013]. It includes 10,000 tweets that are labeled as belonging to 7 different sub-stories, all with a common background topic – the London riots. Table 2 provides a summary of number of tweets in each sub-story in this data set. Unlike Ferguson and Ottawa, the conversational structure was not made available by the researchers.
| Sub-story id | Description | # tweets |
|---|---|---|
| 1 | Army deployed in Bank | 192 |
| 2 | Rioters attack children’s hospital | 1666 |
| 3 | London Eye set on fire | 657 |
| 4 | Rioters cook food in McDonalds | 218 |
| 5 | Miss Selfridge set on fire | 5581 |
| 6 | Police beat girl | 902 |
| 7 | Rioters attack London zoo | 937 |
5.4 First Story Detection
This is a publicly available story detection data set [Petrović et al., 2012] with approximately 2,400 tweets labeled as belonging to 27 stories, from the period June to September 2011. This is augmented with background tweets from the same period, to create a corpus of approximately 80,000 tweets. Originally this data set was created by Petrović et al. [2012] for evaluation of their first story detection (FSD) system. This FSD data set can be seen to represent the standard story detection task, in contrast to the sub-story task represented by the former three data sets. It should be noted, however, that there is some overlap of stories here as well, e.g. four of the stories are related to the London riots in 2011 and another four are about death of some celebrities. These commonalities make this data also applicable to sub-story detection, as well as enabling us to benchmark our methods on the related story detection problem.
5.5 FAcup
This is a publicly available data set [Aiello et al., 2013] with approximately 7,000 tweets belonging to 13 different sub-stories associated with a football match story. These tweets represents sub-stories such as goals, fouls etc. in the 2012 Football Association (FA) final match between Chelsea and Liverpool. This data set is augmented with approximately 20,000 tweets related to the same football match as background. Due to the shared common story (football game), sub-story tweets in this data set share a common vocabulary and is useful for evaluating the proposed sub-story detection approach. However, they differ from sub-story data sets such as Ferguson and Ottawa in that the sub-stories in this data set are temporally separated.
6 Methods
The main sub-story detection method investigated in this paper uses hierarchical topic modeling. In particular, we experiment with hierarchical Dirichlet processes (HDP), a non-parametric Bayesian model, which can effectively model the sub-story detection task. HDP is also compared to two story detection state-of-the-art approaches: spectral clustering and locality sensitive hashing.
6.1 Hierarchical Dirichlet Process
Latent Dirichlet allocation (LDA) [Blei et al., 2003] and hierarchical Dirichlet processes (HDP) [Teh et al., 2006] have shown promising results in topic modeling due to their probabilistic interpretations. They model a document (i.e. tweet in our case) as a mixture of topics, where each topic has a distinct distribution over the words. These generative models can infer the latent topics associated with the tweets.
In this paper we propose to use HDP for sub-story detection, since it can model the hierarchical structure underlying the topic distribution. As argued above, in sub-story detection we need to find sub-topics associated with the main story (e.g. the Ferguson unrest), and HDP is developed specifically to handle such kinds of tasks. HDP achieves this by extending the Dirichlet process mixture model (DPMM) [Murphy, 2012] to a hierarchical setting.
In more detail, the DPMM considers a tweet as consisting of words generated by a mixture of topics. The mixture distribution is modeled using a non-parametric prior based on a Dirichlet process (DP) [Hjort et al., 2010]. A DP is parameterized by a base distribution and a concentration parameter and is denoted as . The base measure specifies the a-priori distribution over some parameter space which is used to generate observed data.
In our case, represents the parameters of a multinomial distribution over the words in a tweet. A draw from is a discrete probability measure providing a distribution over . It can be represented as , where is the Kronecker delta function which gives a value of when the parameter takes value , is a draw from and is the probability mass associated with . The sequence of values is obtained from using a stick breaking process [Sethuraman, 1994]
| (1) |
The process ensures that represents a probability distribution i.e. and is often represented as . The concentration parameter determines the probability mass associated with a topic as a parameter in Beta distribution. A draw from results in with probability , with representing the parameters of a multinomial distribution associated with a topic . Thus each topic occurs in a tweet with probability . Modeling tweets independently as a DPMM does not allow topics to be shared across tweets, which is needed in our task.
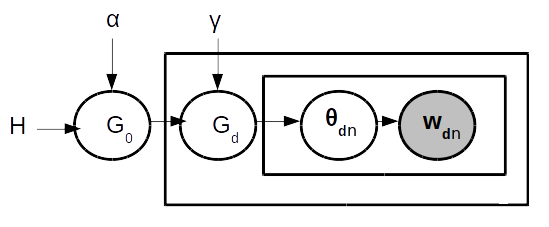
Hierarchical Dirichlet processes are developed to handle grouped data and share topics across the groups [Teh et al., 2006]. We use them to model the tweet as consisting of a set of topics and to share topics across multiple tweets. HDP achieves this by drawing tweet specific probability distribution for a tweet from , where represents the concentration parameter and is the base distribution shared by all the tweets. The common base distribution is indeed a draw from . The common base distribution has the form and the tweet specific distribution has the form . Here, both the common base distribution and tweet specific distributions share the parameters (or the topics) with tweet specific mixture distribution over the topics. Thus, the tweets modeled using HDP share the topics but with different probabilities. The mixing proportions is generated as follows [Teh et al., 2006]
| (2) |
Figure 2 shows the graphical model representation of the HDP model. A word in a tweet comes from a topic with parameter drawn from the Dirichlet Process associated with the tweet. The topics are shared across the tweets due to the hierarchical modeling of DPMM.
Since in sub-story detection tweets relate to the same real world event, HDP can model this effectively, coupled with the fact that individual tweets address different sub-topics (corresponding to the sub-stories). These sub-topics are characterized by words and each word is associated with a probability indicating the importance of the word in representing the sub-topic. The identified sub-topics are used to cluster tweets based on the words common in the tweet and the sub-topics. For each tweet, we detect common words and calculate a similarity score to a sub-topic by summing the probability associated with these words in representing the sub-topic. The tweet is assigned to the sub-topic with the maximum similarity score. We use sub-topics for clustering the tweets as they can better discriminate the tweets associated with sub-stories.
6.2 Spectral Clustering
Clustering techniques have been used widely to detect stories in social data streams [Aggarwal, 2014]. Here, we discuss one based on spectral clustering using point-wise mutual information [Preotiuc-Pietro et al., 2013]. The spectral clustering (SC) algorithm [Shi and Malik, 2000] has been shown to achieve the state-of-the-art performance for tasks such as community detection in graphs [Smyth and White, 2005]. This method treats clustering as a graph partitioning problem. It projects the objects into a lower dimensional space by performing singular value decomposition of a similarity graph constructed over the objects. It then discovers clusters of objects which are maximally separated in this space using standard clustering techniques, such as k-means. A good spectral clustering relies on a good similarity graph which best reflects the connections between objects.
We apply spectral clustering to detect sub-stories in a stream of tweets [Preotiuc-Pietro et al., 2013]. The approach represents a similarity graph by constructing a matrix which captures the similarity over words that appear in the data. It uses normalized point-wise mutual information (NPMI) [Bouma, 2009] to capture the word similarity. NPMI measures the probability of co-occurrence of words in the same tweet. The idea is that if two words appear consistently in the same tweet, then they are indicative of the same story. For example, the co-occurrence of words such as ‘Ferguson’ and ‘police’ over a period of time indicate there is a story related to Ferguson police.
The NPMI measure between words pairs and is calculated as
| (3) |
where denotes the probability of occurrence of a word in a tweet, and provides the probability of co-occurrence of words and in a tweet. We consider two words as co-occuring if they appear in the same tweet, which gives us a straightforward measure of co-occurence frequencies. The NPMI measure takes values between and with positive values indicating a higher chance of co-occurrence and negative value indicating a lower chance of co-occurrence.
The spectral clustering algorithm proceeds by filtering out less frequent words and constructing a similarity graph over words using the NPMI measure. It ignores all NPMI values less than a threshold and keeps the largest connected component from the resulting graph. Singular value decomposition is performed over a graph Laplacian constructed from this similarity graph to obtain a representation of words in a lower dimensional space. A k-means algorithm then finds clusters of words in this reduced space.
The word clusters discovered by the spectral clustering algorithm represents a coherent topic. The words are associated with a score, which provides a measure of importance of the word in representing the topic. For each tweet, a similarity score is computed with respect to each topic, using the co-occurence score of the words in the tweet. The tweets are then clustered by assigning them to the topic with the highest similarity score. Thus, tweets in the same cluster form a topically coherent cluster.
6.3 Locality Sensitive Hashing
The second state-of-the-art approach is locality sensitive hashing (LSH) [Rajaraman and Ullman, 2011], which was proposed originally for first story detection in Twitter [Petrović et al., 2010]. LSH finds nearest neighbour tweets in constant time and keeps only a constant number of tweets in memory.
The LSH approach uses the nearest neighbour algorithm to find the tweet closest to the incoming tweet. The computational overhead of finding the nearest neighbor is overcome using locality sensitive hashing. LSH maps incoming tweets to buckets using a hashing function which maps similar tweets to the same bucket. The method then finds the nearest neighbour to the incoming tweet by searching the bucket to which it has been mapped. This greatly reduces the search space. The approach clusters tweets based on the cosine similarity of the tweets which are hashed into the same bucket. It assigns an incoming tweet to the cluster of its nearest neighbour if the cosine similarity is greater than a particular threshold. Otherwise, it assigns the tweet to a new cluster.
In more detail, LSH uses a series of random hyperplanes sampled from a normal Gaussian distribution. These hyperplanes divide the space into subspaces and similar tweets fall into the same subspace. We consider such hyperplanes. The number of hyperplanes can be considered as a number of bits per key in this hashing scheme. Let represent the hyperplanes and be the tf-idf representation of the tweet. The hash value is considered to be a binary vector with bits. We set the bit to be 1 if and 0 otherwise. The tweets falling in the same subspace have the same hash value in the hash table and is stored in a bucket of size . The higher is, the fewer collisions there will be in the buckets, but more time will be needed to compute the hash values. However, increasing k also decreases the probability of collision with the nearest neighbor, and hence multiple hash tables () are required to increase the chances of finding the nearest neighbor. Thus, a tweet is compared with the tweets belonging to the same bucket in multiple hash tables in order to find its nearest neighbor using cosine similarity. The nearest neighbor tweets with cosine similarity below a user specified threshold forms a cluster. This cluster represents tweets with some topical similarity, which helps one to detect stories evolving in Twitter.
7 Experimental Results
This section reports on the comparative evaluation of HDP and all state-of-the-art baselines on the sub-story detection data sets. We follow a cluster-based approach, as it accounts for the varying popularity of sub-stories and the related user endorsement aspect. This also provides a fair comparison with LSH. Alongside this, we also consider an event extraction setting where major sub-stories detected by HDP and SC are described in terms of detected topics222Please note that LSH does not assign topics to sub-stories, due to the nature of the algorithm.. Results are reported using the standard metrics of precision, recall, F-score and adjusted mutual information [Vinh et al., 2009]. The latter is included as it has certain advantages over the others with respect to cluster evaluation.
In particular, the experiments compare Hierarchical Dirichlet processes (HDP), spectral clustering (SC) and locality sensitive hashing (LSH) on the data sets introduced in Section 5 (Ferguson, Ottawa, London riots, FSD, and FA Cup).
The text of each tweet is pre-processed to remove unusual characters, tokens, and stop words, followed by stemming. In particular, the filtered tokens are: user-mentions (tokens starting with @), hashtags (words starting with #) and URLs. The rationale behind hashtag removal is that hashtags often tend to refer to the shared real world event (e.g. #Ferguson, #Londonriots) and are thus shared across sub-stories.
7.1 Method Comparison using Precision, Recall and F-score
Our first comparative evaluation experiment uses the standard information retrieval metrics of precision and recall [Manning et al., 2008]. Detected tweet clusters are evaluated against the gold standard tweets in the respective sub-stories. Since the approaches are unsupervised, the number of automatically discovered clusters does not always align to the sub-stories in the gold standard. Therefore, for each sub-story, we find the automatically produced cluster with the maximum overlap, in terms of number of tweets from that sub-story. It should be noted that multiple sub-stories may get aligned to a single cluster. In this case, precision measures how many of the retrieved tweets belong to the actual sub-story, while recall measures whether the system could retrieve all known tweets associated with the aligned sub-story. Performance is reported using micro-averaged precision and recall, due to the varying sizes of each sub-story (in terms of number of contained tweets).
More formally, let be the total number of known sub-stories in a given data set. , , and are the true positives, false positives, and false negatives associated with a sub-story . Then, micro-averaged precision and recall are calculated as:
| (4) | |||
| (5) |
We also report micro-averaged F-score, which is the harmonic mean of micro-averaged precision and recall. Approaches with a high F-score are preferred.
| (6) |
The free HDP parameters (e.g. the concentration parameters) are learnt from the data using Gibbs sampling. We put an upper bound on the number of topics produced by HDP () and this allows for a fair comparison with SC. The effective number of topics could be less and is determined by the concentration parameter learnt from the data.The spectral clustering approach depends primarily on the parameter , which determines the number of clusters in the data set. The approach is run by filtering out words with an NPMI threshold of 0.1 and with word frequency threshold of 10. We perform experiments with different values of for HDP and SC. Lastly, the LSH approach depends on the parameters (number of bits), (number of hash tables) , and (bucket size). The experiments are conducted with different values of these parameters. We present only the results obtained with the best two parameter settings (in terms of F-score) for each of the approaches.
As can be seen in Table 3, HDP is the best performing method on the Ferguson and Ottawa sub-story data sets. In particular, HDP’s F-score is significantly better than the SC and LSH F-scores. With respect to precision, LSH performs best, while SC has the best recall. The low recall of LSH, however, is due to the fact that it generates a large number of very small tweet clusters, which is also the reason for its high precision. On the other hand, SC is not able to differentiate sufficiently between similar sub-stories and groups them together in a small number of very large clusters. While this increases recall, it leads to the observed low precision. In contrast, HDP can detect subtle differences in sub-stories, thanks to the sub-topics, which are then used to cluster the tweets. This leads to improved precision for HDP over SC and an ultimately higher F-score.
| Ferguson | Ottawa | |||||
|---|---|---|---|---|---|---|
| Method | ||||||
| HDP (k200) | 0.0536 | 0.0889 | 0.0668 | 0.1799 | 0.1431 | 0.1594 |
| HDP (k300) | 0.1366 | 0.1057 | 0.1191 | 0.2182 | 0.1249 | 0.1588 |
| SC (k400) | 0.0131 | 0.1622 | 0.0242 | 0.0519 | 0.1821 | 0.0807 |
| SC (k2000) | 0.0422 | 0.0861 | 0.0566 | 0.0873 | 0.1244 | 0.1025 |
| LSH (k12h56b10) | 0.3441 | 0.0301 | 0.0554 | 0.4797 | 0.0314 | 0.0589 |
| LSH (k13h71b10) | 0.3430 | 0.0407 | 0.0728 | 0.3768 | 0.0285 | 0.0529 |
Next, Table 4 reports the experimental results on the much larger London riots data set. The methods here are executed by partitioning the data set into 50 sub-partitions with approximately 50,000 tweets in each. The table shows the number of clusters per partition for the HDP and SC approaches. As above, HDP has the best recall and F-score, while LSH has the highest precision.
| London Riots | |||
|---|---|---|---|
| Method | |||
| HDP (k50) | 0.4188 | 0.2759 | 0.3326 |
| HDP (k100) | 0.4194 | 0.2013 | 0.2720 |
| SC (k50) | 0.1833 | 0.2666 | 0.2172 |
| SC (k100) | 0.4522 | 0.2539 | 0.3252 |
| LSH (k12h56b10) | 0.5948 | 0.2258 | 0.3273 |
| LSH (k13h71b10) | 0.4976 | 0.2323 | 0.3167 |
Nevertheless, it should be noted that precision, recall and F-score are still very low on the Ferguson and Ottawa data sets, which is due to the presence of conversational threads within the sub-story clusters. As discussed in Section 1, some of the tweets within the conversational tweets tend to discuss completely unrelated topics. For instance, even if the source tweet mentions the sub-story explicitly, often reply tweets within the thread do not have significant word overlap with the source. Consequently, these reply tweets are not deemed topically similar to the source tweet and are assigned to a completely different cluster, which negatively impacts performance.
7.1.1 Conversational Structure Experiments
The effect of reply tweets in lowering the performance of the system is verified by conducting clustering experiments on the Ferguson and Ottawa data sets, using source tweets alone. As can be seen in Table 5, algorithm performance improves significantly, compared to the results reported in Table 3. In some cases, the improvement in performance is by an order of magnitude. Again we observe that HDP outperforms both LSH and SC, with similar precision and recall patterns as those observed in the full data sets.
| Ferguson | Ottawa | |||||
|---|---|---|---|---|---|---|
| HDP (k200) | 0.2578 | 0.3042 | 0.2790 | 0.4615 | 0.4172 | 0.4382 |
| HDP (k300) | 0.3482 | 0.3688 | 0.3582 | 0.4212 | 0.5248 | 0.4673 |
| SC (k400) | 0.0508 | 0.3691 | 0.0893 | 0.1574 | 0.3055 | 0.2077 |
| SC (k2000) | 0.1614 | 0.2617 | 0.1996 | 0.1373 | 0.3055 | 0.1894 |
| LSH (k12 h56 b10) | 0.6083 | 0.2402 | 0.3444 | 0.6417 | 0.2603 | 0.3703 |
| LSH (k13 h71 b10) | 0.5591 | 0.2508 | 0.3462 | 0.6975 | 0.2451 | 0.3627 |
The next experiment considers the sub-story assignment of entire conversational threads. The first step is to cluster only the source tweets, while reply tweets are assigned automatically to the cluster of their corresponding source tweet. This is a realistic setting on these data sets, and on unseen Twitter data in general, since the source-reply structure is readily available.
Table 6 shows that considering conversational threads achieves an order of magnitude improvement in recall and F-score, as compared to those in Table 3. Again, we observe that LSH has better precision, while HDP has better recall, and ultimately HDP has the best F-score.
This experiment also considered an additional baseline, which clusters tweets using only the conversational structure. By design, this approach has a precision of 1. The aim here is to investigate whether the sub-story detection approaches can get better recall, than this readily available baseline. This is indeed the case, as shown in Table 6. In particular, the simple baseline has a recall of and for Ferguson and Ottawa respectively, which is lower than the recall of the three other methods.
| Ferguson | Ottawa | |||||
|---|---|---|---|---|---|---|
| Method | ||||||
| HDP (k200) | 0.273 | 0.3674 | 0.3132 | 0.4749 | 0.4612 | 0.4679 |
| HDP (k300) | 0.3822 | 0.4199 | 0.4001 | 0.4398 | 0.5691 | 0.4968 |
| SC (k400) | 0.0722 | 0.4091 | 0.1227 | 0.1786 | 0.3581 | 0.2383 |
| SC (k2000) | 0.2149 | 0.3034 | 0.2515 | 0.1588 | 0.3143 | 0.2109 |
| LSH (k12 h56 b10) | 0.5589 | 0.3087 | 0.3977 | 0.5428 | 0.3038 | 0.3895 |
| LSH (k13 h71 b10) | 0.5079 | 0.3106 | 0.3854 | 0.7777 | 0.2877 | 0.4200 |
In order to investigate variation in method performance across individual sub-stories, 3 major sub-stories are selected at random in the Ferguson and Ottawa data sets. As can seen in Table 7, performance patterns for LSH, SC, and HDP remain unchanged, i.e. LSH has the best precision, while HDP – the best recall and F-score. The latter is able to find most of the tweets associated with sub-stories with a good precision.
| Ferguson | |||||||||
| Sub-story 1 | Sub-story 2 | Sub-story 3 | |||||||
| Method | P | R | F | P | R | F | P | R | F |
| HDP (k300) | 0.96 | 0.26 | 0.41 | 0.45 | 0.40 | 0.42 | 0.59 | 0.74 | 0.66 |
| SC (k400) | 0.32 | 0.26 | 0.28 | 0.16 | 0.19 | 0.17 | 0.23 | 0.29 | 0.26 |
| LSH (k12h56b10) | 0.99 | 0.16 | 0.28 | 1 | 0.17 | 0.29 | 0.31 | 0.26 | 0.28 |
| Ottawa | |||||||||
| Sub-story 1 | Sub-story 2 | Sub-story 3 | |||||||
| Method | P | R | F | P | R | F | P | R | F |
| HDP (k300) | 0.99 | 0.65 | 0.78 | 0.82 | 0.66 | 0.73 | 0.46 | 0.47 | 0.46 |
| SC (k400) | 0.95 | 0.27 | 0.42 | 0.15 | 0.31 | 0.20 | 0.11 | 0.28 | 0.16 |
| LSH (k13h71b10) | 0.99 | 0.44 | 0.61 | 1 | 0.15 | 0.26 | 0.4 | 0.16 | 0.23 |
7.1.2 Performance on FSD data
The next experiment compares the methods on the publicly available FSD story detection data set (see Table 8). As before, LSH has very high precision but low recall. HDP and SC outperform LSH in recall, while HDP precision is better than that obtained for SC. Thus, again HDP has the highest F-score.
Similar to the sub-story data sets, LSH produces very small clusters, which split the tweets belonging to a particular story across multiple threads resulting in higer precision but low recall. For instance in the case of the story on ‘Death of Amy Winehouse’ with 726 tweets, the corresponding LSH cluster contains 109 tweets mostly from that story. The precision for this story is thus , while recall is only .
In the FSD data, we observed that LSH produced around 1500 clusters in total, after ignoring clusters with fewer than 3 tweets. Spectral clustering, on the other hand, tends to cluster together tweets from related stories, resulting in few large story clusters. For example, some of the tweets from the two stories (‘Death of Amy Winehouse’ and ‘Betty Ford dies’) are put into the same cluster. In the case of ‘Death of Amy Winehouse’, the corresponding SC cluster has 821 tweets, with precision and recall. This is mainly due to SC clustering words rather than messages, and thus merging sub-stories sharing common vocabulary.
HDP provides a more balanced result with comparatively higher precision and recall. It is a more fine grained approach which can distinguish subtle differences in various stories, due to the hierarchical modeling of the topics with some shared vocabulary. In the case of ‘Death of Amy Wine house’, the corresponding HDP cluster has 660 tweets with precision and recall.
| FSD | |||
|---|---|---|---|
| Method | |||
| HDP (k200) | 0.3181 | 0.7765 | 0.4523 |
| HDP (k300) | 0.3558 | 0.7549 | 0.4863 |
| SC (k200) | 0.1564 | 0.7683 | 0.2598 |
| SC (k400) | 0.1529 | 0.5406 | 0.2383 |
| LSH (k12h56b10) | 0.9792 | 0.2279 | 0.3697 |
| LSH (k13h71b10) | 0.8128 | 0.2428 | 0.3739 |
In conclusion, this experiment has demonstrated that HDP performs very well also on story detection data sets and tasks.
7.1.3 Performance on FAcup Data
The publicly available FAcup data set is used to study the behavior of the story detection approaches. The data exhibits properties similar to Ferguson and Ottawa since all the tweets belongs to a common main event, i.e. a football match, which makes it a challenging task for the three methods.
Table 9 compares the performance HDP, SC, and LSH on the FAcup data. The methods struggle to separate the tweets into the different sub-story clusters, which leads to lower precision. Broadly speaking, the results obtained on the FACup data are similar to those reported in Table 3 on the sub-story detection data sets. Again, HDP outperforms LSH and SC, thanks to superior recall and F-score, while LSH maintains the best precision.
| FAcup | |||
|---|---|---|---|
| Method | |||
| HDP (k100) | 0.1441 | 0.1683 | 0.1552 |
| HDP (k200) | 0.3023 | 0.1438 | 0.1949 |
| SC (k400) | 0.0582 | 0.0947 | 0.0721 |
| SC (k1000) | 0.1281 | 0.0875 | 0.1039 |
| LSH (k12h56b10) | 0.4975 | 0.0881 | 0.1496 |
| LSH (k13h71b10) | 0.4992 | 0.0979 | 0.1636 |
7.1.4 Discussion
The experiments presented above demonstrated that LSH generally produces a large number of clusters with high precision but low recall. For instance, on the London riots data set, it produced around 45,000 clusters. In contrast, HDP and SC achieve similar performance with only 2500 and 5000 clusters, respectively.
In general, LSH tends to create numerous very small clusters (mostly containing re-tweets), which explains its very high precision. On the other hand, SC tends to cluster together similar categories, which lowers precision. HDP distinguishes subtle topical differences, resulting in more balanced precision and recall. Another noteworthy observation is that, in general, increasing the number of clusters in HDP and SC leads to improved precision but at the cost of recall. Thus, depending on application needs, HDP and SC make it possible to trade off some recall for better precision.
With respect to the metrics used above, precision, recall and F-score do not penalize methods, such as LSH, which produce a large number of small clusters, and thus the corresponding F-score is often high due to their high precision. Such methods, however, are not useful in practice as an user has to navigate over a large number of clusters, in search of important sub-stories. Therefore, in our final experiment we use adjusted mutual information (AMI) [Vinh et al., 2009], which takes cluster size and cluster numbers into account. The improvement in clustering quality due to HDP is clearly visible also with adjusted mutual information, which corrects for agreement by chance due to a larger number of clusters.
7.2 Adjusted Mutual Information Experiments
The information theoretic, adjusted mutual information measure (AMI) [Vinh et al., 2009] is used to evaluate cluster quality. In prior work, information theoretic measures, such as mutual information, have been shown as being well suited to comparing the performance of clustering approaches [Banerjee et al., 2005, Meilǎ, 2005]. These measures are theoretically grounded and provide a better evaluation of cluster quality.
Mutual information (MI) between two clustering (true clustering of tweets) and (generated clustering of tweets) quantifies the information shared among them and provides the reduction in uncertainty on upon observing . The MI score between and , is computed as
| (7) |
Here, is the probability that tweets belong to cluster , – the probability that tweets belong to cluster , and – the probability that tweets belong to both clusters and . When clusters are identical, MI score takes a higher value upper bounded by , where is the entropy of cluster . If the clusters are disjoint, MI score is close to zero. One can also use a normalized MI (NMI) score, which normalizes the MI score to be between zero and one.
The shortcoming of the MI and NMI scores, however, is that they do not correct for clusters that occur by chance. They do not have a constant baseline value, i.e. the average value obtained for a random clustering of the data [Vinh et al., 2009]. Consequently, these scores tend to be higher for results with larger number of clusters, or when the ratio of the total number of data points to number of clusters is small. In particular, they would produce a high score for an approach, which categorizes each tweet into a separate cluster.
Therefore, in our experiments we consider adjusted mutual information (AMI) [Vinh et al., 2009], which is corrected for chance by subtracting the expected mutual information score from both the numerator and denominator of the normalized mutual information score. The AMI score is calculated as follows
| (8) |
Table 10 and Table 11 provide the AMI scores obtained by HDP, SC and LSH on the different data sets. As can seen, HDP has the best performance, as measured by its AMI score. In this case, we also note that SC demonstrated improved performance and tends to be better than LSH on most data sets. As expected, the AMI score penalizes the LSH algorithm, which produces a very large number of clusters, since the expected mutual information score grows as the number of clusters increases.
| Method | Ferguson | Ottawa | FSD | FAcup |
| HDP (k100) | 0.46 | 0.59 | 0.70 | 0.10 |
| HDP (k200) | 0.46 | 0.55 | 0.67 | 0.11 |
| HDP (k300) | 0.47 | 0.60 | 0.65 | 0.10 |
| SC (k200) | 0.40 | 0.39 | 0.65 | 0.07 |
| SC (k400) | 0.38 | 0.43 | 0.45 | 0.07 |
| SC (k2000) | 0.39 | 0.42 | 0.31 | 0.08 |
| LSH (k12 h56 b10) | 0.40 | 0.46 | 0.23 | 0.08 |
| LSH (k13 h71 b10) | 0.40 | 0.47 | 0.24 | 0.09 |
| Method | LondonRiots |
|---|---|
| HDP (k25) | 0.32 |
| HDP (k50) | 0.31 |
| HDP (k100) | 0.29 |
| SC (k50) | 0.31 |
| SC (k100) | 0.31 |
| SC (k200) | 0.28 |
| LSH (k12 h56 b10) | 0.29 |
| LSH (k13 h71 b10) | 0.30 |
7.3 Topic detection
Since HDP and SC are topic based and can describe a cluster through key terms, this is not the case for LSH. Therefore, in this section we examine topics within sub-stories, as identified automatically by these two methods.
In particular, Table 12 shows 5 major topics learnt by HDP and SC from the Ferguson data. We found that HDP learns topics corresponding to major stories in the Ferguson data set. For instance, Topic 1, Topic 2 and Topic 3 correspond to Story 1, Story 7 and Story 3 in the Ferguson data set, described in Table 1. The first two topics detected by SC correspond to Story 5 and Story 3 of the Ferguson data.
| HDP | SC | ||
|---|---|---|---|
| Shared | police, ferguson | Shared | None |
| Topic 1 | suspect, robbery, brown, mike, officer, involved | Topic 1 | beat, charged, man, property, uniforms |
| Topic 2 | officer, darren, wilson, shot, brown, michael | Topic 2 | brown, darren, michael, officer, shot, wilson |
| Topic 3 | chief, stopped, robbery, says, street, walking | Topic 3 | law, live, militarized, state, town, victim |
| Topic 4 | charged, beat, man, bleeding, uniforms, property, destruction | Topic 4 | before, boy, community, dogs, fergusonshooting |
| Topic5 | store, video, stills, surveillance, robbery, brown, release, michael | Topic 5 | mike, name, release, police |
7.4 Runtime Efficiency
We study the runtime of different approaches on the data sets and check their practical usability. Table 13 provide runtime comparisons of HDP, LSH and SC approaches on different data sets. The algorithms are run on a Linux computer having 4 core Intel CPU with 3.40 GHz speed and 16 GB RAM. In terms of run time, the performance of all the approaches are comparable in Ferguson, Ottawa, FSD and FAcup. In the case of London riots, LSH is found to have relatively higher runtime.
| Method | LondonRiot | Ferguson | Ottawa | FSD | FAcup |
| HDP | 2 hours | 196 seconds | 55 seconds | 661 seconds | 188 seconds |
| SC | 1.5 hours | 183 seconds | 52 seconds | 550 seconds | 128 seconds |
| LSH | 4 hours | 151 seconds | 35 seconds | 511 seconds | 152 seconds |
8 Discussion and Implications
Social networks such as Twitter provide real time information on various events happening around the world. Sub-story detection in Twitter provides news agencies and government organizations the ability to track the evolution of various stories associated with a main story. For instance, it helps journalists to detect various stories associated with U.S. presidential elections and government to track stories arising around natural disasters such as earthquakes. The proposed approach based on HDP could detect accurately most of the sub-stories associated with a main story in real time. It will be useful for news agencies and governments to more accurately track the evolution of sub-stories and take appropriate remedial measures. The sub-topics learnt by HDP from the Twitter helps humans to understand the content of sub-stories without actually inspecting them. It also avoids the need to have a separate algorithm to summarize the contents of the sub-stories.
We take into account the conversational structure in Twitter which allows our model to more accurately track the evolution of sub-stories. By observing the rate of growth of sub-stories, one could decide which among the lot of sub-stories require immediate attention. This is particularly useful in applications such as rumour detection where early detection of rumour is important. Categorizing the conversational tweets also into the cluster of the source tweet serves another purpose in this scenario. They help in debugging the truthfulness of a rumour mentioned in the source tweet. For instance, the presence of words such as ‘incorrect’ and ‘unbelievable’ in the reply tweets often indicate that the topic mentioned in the source tweet is not true.
We provide a better measure to evaluate clustering quality in sub-story detection by using adjusted mutual information. We observed that standard story detection approaches such as LSH when applied to sub-story detection task, produced a large number of small sized highly accurate clusters. Standard metrics based on precision favor such clustering approaches but they may not be useful in practice. Though F-score consider recall as well, very high precision often leads to a good F-score. AMI takes into account number of clusters produced by the approach and penalizes those which produces large number of clusters. By correcting agreement between clusters due to chance, AMI measure better reflects the clustering quality of the approaches. We proposed to use it for comparing the quality of clusters produced in the sub-story detection task. HDP performed far better than other approaches in terms of AMI score which makes it an ideal candidate for sub-story detection.
9 Conclusion
This paper introduced the sub-story detection task, which differs from the previously studied story detection task. Secondly, we proposed a probabilistic topic model (hierarchical Dirichlet processes (HDP)) for automatic sub-story detection. HDP performs hierarchical modeling of topics and is effective in modeling sub-stories by learning sub-topics associated with the common topic of the shared real-world event.
HDP performance was compared against spectral clustering and locality sensitive hashing on several sub-story detection and story detection data sets. In general, we found that SC provides good recall, while LSH provides good precision. HDP, on the other hand, was found to have balanced precision and recall and achieves the best F-scores on all data sets. This demonstrates that HDP can handle effectively the subtle differences in sub-stories, which leads to an improved clustering performance. The superior performance of HDP is substantiated further by evaluating cluster quality via adjusted mutual information.
Lastly, our experiments also demonstrated that considering the conversational structure of tweet threads significantly improved performance of the sub-story detection approaches.
Future work will address the task of automatic sub-story ranking, which will enable users, such as journalists or emergency responders, to identify and focus on the most important sub-stories within a large volume of tweets surrounding major world events.
Acknowledgements
We would like to thank Dr. Trevor Cohn for his helpful suggestions. The work is partially supported by the European Union, under grant agreement No. 611233 PHEME.
References
- [Aggarwal, 2014] Aggarwal, C. C. (2014). Mining text and social streams: A review. SIGKDD Explor. Newsl., 15:9–19.
- [Aggarwal and Yu, 2010] Aggarwal, C. C. and Yu, P. S. (2010). On clustering massive text and categorical data streams. Knowl. Inf. Syst., 24:171–196.
- [Aiello et al., 2013] Aiello, L. M., Petkos, G., Martin, C., Corney, D., Papadopoulos, S., Skraba, R., Goker, A., Kompatsiaris, I., and Jaimes, A. (2013). Sensing trending topics in Twitter. (99):1.
- [Akbari et al., 2016] Akbari, M., Hu, X., Nie, L., and Chua, T. (2016). From tweets to wellness: Wellness event detection from twitter streams. In Proceedings of the Thirtieth AAAI Conference on Artificial Intelligence, February 12-17, 2016, Phoenix, Arizona, USA., pages 87–93.
- [Allan, 2002] Allan, J. (2002). Topic detection and tracking. chapter Introduction to Topic Detection and Tracking, pages 1–16. Kluwer Academic Publishers, Norwell, MA, USA.
- [Banerjee et al., 2005] Banerjee, A., Dhillon, I. S., Ghosh, J., and Sra, S. (2005). Clustering on the unit hypersphere using von mises-fisher distributions. J. Mach. Learn. Res., 6:1345–1382.
- [Blei et al., 2003] Blei, D. M., Ng, A. Y., and Jordan, M. I. (2003). Latent dirichlet allocation. J. Mach. Learn. Res., 3:993–1022.
- [Boecking et al., 2015] Boecking, B., Hall, M., and Schneider, J. (2015). Event prediction with learning algorithms—a study of events surrounding the egyptian revolution of 2011 on the basis of micro blog data. Policy and Internet, 7(2):159–184.
- [Bouma, 2009] Bouma, G. (2009). Normalized (pointwise) mutual information in collocation extraction. In Proceedings of the Biennial GSCL Conference.
- [Chakrabarti and Punera, 2011] Chakrabarti, D. and Punera, K. (2011). Event summarization using tweets. In Proc. 6th AAAI Int. Conf. on Weblogs and Social Media.
- [Chierichetti et al., 2014] Chierichetti, F., Kleinberg, J., Kumar, R., Mahdian, M., and Pandey, S. (2014). Event detection via communication pattern analysis. In International AAAI Conference on Web and Social Media.
- [D’Andrea et al., 2015] D’Andrea, E., Ducange, P., Lazzerini, B., and Marcelloni, F. (2015). Real-time detection of traffic from twitter stream analysis. IEEE Transactions on Intelligent Transportation Systems, 16(4):2269–2283.
- [Diao et al., 2012] Diao, Q., Jiang, J., Zhu, F., and Lim, E.-P. (2012). Finding bursty topics from microblogs. In Proceedings of the Association for Computational Linguistics (ACL), pages 536–544.
- [Dong et al., 2015] Dong, X., Mavroeidis, D., Calabrese, F., and Frossard, P. (2015). Multiscale event detection in social media. Data Min. Knowl. Discov., 29(5):1374–1405.
- [Farzindar and Wael, 2015] Farzindar, A. and Wael, K. (2015). A survey of techniques for event detection in twitter. Computational Intelligence, 31(1):132–164.
- [Hjort et al., 2010] Hjort, N. L., Holmes, C., Müller, P., and Walker, S. G. (2010). Bayesian nonparametrics. Cambridge University Press, Cambridge, New York.
- [Jain et al., 1999] Jain, A. K., Murty, M. N., and Flynn, P. J. (1999). Data clustering: a review. ACM Comput. Surv., 31:264–323.
- [Li et al., 2012] Li, C., Sun, A., and Datta, A. (2012). Twevent: Segment-based event detection from tweets. In Proceedings of the 21st ACM International Conference on Information and Knowledge Management (CIKM), pages 155–164.
- [Manning et al., 2008] Manning, C. D., Raghavan, P., and Schütze, H. (2008). Introduction to Information Retrieval. Cambridge University Press, New York, NY, USA.
- [Meilǎ, 2005] Meilǎ, M. (2005). Comparing clusterings: An axiomatic view. In Proceedings of the 22Nd International Conference on Machine Learning, ICML ’05, pages 577–584, New York, NY, USA. ACM.
- [Murphy, 2012] Murphy, K. P. (2012). Machine learning: A Probabilistic Perspective. The MIT Press.
- [Nichols et al., 2012] Nichols, J., Mahmud, J., and Drews, C. (2012). Summarizing sporting events using twitter. In Proceedings of the 2012 ACM International Conference on Intelligent User Interfaces, IUI ’12, pages 189–198.
- [Petrović et al., 2010] Petrović, S., Osborne, M., and Lavrenko, V. (2010). Streaming first story detection with application to twitter. In The 2010 Annual Conference of the North American Chapter of the Association for Computational Linguistics:Human Language Technologies, pages 181–189.
- [Petrović et al., 2012] Petrović, S., Osborne, M., and Lavrenko, V. (2012). Using paraphrases for improving first story detection in news and twitter. In Proceedings of the 2012 Conference of the North American Chapter of the Association for Computational Linguistics: Human Language Technologies, pages 338–346.
- [Polykarpos et al., 2015] Polykarpos, M., Giannis, N., Francois, R., Yannis, S., and Michalis, V. (2015). Degeneracy-based real-time sub-event detection in twitter stream. In International AAAI Conference on Weblogs and Social Media.
- [Preotiuc-Pietro et al., 2013] Preotiuc-Pietro, D., Samangooei, S., Lampos, V., Cohn, T., Gibbins, N., and Niranjan, M. (2013). Clustering models for discovery of regional and demographic variation. Technical report, Public Deliverable for Trendminer Project.
- [Preotiuc-Pietro et al., 2016] Preotiuc-Pietro, D., Srijith, P. K., Hepple, M., and Cohn, T. (2016). Studying the temporal dynamics of word co-occurrences: An application to event detection. Language Resources and Evaluation Conference.
- [Procter et al., 2013] Procter, R., Crump, J., Karstedt, S., Voss, A., and Cantijoch, M. (2013). Reading the riots: What were the police doing on twitter? Policing and society, 23(4):413–436.
- [Rajaraman and Ullman, 2011] Rajaraman, A. and Ullman, J. D. (2011). Mining of Massive Datasets. Cambridge University Press, New York, NY, USA.
- [Sakaki et al., 2010] Sakaki, T., Okazaki, M., and Matsuo, Y. (2010). Earthquake shakes twitter users: Real-time event detection by social sensors. In In Proceedings of the Nineteenth International WWW Conference (WWW2010). ACM.
- [Sethuraman, 1994] Sethuraman, J. (1994). A constructive definition of dirichlet priors. Statistica Sinica, 4:639–650.
- [Shi and Malik, 2000] Shi, J. and Malik, J. (2000). Normalized cuts and image segmentation. Pattern Anal. Mach. Intell., 22:888–905.
- [Smyth and White, 2005] Smyth, S. and White, S. (2005). In proceedings of the 5th siam international conference on data mining. Pattern Anal. Mach. Intell., pages 76–84.
- [Teh et al., 2006] Teh, Y. W., Jordan, M. I., Beal, M. J., and Blei, D. M. (2006). Hierarchical dirichlet processes. Journal of the American Statistical Association, 101:1566–1581.
- [Vinh et al., 2009] Vinh, N. X., Epps, J., and Bailey, J. (2009). Information theoretic measures for clusterings comparison: Is a correction for chance necessary? In Proceedings of the 26th Annual International Conference on Machine Learning, pages 1073–1080.
- [Wang et al., 2013] Wang, X., Zhu, F., Jiang, J., and Li, S. (2013). Real time event detection in twitter. In Wang, J., Xiong, H., Ishikawa, Y., Xu, J., and Zhou, J., editors, Web-Age Information Management, pages 502–513.
- [Wurzer et al., 2015a] Wurzer, D., Lavrenko, V., and Osborne, M. (2015a). Tracking unbounded topic streams. In Proceedings of the 53rd Annual Meeting of the Association for Computational Linguistics, pages 1765–1773.
- [Wurzer et al., 2015b] Wurzer, D., Lavrenko, V., and Osborne, M. (2015b). Twitter-scale new event detection via k-term hashing. In Empirical Methods in Natural Language Processing, pages 2584–2589.
- [Xie et al., 2013] Xie, W., Zhu, F., Jiang, J., Lim, E. P., and Wang, K. (2013). Topicsketch: Real-time bursty topic detection from twitter. In 13th International Conference on Data Mining, pages 837–846.
- [Zhong, 2005] Zhong, S. (2005). 2005 special issue: Efficient streaming text clustering. Neural Netw., 18:790–798.
- [Zubiaga et al., 2016] Zubiaga, A., Liakata, M., Procter, R., Wong Sak Hoi, G., and Tolmie, P. (2016). Analysing how people orient to and spread rumours in social media by looking at conversational threads. PLOS One.
- [Zubiaga et al., 2012] Zubiaga, A., Spina, D., Amigó, E., and Gonzalo, J. (2012). Towards real-time summarization of scheduled events from twitter streams. In Proceedings of the 23rd ACM Conference on Hypertext and Social Media, HT ’12, pages 319–320.