Supermode-Density-Wave-Polariton Condensation
Phase transitions, where observable properties of a many-body system change discontinuously, can occur in both open and closed systems. Ultracold atoms have provided an exemplary model system to demonstrate the physics of closed-system phase transitions, confirming many theoretical models and results Bloch et al. (2008). Our understanding of dissipative phase transitions in quantum systems is less developed, and experiments that probe this physics even less so. By placing cold atoms in optical cavities, and inducing strong coupling between light and excitations of the atoms, one can experimentally study phase transitions of open quantum systems. Here we observe and study a novel form of nonequilibrium phase transition, the condensation of supermode-density-wave-polaritons. These polaritons are formed from a hybrid “supermode” of cavity photons coupled to atomic density waves of a quantum gas. Because the cavity supports multiple photon spatial modes, and because the matter-light coupling can be comparable to the energy splitting of these modes, the composition of the supermode polariton is changed by the matter-light coupling upon condensation. These results, found in the few-mode-degenerate cavity regime, demonstrate the potential of fully multimode cavities to exhibit physics beyond mean-field theories. Such systems will provide experimental access to nontrivial phase transitions in driven dissipative quantum systems Gopalakrishnan et al. (2009, 2010); Diehl et al. (2010); Chang et al. (2013); Torre et al. (2013); Sieberer et al. (2013) as well as enabling the studies of novel non-equilibrium spin glasses and neuromorphic computation Gopalakrishnan et al. (2011); Strack and Sachdev (2011).
A striking manifestation of the role quantum mechanics can play in the physics of equilibrium phase transitions is the well-known Bose-Einstein-condensation (BEC) of bosonic particles at low temperatures into a single, macroscopically populated quantum wave. Condensation in quantum systems out of thermal equilibrium is far less understood Diehl et al. (2010); Sieberer et al. (2013), yet becoming experimentally relevant, especially via the study of polariton condensates. When matter couples strongly to light, new collective modes called polaritons arise. Condensation of these quasiparticles has been actively studied in the form of exciton-polaritons Kasprzak et al. (2006); Carusotto and Ciuti (2013). However, these exist in solid-state systems, so investigating critical behavior is complicated by effects of disorder and complex phonon-mediated relaxation. Embedding the exquisite control of ultracold atoms within open quantum-optical systems provides new avenues for experimentally studying quantum fluctuation-driven transitions and quantum criticality Gopalakrishnan et al. (2009, 2010); Diehl et al. (2010); Torre et al. (2013); Marino and Diehl (2016).
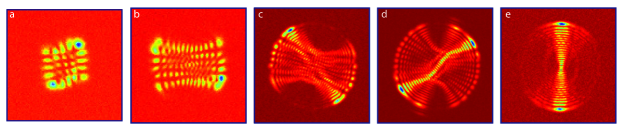
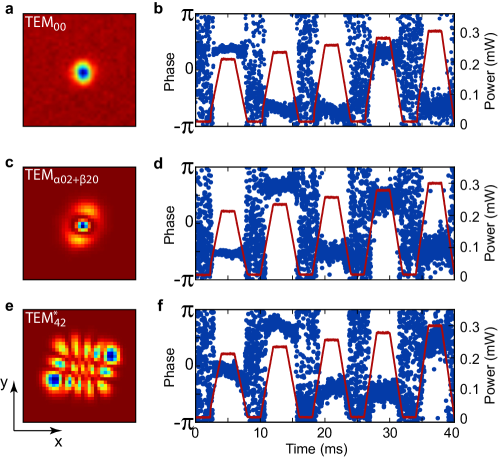
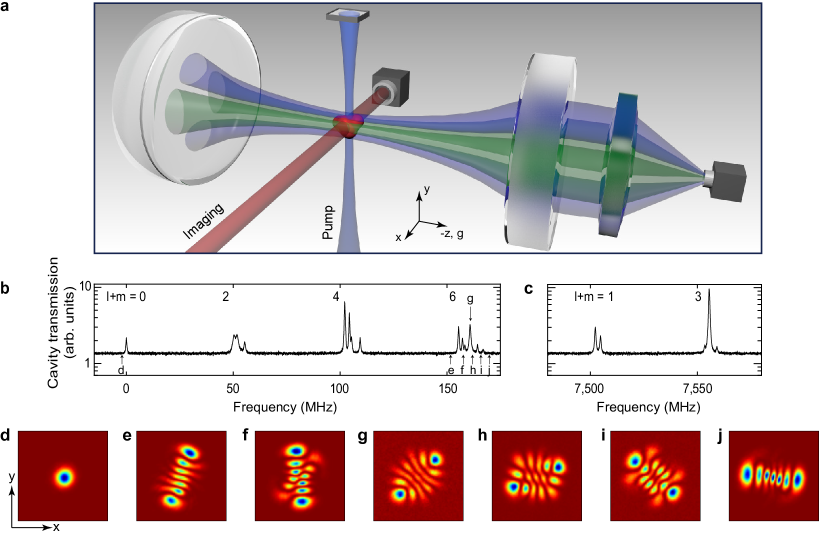
We report an important step in this direction, the observation of a new form of nonequilibrium condensation, a “supermode-density-wave-polariton” condensate. “Supermode” refers to the photonic part of a polaritonic dressed state comprised of multiple nearly degenerate cavity modes mixed by the intracavity atomic dielectric medium. The supermode-polariton dressed state is dependent on the pump-cavity detuning as well as on the overlap of the bare-cavity modes with the BEC position and shape. The matter component is an atomic density-wave (DW) excitation, rather than the electronic excitation of exciton-polariton condensates. When the atoms are pumped with a laser orthogonal to the cavity axis (see Fig. 1a), the normal modes of the atom-cavity system evolve to become supermode-DW-polaritons, new superpositions of supermodes mixed by the DW-fluctuations of the atoms. Above a critical pump threshold, a supermode-DW-polariton condenses, heralded by three observables: 1) superradiant emission of light from the cavity with the spatial pattern of one of these new supermodes; 2) -symmetry breaking of the phase of the cavity field, locking to either or with respect to the pump phase; and 3) organization of the BEC wavefunction into one of two checkerboard lattice configurations—each corresponding to either the or phase of the cavity field—but modified to accommodate the transverse spatial structure of the supermode. This can result in lattice defects (matter-wave phase slips) evident as a nontrivial structure factor in an atomic time-of-flight measurement. Observations of all these defining characteristics are presented.
With only a few modes coupled to the BEC (see Figs. 1b and 1c), the supermode-DW-polariton condensate arises in a regime intermediate between BECs coupled to a single-mode cavity and those coupled to a confocal or concentric cavity supporting many hundreds of degenerate modes. The organized state of a matter wave coupled to a single-mode cavity has been observed, but is uniquely defined by cavity geometry alone and is best described as a DW-polariton condensate Baumann et al. (2010); Nagy et al. (2010); Keeling et al. (2010); Ritsch et al. (2013). Aspects of this physics have been observed in thermal systems in which no DW-polariton condensation occurs: e.g., phase-locking of superradiant emission Domokos and Ritsch (2002); Black et al. (2003); Baden et al. (2014); supermode emission without self-organization Wickenbrock et al. (2013); superradiance Greenberg and Gauthier (2012); self-organization without superradiant emission Labeyrie et al. (2014). The Bose-Hubbard model with infinite-range interactions has been studied Klinder et al. (2015); Landig et al. (2016).
The near-confocal optical cavity employed here supports families of optical modes that each lie within a small frequency bandwidth, as shown in Figs. 1b and 1c (see Methods). One can observe the superradiant emission of various supermode-DW-polariton condensates by pumping at different tuned near or within a mode family, as can be seen in Figs. 1e through 1j. This is in contrast to the DW-polariton condensate of a single-mode cavity such as shown in Fig. 1d: This is not a supermode no matter the detuning near this isolated Gaussian mode. The supermodes in Figs. 1e through 1j differ from ideal Hermite-Gaussian modes due to three factors: 1) the bare cavity modes are themselves mixtures of ideal Hermite-Gaussian modes (due to mirror aberrations mixing modes when there is spectral overlap of modes near degeneracy) Siegman (1986); 2) these bare cavity modes are mixed by the dielectric atomic medium to form supermode-polaritons; 3) these dressed states are remixed by the emergent DW to form new supermodes above the polariton condensation threshold.
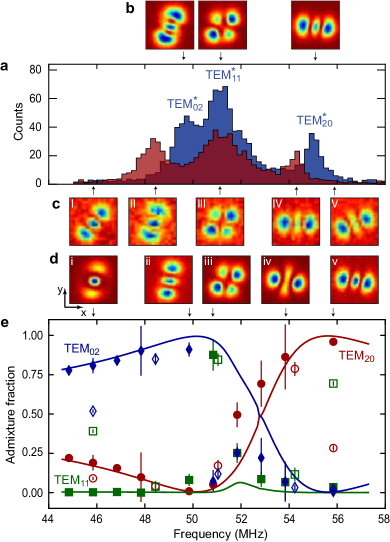
Figure 2 illustrates how remixed photonic components of the supermode-DW-polariton condensate can differ from the supermode-polariton dressed states. The three bare cavity modes of the family are mixed by a BEC at the cavity center to produce the three supermode peaks. The photonic component, shown in Fig. 2d, of the supermode-DW-polariton condensates can differ from that of the supermode-polaritons in Fig. 2c due to new supermode mixing by the macroscopically populated atomic DW above threshold. This is most pronounced away from resonance: see, e.g., how Fig. 2c.I and 2d.i differ: the supermode-DW-polariton condensate at 46 MHz (Fig. 2d.i) is approximately 81% TEM02 and 19% TEM20, while the associated below-threshold supermode-polariton (Fig. 2c.I) is approximately 52% TEM02, 9% TEM20 and 39% TEM11. The suppression of the TEM11 component above threshold can be understood as resulting from its poor overlap with the BEC, and thus weaker mixing with the DW mode. A similar remixing of supermodes occurs on the blue-detuned side at 56 MHz.
The components closely follow the theory prediction based on a linear stability analysis for mode content at condensation threshold, except near the TEM mode. We believe this discrepancy is due to dynamical effects not captured by this static stability analysis. See Methods and Extended Data Fig. 6 for discussion.
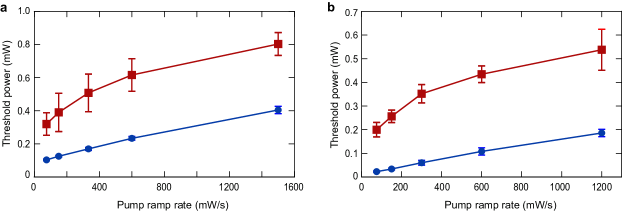
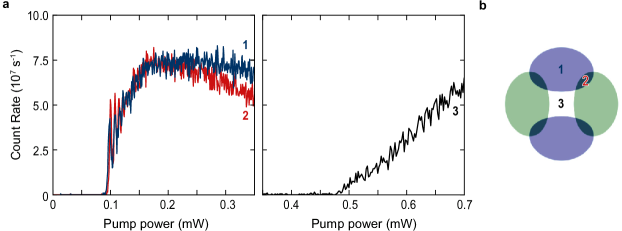
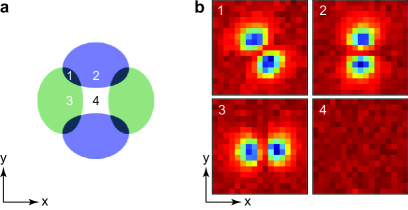
The position of the BEC with respect to the bare-cavity modes affects the photonic mode composition of the supermode-DW-polariton condensate. This is easily observed by moving the BEC within the transverse plane of the cavity with the pump tuned near the family (see Fig. 3). We pump the system with the BEC trapped by the optical dipole trap at each of the four intracavity positions illustrated in Fig. 3a. With the BEC trapped near either the antinode of the TEM10 or the TEM01 mode, we observe superradiant emission with a spatial pattern nearly identical to these bare-cavity modes, as shown in Fig. 3b at positions 2 and 3. However, a BEC at the intersection between the two modes’ antinodal lobes, position 1, yields an emitted spatial pattern at 45∘ to the bare cavity mode axes. The threshold for organization, shown in Extended Data Fig. 7, is the same for a BEC at a bare-cavity antinode or between the antinodes, demonstrating that the BEC has mixed these bare modes equally and has created a basis for supermode-DW-polaritons that are rotated 45∘ from the original family eigenbasis.
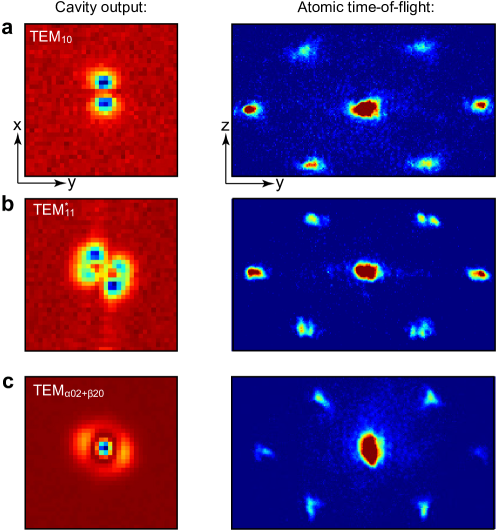
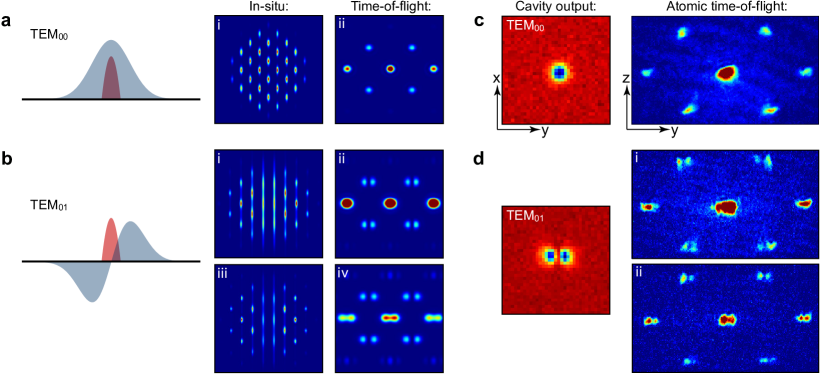
To complete the description of this novel non-equilibrium condensate, we report that observations of the momentum distribution in time-of-flight reveal the influence of the supermode structure on the matter wave component of the polariton condensate. For single-mode cavities pumped near the TEM00 mode, the atoms organise in one of two possible checkerboard patterns. However, organization in cavities supporting higher-order modes is more complicated. As illustrated in Figs. 4a and 4b, when the BEC overlaps with a node of the cavity mode, the effective DW–cavity mode coupling changes sign across the node because the DW couples to the interference between pump field and cavity mode. This results in an organized state with a plane defect in the checkerboard lattice: i.e., a phase slip, and we confirm this configuration to be the optimal organized state via open-system simulations of the pumped BEC-cavity system. See Fig. 4b.i and Methods.
Time-of-flight expansion of the atoms yields the atomic momentum distribution, and the lattice defect appears as a node in the Bragg peaks of the expanding BEC’s interference pattern; see simulation in Fig. 4b.ii. The node may be understood as a structure factor resulting from the low-momentum modulation of the organized atomic wavefunction caused by coupling to the transverse nodal structure of the supermode. The observability of a structure factor in the momentum distribution of BECs organized in orthogonally oriented and higher-order modes is shown in Extended Data Fig. 8.
Stronger pumping modifies the matter wavefunction by increasing the matter-light coupling nonlinearity, as may be seen by the emerging node at the center of the zeroth-order and Bragg peaks in Fig. 4d.ii. This distortion of the condensate wavefunction is similar to that which happens in dilute gas BECs upon increasing interaction energy. Lastly, we note that these supermode-DW-polariton condensates are observed to break the same -symmetry observed in single-mode DW-polariton condensates Domokos and Ritsch (2002); Black et al. (2003); Asbóth et al. (2005). Extended Data Fig. 9 presents measurements of pump-cavity field phase locking.
The demonstration of this novel phase in this few-mode-degenerate system paves the way for measurements of critical behavior in non-equilibrium quantum systems employing fully multimode cavity QED. This regime can be easily realized in our existing apparatus by tuning the cavity mirror spacing to confocality in situ Kollár et al. (2015). Multimode cavity QED, in the limit of “multimode collective ultra-strong coupling” wherein the collective coupling is larger than the bandwidth of the degenerate modes, strongly mixing them, should provide access to a much more exotic condensation transition. This fluctuation-induced 1st-order Brazovskii transition is predicted to yield a superfluid smectic-like quantum liquid crystalline order of the intracavity BEC Gopalakrishnan et al. (2009, 2010). This opens new avenues to study the interplay of quantum liquid crystallinity and unconventional superfluidity under controlled dimensionality and disorder Fradkin and Kivelson (2012) as well as the study of superfluid glasses and spin glasses Gopalakrishnan et al. (2009, 2010); Habibian et al. (2013), longstanding problems in statistical mechanics Fischer and Hertz (1991).
We thank S. Gopalakrishnan for stimulating discussions and J. Witmer, B. Pichler, and N. Sarpa for early experimental assistance. Funding was provided by the Army Research Office. B.L.L. acknowledges support from the David and Lucille Packard Foundation, and A.J.K. and A.T.P. acknowledge support the NDSEG fellowship program. J.K. acknowledges support from EPSRC program “TOPNES” (EP/I031014/1) and from the Leverhulme Trust (IAF-2014-025).
References
- Bloch et al. (2008) I. Bloch, J. Dalibard, and W. Zwerger, Rev. Mod. Phys. 80, 885 (2008).
- Gopalakrishnan et al. (2009) S. Gopalakrishnan, B. L. Lev, and P. M. Goldbart, Nat Phys 5, 845 (2009).
- Gopalakrishnan et al. (2010) S. Gopalakrishnan, B. L. Lev, and P. M. Goldbart, Phys. Rev. A 82, 043612 (2010).
- Diehl et al. (2010) S. Diehl, A. Tomadin, A. Micheli, R. Fazio, and P. Zoller, Phys. Rev. Lett. 105, 015702 (2010).
- Chang et al. (2013) D. E. Chang, J. I. Cirac, and H. J. Kimble, Phys. Rev. Lett. 110, 113606 (2013).
- Torre et al. (2013) E. G. D. Torre, S. Diehl, M. D. Lukin, S. Sachdev, and P. Strack, Phys. Rev. A 87, 023831 (2013).
- Sieberer et al. (2013) L. M. Sieberer, S. D. Huber, E. Altman, and S. Diehl, Phys. Rev. Lett. 110, 195301 (2013).
- Gopalakrishnan et al. (2011) S. Gopalakrishnan, B. L. Lev, and P. M. Goldbart, Phys. Rev. Lett. 107, 277201 (2011).
- Strack and Sachdev (2011) P. Strack and S. Sachdev, Phys. Rev. Lett. 107, 277202 (2011).
- Kasprzak et al. (2006) J. Kasprzak, M. Richard, S. Kundermann, A. Baas, P. Jeambrun, J. M. J. Keeling, F. M. Marchetti, M. H. Szymańska, R. André, J. L. Staehli, V. Savona, P. B. Littlewood, B. Deveaud, and L. S. Dang, Nature 443, 409 (2006).
- Carusotto and Ciuti (2013) I. Carusotto and C. Ciuti, Rev. Mod. Phys. 85, 299 (2013).
- Marino and Diehl (2016) J. Marino and S. Diehl, Phys. Rev. Lett. 116, 070407 (2016).
- Baumann et al. (2010) K. Baumann, C. Guerlin, F. Brennecke, and T. Esslinger, Nature 464, 1301 (2010).
- Nagy et al. (2010) D. Nagy, G. Kónya, G. Szirmai, and P. Domokos, Phys. Rev. Lett. 104, 130401 (2010).
- Keeling et al. (2010) J. Keeling, M. J. Bhaseen, and B. D. Simons, Phys. Rev. Lett. 105, 043001 (2010).
- Ritsch et al. (2013) H. Ritsch, P. Domokos, F. Brennecke, and T. Esslinger, Rev. Mod. Phys. 85, 553 (2013).
- Domokos and Ritsch (2002) P. Domokos and H. Ritsch, Phys. Rev. Lett. 89, 253003 (2002).
- Black et al. (2003) A. T. Black, H. W. Chan, and V. Vuletić, Phys. Rev. Lett. 91, 203001 (2003).
- Baden et al. (2014) M. P. Baden, K. J. Arnold, A. L. Grimsmo, S. Parkins, and M. D. Barrett, Phys. Rev. Lett. 113, 020408 (2014).
- Wickenbrock et al. (2013) A. Wickenbrock, M. Hemmerling, G. R. M. Robb, C. Emary, and F. Renzoni, Phys. Rev. A 87, 043817 (2013).
- Greenberg and Gauthier (2012) J. A. Greenberg and D. J. Gauthier, Phys. Rev. A 86, 013823 (2012).
- Labeyrie et al. (2014) G. Labeyrie, E. Tesio, P. M. Gomes, G.-L. Oppo, W. J. Firth, G. R. M. Robb, A. S. Arnold, R. Kaiser, and T. Ackemann, Nat. Photonics 8, 321 (2014).
- Klinder et al. (2015) J. Klinder, H. Keßler, M. R. Bakhtiari, M. Thorwart, and A. Hemmerich, Phys. Rev. Lett. 115, 230403 (2015).
- Landig et al. (2016) R. Landig, L. Hruby, N. Dogra, M. Landini, R. Mottl, T. Donner, and T. Esslinger, Nature 532, 476 (2016).
- Siegman (1986) A. E. Siegman, Lasers (University Science Books, 1986).
- Asbóth et al. (2005) J. K. Asbóth, P. Domokos, H. Ritsch, and A. Vukics, Phys. Rev. A 72, 053417 (2005).
- Kollár et al. (2015) A. J. Kollár, A. T. Papageorge, K. Baumann, M. A. Armen, and B. L. Lev, New J. Phys. 17, 043012 (2015).
- Fradkin and Kivelson (2012) E. Fradkin and S. A. Kivelson, Nat. Phys. 8, 864 (2012).
- Habibian et al. (2013) H. Habibian, A. Winter, S. Paganelli, H. Rieger, and G. Morigi, Phys. Rev. Lett. 110, 075304 (2013).
- Fischer and Hertz (1991) K. H. Fischer and J. A. Hertz, Spin Glasses (Cambridge University Press, 1991).
I Methods
Apparatus. We prepare a nearly pure 87Rb Bose-Einstein condensate (BEC) of atoms at the center of our cavity, confined in a crossed optical dipole trap (ODT) with trap frequencies Hz. The atoms are prepared in the state and a -G magnetic field is oriented along the -axis. The Thomas-Fermi radii of the BEC m are significantly smaller than the -m waist ( radius of the cavity field) of the TEM00 cavity mode. The crossed ODT is formed by a pair of -nm laser beams with waists and m intersecting at in the -plane. Acousto-optic modulators (AOMs) are used to stabilize the intensity of each ODT beam and control its position, allowing us to translate the BEC inside the cavity to control its overlap with the cavity modes.
The cavity is operated in a near-confocal regime in which the length is set to differ from the radius-of-curvature by m Kollár et al. (2015). The -cm-long cavity has a free-spectral range of GHz and a single-atom TEM00 cooperativity of : MHz and kHz. A weak -nm laser is used to stabilize the cavity length using the Pound-Drever-Hall method. Additionally, light from this laser is amplified and doubled to generate -nm light for the transverse pump and longitudinal probe beams. The wavelength of the locking laser is chosen to achieve a large atomic detuning of GHz between the pump and the -MHz-wide D2 line of 87Rb. An electro-optic modulator (EOM) placed in the path of the locking laser beam allows us to tune the detuning between the cavity modes and the pump or probe beams. The pump beam is polarized along and is focused down to a waist of m at the BEC and retro-reflected to create an optical lattice oriented along .
The cavity modes can be probed using a large, nearly flat longitudinal probe beam propagating along the axis of the cavity. This probe couples to all transverse modes of the low-order families. Reference Kollár et al. (2015) describes the design and vibration isolation of the length-adjustable cavity.
Measurements. The cavity output can be directed to three different detection channels. A single-photon counting module (SPCM) can record photon numbers via a multimode fiber coupled to the multimode cavity output. We measure a detection efficiency—from cavity output mirror to detector, including quantum efficiency and losses—of 10% for the low-order modes discussed here. The dispersive shift data in Fig. 2a is taken for an intracavity photon number much less than one and the same as for the rest of the data, GHz.
Superradiant emission from the cavity is observed by monitoring the cavity output on the SPCM. A sharp rise in intracavity photon number as the pump power is increased heralds the condensation transition. See Extended Data Fig. 7.
Alternatively, we can image the emission using an electron-multiplying CCD (EMCCD) camera in order to spatially resolve the transverse mode content of the cavity emission, though with no temporal resolution. All images of cavity emission are taken in a single experimental run (no averaging of shots with different BEC realizations) and with a camera integration time between and ms. The lower signal-to-noise in the images of Fig. 2c versus Fig. 2d is due to lower intracavity photon number. The images in Fig. 2b with no atoms present are taken with intracavity photon number well above unity. The pump power in Fig. 4d.ii is 70% larger than in Fig. 4d.i.
The phase difference between the cavity output and pump beam can be determined by performing a heterodyne measurement with a local oscillator beam Black et al. (2003). The data in Extended Data Fig. 9 has a frequency offset between pump and signal beams of MHz.
We calibrate the Rabi frequency of the transverse pump by measuring the depth of the pump lattice through Kapitza-Dirac diffraction of the BEC. With the cavity modes detuned far-off-resonance, we pulse the pump lattice onto the BEC for a time . The BEC is then released from the trap and the population of the diffracted orders at momenta is measured after a time-of-flight expansion. By fitting the measured to theory Denschlag et al. (2002), we extract a lattice depth , which allows us to determine the Rabi frequency of the pump.
The momentum distribution of the 87Rb cloud is measured by releasing the cloud from the trap and performing resonant absorption imaging after an expansion time ms. The appearance of Bragg peaks at in the atomic momentum distribution coincides with the onset of superradiant emission. All atomic time-of-flight images are taken in a single experimental run (no averaging of shots with different BEC realizations). The paired atomic absorption and cavity output images in Fig. 4c and in Extended Data Figs. 8a-c are each taken for the same experimental run. The cavity output image in Fig. 4d was taken for the same experimental run as the atomic absorption image in Fig. 4d.i.
We use the position dependence of the supermode-DW-polariton condensates (see Fig. 3) to place our BEC at the center of the cavity modes. The BEC is translated in the -plane using the AOMs of the two ODT beams. By monitoring the orientation of the superradiant emission as a function of BEC position, we are able to infer the displacement between the BEC and cavity center. Exploiting these effects allows us to position the BEC at the cavity center in both and directions to within 4 m.
Mode decomposition. We analyze the transverse mode content of the polaritons in the family by decomposing the cavity field into a superposition of unit-normalized, Hermite-Gaussian modes . This is achieved by fitting the EMCCD image to the function
| (1) |
with the mode magnitudes and phases determined as fit parameters. The waist and center positions of Hermite-Gaussians are determined from an image of the TEM00 cavity mode and are held fixed during the fit. Fixing the phase of the modes to allows the fitting algorithm to converge to a local optimum. Using the fitted values of , we extract admixture fractions
| (2) |
of the mode in the cavity output.
Model Hamiltonian. We model the coupled dynamics of the atomic wavefunction and cavity modes (where ) with the Hamiltonian
| (3) |
The first term represents the evolution of the cavity modes and second is the familiar Gross-Pitaevskii Hamiltonian for a weakly-interacting BEC trapped in a harmonic potential . The atomic contact interaction is accounted for in the term proportional to . In the regime of large atomic detuning , we can neglect the excited electronic state of the atom, and the atom-light interactions may be described solely through the dispersive light shifts. The cavity-atom interaction becomes
| (4) |
where is the spatially dependent, single-photon (vacuum) Rabi frequency for the cavity mode . Similarly for a pump field with a Rabi frequency , the atom-pump interaction is
| (5) |
The last term of Eq. 3 represents the light shift arising from the interference between the cavity and pump fields and is written as
| (6) |
Simulation of supermode composition at threshold.
To predict the location of threshold, and the nature of the supermode at that point, one may make use of a linear stability analysis, assuming a small occupation of the cavity modes and atomic density wave excitation. For the cavity mode, this is straightforward. For the atoms, this corresponds to assuming a condensate wavefunction
| (7) |
where are periodic eigenfunctions of the Mathieu equation, with eigenvalue , that is,
where and . These Mathieu functions describe the effects of the pump beam in the direction and do not assume a weak pump lattice. In the cavity direction, , the lattice is assumed weak, and so we only consider the first two modes, i.e., and . Since the above expression encapsulates all effects of the longitudinal coordinate, we will suppress the label on the transverse coordinates.
We must then solve coupled equations for the atomic transverse envelope functions and cavity mode amplitudes . To leading order in perturbation theory, the ground state envelope does not change, and so corresponds to the solution of the Gross-Pitaevskii equation:
| (8) |
where is the chemical potential and the number of atoms.
Mean-field equations of motion for the and are derived from the Hamiltonian in Eq. 3,
| (9) | ||||
| (10) |
where we have taken . The spatial dependence of the pump enters through the overlap , of the first two Mathieu functions due to the cross pump-cavity light field potential. The energy scale corresponds to the effective recoil in pump and cavity directions, allowing for the possibility of a deep pump lattice. For a shallow lattice these functions become and respectively.
From these linearised equations, we may then determine when supermode-DW-polariton condensation occurs, by identifying the point at which the linearised fluctuations become unstable. There is some subtlety to this point, discussed further below. Calculating the growth/decay rates of linearised fluctuations is straightforward, corresponding to an eigenvalue equation. Because there are anomalous coupling terms (i.e., because depends on both and , and vice versa) one must use the Bogoliubov–de Gennes parametrisation, i.e., write and similarly for . It is convenient to resolve the function onto some set of basis states. We use the harmonic oscillator basis states, giving a particularly simple result in the limit .
With the basis noted above, the eigenvalue problem is given by where the matrix can be written in the block form in terms of blocks:
| (11) |
In this expression, the various block matrices are as follows: The matrix is a diagonal matrix consisting of the detuning between the pump laser and each cavity mode. is similarly a diagonal matrix describing the energy difference between a given atomic transverse mode function and the ground state mode function. This is a function of as it also includes the energy associated with the different scattering states. The matrices denote the effect of atom-atom interactions, corresponding to the overlap between two atomic modes and the atomic ground state density. That is, they describe scattering off the condensate causing transitions between modes. The matrices denote the dielectric shift due to the atoms, corresponding to the overlap between two cavity modes and the atomic ground state density. (The matrices and differ in general because the cavity beam waist does not match the harmonic oscillator length of the atoms.) The matrix denotes atom-cavity scattering and involves the overlap of the atomic ground state mode function with a given excited mode and a given cavity mode. The energy scale is for cavity beam waist .
On solving Eq. (11), one finds that while there is a threshold for instability when of nearby modes, there is always an unstable eigenvalue as soon as for any mode (i.e., the pump is blue-detuned of any mode). However, the growth rate of this instability varies widely with parameters. At low pump powers, the timescale for growth is very long (i.e., seconds) Bhaseen et al. (2012). As pump strength increases, there is a sharp threshold where two eigenvalues of Eq. (11) cross, demarcating a transition to a state that rapidly orders (timescale of microseconds). The curves in Figure 2 correspond to finding the eigenvector (i.e., mode composition) of this mode which becomes rapidly unstable.
Structure factor simulation. The calculated density and momentum distributions presented in Fig. 4 are evaluated by numerically integrating the mean-field equations of motion in 3D for the atomic wavefunction and cavity mode. Using the Hamiltonian in Eq. 3, we derive equations of motion for the atomic wavefunction and cavity field under a mean-field approximation where and . This gives us the coupled differential equations,
| (12) | |||
| (13) | |||
Furthermore we adiabatically eliminate the cavity field under the assumption that it equilibrates on a timescale much faster than the atomic motion. To simulate the behavior presented in Fig. 4, we restrict to a single mode, either TEM00 or TEM10, and numerically integrate the equations of motion. The initial atomic wavefunction is set to the Thomas-Fermi distribution associated with our ODT parameters, and the initial cavity field is set to . The strength of the pump field is increased linearly in time from to to simulate the transverse pumping of our cavity. The in situ density distributions shown in Fig. 4a are . The momentum distributions are obtained by a Fourier transform of the in situ atomic wavefunction.
References
- Bhaseen et al. (2012) M. J. Bhaseen, J. Mayoh, B. D. Simons, and J. Keeling, Phys. Rev. A 85, 013817 (2012).
- Denschlag et al. (2002) J. H. Denschlag, J. E. Simsarian, H. Häffner, C. McKenzie, A. Browaeys, D. Cho, K. Helmerson, S. L. Rolston, and W. D. Phillips, Journal of Physics B: Atomic, Molecular and Optical Physics 35, 3095 (2002).