Credit allocation based on journal impact factor and
coauthorship contribution
Abstract
Some research institutions demand researchers to distribute the incomes they earn from publishing papers to their researchers and/or co-authors. In this study, we deal with the Impact Factor-based ranking journal as a criteria for the correct distribution of these incomes. We also include the Authorship Credit factor for distribution of the incomes among authors, using the geometric progression of Cantor’s theory and the Harmonic Credit Index. Depending on the ranking of the journal, the proposed model develops a proper publication credit allocation among all authors. Moreover, our tool can be deployed in the evaluation of an institution for a funding program, as well as calculating the amounts necessary to incentivize research among personnel.
keywords:
co-author credit; impact factor; ranking; Cantor’s succession; harmonic credit1 Introduction
Research institutions like universities or governmental/military institutes require staff to re-distribute the remunerations they receive from publishing in journals among their researchers/employers (Groshen 1991). Thus, one wage type earned for published papers serves as payment to co-authors. This problem is difficult to solve, given the prevalent conflicts of interest in many institutions, where distribution of payments is often unjust due to bad practice or ignorance. Therefore, a quantitative method to deal with distribution issues in relation to co-authorship is necessary.
The impact factor (IF) is a citation-based measure for performance related to prestige and proliferation of journals in which research institutions publish their papers (Mattsson et al. 2011). A journal’s IF gives the mean number of citations received by papers that have been published in these journals, and is one of the most popular indexes regarding quantitative methods to evaluate research (Bouyssou and Marchant 2011). Moreover, the number of citations determines the impact of journals on journal rankings (Tsai 2014). Generally, journals with a high IF contain a lower percentage of uncited articles (Hsu and Huang 2012).
In this paper, we present a model for the distribution of money benefits to an individual or a group of co-authors who published an International Scientific Indexing (ISI) paper. The model is based on two elements:
-
(i)
the ranking of the journal based on Impact Factor (IF) as a criterion for weighing the distribution of these incomes; and
-
(ii)
the authorship credit factor for a distribution of the incomes among the authors (Lukovits and Vinkler 1995), useful for multi-authored scientific publications.
Below our authorship factor considers the geometric progression of Cantor’s theory (Cantor 1883), which we then compare with the harmonic credit approach of Hagen (2008). Finally, we illustrate our results using three publications with varying numbers of co-authors, and journals with distinct IF and scholarly fields.
2 Credit distribution model
Let be the total publication credit allocated for one article (), and let be the quotient of the journal’s rank with respect to the total number of journals (). The journal’s rank is based on IF and is associated to the journal’s area, as by the Web of Science. Let be a proportion arbitrarily assigned to an institution to define the income base from the total . Thus, the total publication credit allocated for all authors is obtained by
| (1) |
Function (1) depends only on the variables and ; is known. Evaluating point in the second derivative we obtain
i.e., reaches a relative maximum at and is given by the total available amount. Therefore, for all and for any . We can interpret the model (1) with respect to as:
-
(i)
if , the credit corresponds to the available funding. Even if relative maximum is reached with this value, it does not incentivize the publication with respect to the journal quality;
-
(ii)
if , the credit is the sum of a bonus base, , with an extra bonus, , given by the IF of the journal. This is favourable if an institution wishes to incentivize a publication with respect to journal quality;
-
(iii)
if , the credit depends not only on the available funding, but also relates to journal ranking. This is a non-favourable case if an institution wishes to use all available funding to incentivize publication (Figure 1 illustrates the aforementioned cases).
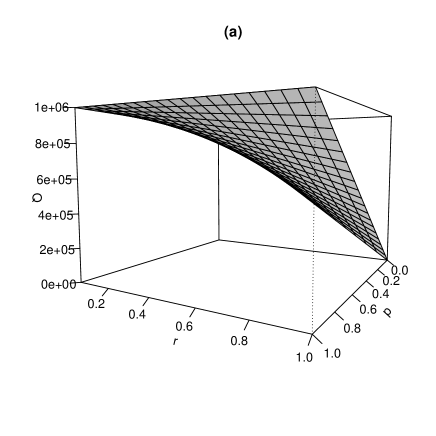
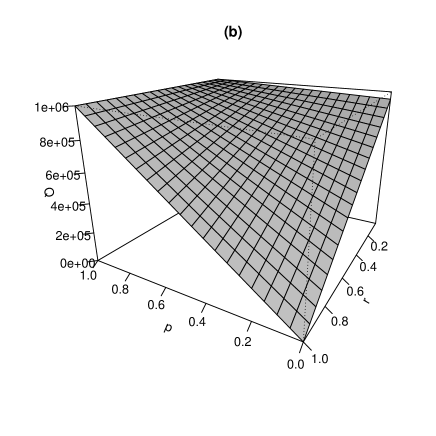
When and , the total amount is maximized, and is minimized when and . For these values, the amount quickly decreases and the value could be acceptable to differentiate the credit base from the credit related to journal ranking. Values of near (and including it) 1 correspond to journals with the lowest impact, and , and . This means that the ranking influences negatively the total publication credit. In a contrary case, values of near zero relate to the more prestigious journals. Given the values , and , model (1) gives the total credit to be allocated for the co-authors. As such, the institutions generally divided the credit equally among all co-authors (Hagen 2008).
In the next section, we consider three authorship credit indexes to distribute the credit in fractional form to privilege
the main authors of a paper.
3 Authorship credit indexes
The total credit determined by model (1) is related to the publication; but how could it be assigned to the publication’s authors? Authorship credit for multi-authored scientific publications is routinely allocated either by issuing full publication credit repeatedly to all co-authors (Hagen 2008), or by dividing one credit equally among all of them (Karpov 2014). We consider this latter option. That is, the credit allocated for a specific author is
| (2) |
where , , corresponds to a succession of proportions or weight of the total credit. From (2) it becomes clear that infinite functions exist to share the incomes between authors. In addition, the condition called sums of all shares is equal to 1 is accomplished (Hagen 2008). Among all of these functions proposed in the literature (Egghe et al. 2000; Hagen 2013), we highlight the Harmonic Credit Index in the next subsection.
3.1 Harmonic credit index
Hagen (2008) proposed the Harmonic Credit Index (HCI) for the th-author as follows:
| (3) |
where is the number of authors. The d’Alembert’s ratio test for succession (3) shows that
meaning the test is inconclusive. However, the property (i) of Section 3.1, , ensures the convergence of this succession (Hagen 2008). HCI ensures that:
-
(i)
the total publication credit is shared among all coauthors;
-
(ii)
the main author gets most credit, and the th author receives more credit than the th author;
-
(iii)
the higher the number of authors, the less credit per author.
In Hagen (2013), HCI is compared with various co-author credit models such as fractional, Liu-Fang, Lukovits-Vinkler, and Trueba-Guerrero. For an empirical dataset including medicine, bibliometric literature, psychology, and chemistry (see more details in Hagen 2010), HCI performs better than its competitors explaining nearly 97% of the variation versus, for example, 40% of fractional credit index.
Following from these properties of HCI, the total sum of is equal to the credit assigned to all co-authors. Thus,
formula (4) gives the complete HCI.
3.2 Cantor’s succession index
A geometric progression can be considered as a co-author credit index. The formula
| (5) |
with the number of authors, corresponds to the proportion of the unit interval remaining, or Cantor’s set (Cantor 1883).
The d’Alembert’s ratio test shows that
i.e., the series converges absolutely.
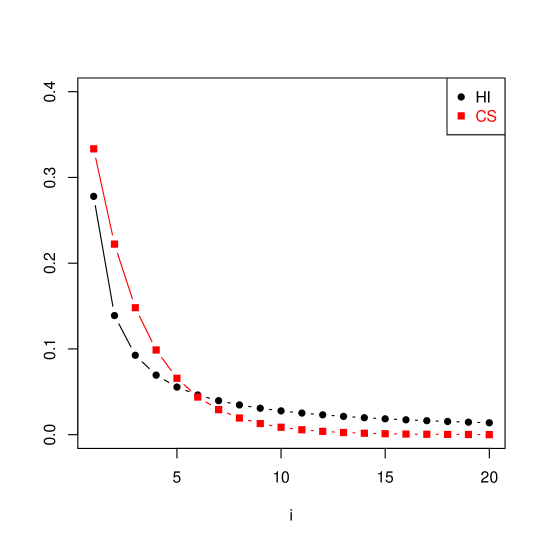
Compared with , do not depend on the total number of authors. However, the total sum of the ’s is less than 1; it is 1 only for a large number of authors. These series correspond to the total length removed from Cantor’s sets. Figure 2 compares both successions (3) and (5) between authors. It shows that the first five proportions differ from each author in a decreasing order. The first five , however, are about similar to each author, but in decreasing order. Only for both successions are about equal and for , tends to be larger than but with similar distribution among these authors. This illustrates that Cantor’s succession is also a fractional counting, where one credit is divided non-uniformly among all co-authors (Hagen 2008, 2010). Therefore, this succession also corrects for the inflationary bias produced by multi-authored publications.
As in Section 3.1, co-author amount assignment of (2) can be evaluated using (5) to obtain
| (6) |
Hereafter, we will refer to formula (6) as the Cantor’s Succession Index (CSI). We see that the total sum of
is less than the total credit . If a large number of co-authors worked on the publication, the total sum of
tends to be the total credit . However, for a small number of authors, CSI produces an error in the distribution and a
considerable bias, leading to ill-distributed credit. For this reason, and to obtain an index with which this important property
is accomplished, it is necessary to implement a correction factor for CSI, as presented in the next subsection.
3.3 Adjusted Cantor’s succession index
For a finite number of authors , we have the publication credit
| (7) |
that is always positive and is zero when . Using (7), we define a corrected version for as
| (8) |
Hereafter, we will refer to formula (8) as the Adjusted Cantor’s Succession Index (ACSI).
From (8), it is clear that when . Considering (7) and (8), we can corroborate that . Based on ACSI, we obtain a new publication credit allocated for an specific th author in (2) given by
| (9) |
ACSI also preserves the property of fractional counting, where one credit is divided non-uniformly and
equally among the main co-authors and the rest, respectively.
4 Examples
We illustrate the performance of each co-author credit from ISI publications, considering formulas (4) and (9) and a bonus base proportion of , in the following examples:
-
1.
The Earth and Planetary Science Letters ISI journal has an impact factor of 4.724 (according to the Web of Science 2013), and ranked 5th out of 80 journals in the field of Geochemistry & Geophysics. Considering research by Lange et al. (2012), for the values , and , the publication credit allocation between the authors is for HCI and ACSI and for CSI (see Table 1). The total proportion of is near 1 given the large list of coauthors. This produces CSI near ACSI. However, for the properties mentioned in Section 3.1, HCI distributed the credit to the three main authors in a non-uniform way, whereas ACSI provides more equal credits among them.
Table 1: Credit coauthorship distribution considering the paper Lange et al. (2012). Author () CSI ACSI HCI 1 0.333 645,666.67 647,702.46 0.331 641,416.78 2 0.222 430,444.44 432,480.23 0.166 320,708.39 3 0.148 286,962.96 288,998.75 0.110 213,805.59 4 0.099 191,308.64 193,344.43 0.083 160,354.19 5 0.066 127,539.10 129,574.89 0.066 128,283.36 6 0.044 85,026.06 87,061.85 0.055 106,902.80 7 0.029 56,684.04 58,719.83 0.047 91,630.97 8 0.020 37,789.36 39,825.15 0.041 80,177.10 9 0.013 25,192.91 27,228.70 0.037 71,268.53 10 0.009 16,795.27 18,831.06 0.033 64,141.68 11 0.006 11,196.85 13,232.64 0.030 58,310.62 Total 0.989 1,914,606.00 1,937,000.00 1 1,937,000.00 -
2.
The Fisheries Research ISI journal has an impact factor of 1.843 (according to the Web of Science 2013), and ranked 12 out of 50 journals in the Fisheries field. Considering research by Contreras-Reyes et al. (2014), for the values , and , the publication credit allocation between the authors is for HCI and ACSI and for CSI (see Table 2). In contrast to the first example, is far from 1, given the short list of coauthors, thus CSI is far from ACSI. In this case, HCI should be more adequate to distribute the total amount between the three authors. However, ACSI preserves the proportion among the authors.
Table 2: Credit coauthorship distribution considering the paper Contreras-Reyes et al. (2014). Author () CSI ACSI HCI 1 0.333 352,000.0 456,296.3 0.545 576,000 2 0.222 234,666.7 338,963.0 0.273 288,000 3 0.148 156,444.4 260,740.7 0.182 192,000 Total 0.704 743,111.1 1,056,000.0 1 1,056,000 -
3.
Consider now Ausloos (2015). The Physica A ISI journal has an impact factor of 1.722 (according to the Web of Science 2013), and is ranked 25 out of 78 journals in the Physics Multidisciplinary field. For the values , and , the publication credit allocation for the author is for HCI, CSI and ACSI. Given that we have only one author, obviously CSI does not provide a precise criterion. Using the adjusted version, we obtain the same result for HCI.
5 Conclusions
The proposed bonus distribution model gives a publication credit allocation associated to the performance of a journal, given by its IF-based ranking. This approach allows to restrict the credit allocated to each author, and so ranking criteria encourage research activity in an institution and to publish in higher-ranked journals. This tool is also helpful when an institution needs to be evaluated for a funding program as well as to determine where to direct amounts to incentivize research (Egghe et al. 2000).
The proposed model is not restricted to a specific succession index. The most simple index is one that divides the total available amount equally among all co-authors (Hagen 2008). Cantor’s index considers authorship rank instead, and the HCI considers these ranks and the number of co-authors. HCI provides different credits among the main authors, where this number depends on the total number of authors. However, the HCI should be employed for three main reasons:
-
(i)
HCI proportions differ from each author in a decreasing order, allocating the higher amounts of credit to the prime authors, who make larger individual contributions to a paper (Mattsson et al. 2011);
-
(ii)
Adjusted Cantor’s Index is still a fractional counting, and only divides non-uniformly the first fraction of the credit among all co-authors; and
-
(iii)
HCI’s formula is much more tractable and simpler than ACSI.
Since the selection of proportion of the proposed model is largely influenced by institution’s policies, the model allows for sufficient flexibility to decide how to develop research among co-authors. Actually, several institutions such as universities choose option (i) of Section 2, assuming that an ISI paper deserves recognition only if it has the aforementioned indexation. This looks erroneous, however, because the journal ranking provides a qualification to measure its reputation with respect to an associated field (Bouyssou and Marchant 2011).
Given that -index is probably not the best indicator/predictor of the journal quality (Hirsch 2007), the model can
be easily adapted to a more effective index to determine the ranking . Additionally, further research using a stochastic
-index (Nair and Turlach 2012) is needed, where the underlying proposed model is dependent on time.
Acknowledgements
I would like to thank Paola Andrea Marín (INE, Santiago, Chile) and Ghislaine Barría (IFOP, Valparaíso, Chile) for their helpful comments which improve this work substantially.
References
- Ausloos (2015) Ausloos, M. (2015). Assessing the true role of coauthors in the h-index measure of an author scientific impact. Physica A 422, 136-142.
- Bouyssou and Marchant (2011) Bouyssou, D., Marchant, T. (2011). Bibliometric rankings of journals based on impact factors: An axiomatic approach. Journal of Informetrics 5, 75-86.
- Cantor (1883) Cantor, G. (1883). ber unendliche, lineare Punktmannigfaltigkeiten V (On infinite, linear point-manifolds (sets)). Mathematische Annalen 21, 545-591.
- Contreras-Reyes et al. (2014) Contreras-Reyes, J.E., Arellano-Valle, R.B., Canales, T.M. (2014). Comparing growth curves with asymmetric heavy-tailed errors: Application to southern blue whiting (Micromesistius australis). Fisheries Research 159, 88-94.
- Egghe et al. (2000) Egghe, L., Rousseau, R., Van Hooydonk, G. (2000). Methods for accrediting publications to authors or countries: Consequences for evaluation studies. Journal of American Society of Information Sciences 51, 145-157.
- Groshen (1991) Groshen, E.L. (1991). Five reasons why wages vary among employers. Industrial Relations: A Journal of Economy and Society 30, 350-381.
- Hagen (2008) Hagen, N.T. (2008). Harmonic allocation of authorship credit: Source-level correction of bibliometric bias assures accurate publication and citation analysis. PLoS ONE 3, e4021:4021-4027.
- Hagen (2010) Hagen, N.T. (2010). Harmonic publication and citation counting: sharing authorship credit equitably not equally, geometrically or arithmetically. Scientometrics 84, 785-793.
- Hagen (2013) Hagen, N.T. (2013). Harmonic coauthor credit: A parsimonious quantification of the byline hierarchy. Journal of Informetrics 7, 784-791.
- Hirsch (2007) Hirsch, J.E. (2007). Does the h index have predictive power? Proceedings of the National Academy of Sciences 104(49), 19193-19198.
- Hsu and Huang (2012) Hsu, J.W., Huang, D.W. (2012). A scaling between Impact Factor and uncitedness. Physica A 391, 2129-2134.
- Karpov (2014) Karpov, A. (2014). Equal weights coauthorship sharing and the Shapley value are equivalent. Journal of Informetrics 8, 71-76.
- Lange et al. (2012) Lange, D., Tilmann, F., Barrientos, S.E., Contreras-Reyes, E., Methe, P., Moreno, M., Heit, B., Agurto, H., Bernard, P., Vilotte, J.P., Beck, S. (2012). Aftershock seismicity of the 27 February 2010 Mw 8.8 Maule earthquake rupture zone. Earth and Planetary Science Letters 317-318, 413-425.
- Lukovits and Vinkler (1995) Lukovits, I., Vinkler, P. (1995). Correct credit distribution: A model for sharing credit among coauthors. Social Indicators Research 36, 91-98.
- Mattsson et al. (2011) Mattsson, P., Sundberg, C.J., Laget, P. (2011). Is correspondence reflected in the author position? A bibliometric study of the relation between corresponding author and byline position. Scientometrics 87, 99-105.
- Nair and Turlach (2012) Nair, G.M., Turlach, B.A. (2012). The stochastic -index. Journal of Informetrics 6, 80-87.
- Tsai (2014) Tsai, C.F. (2014). Citation impact analysis of top ranked computer science journals and their rankings. Journal of Informetrics 8, 318-328.