Spatially Resolved Spectroscopy of Sub-mm Galaxies at 2111Based on observations made with ESO Telescopes at the La Silla Paranal Observatory under programme IDs 088.A-0452 and 090.A-0464
Abstract
We present near-infrared integral-field spectroscopic observations targeting H in eight sub-millimeter galaxies (SMGs) at =1.3-2.5 using VLT/SINFONI, obtaining significant detections for six of them. The star formation rates derived from the H emission are 100 M⊙yr-1, which account for only 20-30% of the infrared-derived values, thus suggesting that these systems are very dusty. Two of these systems present [NII]/H ratios indicative of the presence of an Active Galactic Nucleus (AGN). We mapped the spatial distribution and kinematics of the star forming regions in these galaxies on kpc-scales. In general, the H morphologies tend to be highly irregular and/or clumpy, showing spatial extents of 3-11 kpc. We find evidence for significant spatial offsets, of 0.1-0.4′′ or 1.2-3.4 kpc, between the H and the continuum emission in three of the sources. Performing a kinemetry analysis we conclude that the majority of the sample is not consistent with disk-like rotation-dominated kinematics. Instead, they tend to show irregular and/or clumpy and turbulent velocity and velocity dispersion fields. This can be interpreted as evidence for scenario in which these extreme star formation episodes are triggered by galaxy-galaxy interactions and major mergers. In contrast to recent results for SMGs, these sources appear to follow the same relations between gas and star forming rate densities as less luminous and/or normal star forming galaxies.
Subject headings:
galaxies: submillimeter — galaxies: high-redshift — galaxies: starburst — submillimeter: galaxies1. Introduction
Early observations of the sub-mm sky, mostly carried out using the Submillimeter Common-User Bolometer Array (SCUBA) on the James Clerk Maxwell Telescope (JCMT), revealed a population of very luminous, LIR1012L⊙ — corresponding to associated star-formation rates (SFR) 500M⊙yr-1 —, high redshift, 1, galaxies which are extremely faint at optical wavelengths (e.g., Smail et al., 1997; Hughes et al., 1998), the so-called sub-mm galaxies (SMGs). These sources, as a population, are responsible for the release of a significant fraction of the energy generated by all galaxies over the history of the Universe (Blain et al., 1999). Their very high IR to sub-mm fluxes, in comparison to the optical and UV outputs, indicate that a significant fraction of the luminosity in these galaxies is heavily obscured (Casey et al., 2014b). Intriguingly, SMGs contribute about 20% (Chapman et al., 2005) to the integrated star formation rate density (SFR), thus indicating that a large fraction of the star formation in the Universe is hidden by gas and dust (e.g., Barger et al., 2012).
Mostly due to their optical faintness, measuring redshifts and assigning accurate multi-wavelength associations have been difficult and expensive in terms of telescope time. There is strong evidence that the majority of the SMGs are at redshifts greater than unity, with a median redshift for the population of 2-3 (Smail et al., 2000, 2002; Chapman et al., 2005; Simpson et al., 2014). Accurate spectroscopic redshifts and well-determined multi wavelength properties have now being derived for a few hundred SMGs (see Casey, Narayanan, & Cooray, 2014a, for a review). The observed gas and stellar surface densities of these SMGs, when coupled to plausible spectral energy distributions (SEDs), are significantly higher than those of low-redshift IRAS galaxies (Blain et al., 1999; Trentham et al., 1999; Dunne et al., 2000). Furthermore, their luminosities and masses demand that the SMG phase be short-lived as compared with the age of the Universe (e.g., Frayer et al., 1999). The typical depletion timescale in SMGs measured from molecular gas CO observations is 100-200 Myr, in contrast to the much longer, 1 Gyr, timescales derived for normal galaxies (e.g, Tacconi et al., 2010; Engel et al., 2010; Bothwell et al., 2013; Swinbank et al., 2014). Still, the timescales for high redshift SMGs are longer than those seen in local ULIRGs, primarily due to the elevated gas fractions in high-redshift galaxies (Greve et al., 2005; Bothwell et al., 2013).
SMGs are mostly found at 1, and Luminous (1011) and Ultra-luminous (1012) IR Galaxies, (U)LIRGs (Sanders & Mirabel, 1996) are considered their analogues in the local Universe. However, while (U)LIRGs in the local Universe are extremely rare, with space densities 10-7Mpc-3 (comparable to those of quasars; Kim & Sanders, 1998), SMGs at 2.5 have space densities 10 higher at similar IR luminosities (e.g., Chapman et al., 2005; Simpson et al., 2014). This clearly points to a rapid evolution in the most extreme IR luminous galaxies, which has been parameterized as (1+)α with 3.5 for the total energy output attributed to these systems out to z1 (Le Floc’h et al., 2005). Hence, while they are relatively unimportant in the local Universe, (U)LIRGs can account for up to 50% of the total star formation density by 2 (e.g., Murphy et al., 2011; Casey et al., 2012; Gruppioni et al., 2013).
The nature of the large energy output in SMGs is now commonly assumed to be associated with their vigorous star formation activity. Nuclear activity is also expected to provide a contribution to the energy emission in a fraction of the systems. Early studies (e.g., Alexander et al., 2005) claimed that a very high fraction, 75% of the radio-selected spectroscopically-identified SMGs, can be associated with Active Galactic Nuclei (AGN). In contrast, a lower AGN fraction, 15-30%, was reported for the general SMG population (Laird et al., 2010; Johnson et al., 2013; Wang et al., 2013), the vast majority of them subject to heavy obscuration (Bauer et al., 2010). A strong connection between AGN activity and strong starburst episodes has been proposed based both on observations (Sanders et al., 1988) and theory (Hopkins et al., 2008), in which these events are triggered by the major merger of gas rich galaxies. Spatially-resolved observations of SMGs using the Hubble Space Telescope have not been conclusive in this regard (Swinbank et al., 2010; Chen et al., 2015), finding that SMGs at =0.7-3.4 are in general compact with spheroid/elliptical light profiles. Similarly, recent ALMA observations (e.g., Simpson et al., 2015b) have also found that brighter SMGs are compact, 0.2′′, in the sub-mm as well.
Integral Field Unit (IFU) spectrographs, in particular those assisted by Adaptive Optics (AO), have been critical in studying the morphologies and kinematics of SMGs at high spatial resolutions. The first comparison of the dynamical properties from SINFONI (Spectrograph for Integral Field Observations in the Near Infrared) installed at the VLT (Very Large Telescope) by Bouché et al. (2007) showed that bright SMGs have larger velocity widths and are much more compact than the UV and optically selected 2 star forming galaxies; they also have lower angular momenta and higher matter densities. This indicates that dissipative major mergers may dominate the SMG population. Early studies in the near-IR by Swinbank et al. (2006) of 6 high redshift SMGs show that they consist of more than one sub-component with significant velocity offsets. Similar results were found by Alaghband-Zadeh et al. (2012) for eight SMGs, who interpreted them as evidence that SMGs are systems in the early stages of major mergers. More recently, Menéndez-Delmestre et al. (2013) found evidence for the presence of a compact region characterized by broad H emission which can be associated with an AGN together with clumps of narrow H emission due to star formation processes. At the same time, they do not see evidence for ordered motions, hence consistent with a connection between SMGs and galaxy mergers. Harrison et al. (2012) observed eight ULIRGs that host AGN activity and SMGs at high redshift with IFU, concluding that the AGN activity could be the dominant power source for driving all of the observed outflows, although star formation may also play a significant role in some of the sources. Unfortunately, given the relatively low spatial densities of SMGs and the required exposure times using 8m telescopes and state-of-the-art instrumentation, only relatively small samples of galaxies have been studied so far.
In this paper, we present observations of eight SMGs between =1.4 and 2.5 using the SINFONI near-IR IFU at the European Southern Observatory (ESO) Very Large Telescope (VLT). The main goal of this work is to study the morphology and kinematics of the star forming regions in high redshift SMGs using the H line as a tracer. In Section 2 we present the properties of the sample studied, the observations, data reduction and analysis. The results of these observations are presented in Section 3, while the discussion and conclusions are presented in Section 4 and 5 respectively. We assume a CDM cosmology with =0.7, =0.27 and =0.73 (Hinshaw et al., 2009).
2. VLT/SINFONI Near-IR IFU Observations
2.1. Sample
As described in the previous section, only relatively small samples of targeted SMGs at high-z have been studied so far using IFU spectroscopy. This paper focuses on follow-up IFU observations for eight 1 ULIRGs selected based on two different and complementary criteria. Hence, it will be possible to study how these selections are related to the properties of the observed sources. The basic properties of the sources studied in this work are presented in Table 1. We categorize our sources in two groups, Group A focuses on warm-dust ULIRGs, while in Group B we include only SMGs with a suitable reference star for the AO corrections to have high spatial resolution for kinematic measurements.
| Name | GroupaaGroup A correspond at no-AO observation of warm-dust ULIRGs, while Group B are AO observations focus on SMGs. | RA | Dec | spec | Date | Band | Seeing | FOV | texp | LFIRbbFIR luminosity (8-1000 m) of J033129, J033212, J033246 and J033249 from Casey et al. (2011), for RGJ0302+0010 from Swinbank et al. (2004), for SMMJ04331+0210 (N4) from Neri et al. (2003) — corrected for lensing magnification and obtained from 850m flux densities — and for SMMJ2135-0120 from Ivison et al. (2010), also corrected for lensing magnification. | Tdust.ccTdust were obtained from Casey et al. (2011) for J033129, J033212, J033246 and J03329, for RGJ0302+0010 from Chapman et al. (2004), for SMMJ04331+0210 (N4) from Neri et al. (2003) and for SMMJ2135-0120 from Ivison et al. (2010) with two components associated with the warm and cool dust. |
|---|---|---|---|---|---|---|---|---|---|---|---|
| (J2000) | [Arcsec] | [Hrs] | [1013 L⊙] | [K] | |||||||
| J033129.874-275722.40 | A | 03:31:29.87 | -27:57:22.40 | 1.482 | 11/2011 | H | 0.80 | 8′′8′′ | 2.0 | 1.2 | 454 |
| J033212.866-274640.89 | A | 03:32:12.86 | -27:46:40.89 | 1.930 | 11/2011 | K | 0.64 | 8′′8′′ | 2.5 | 2.2 | 429 |
| J033246.329-275327.01 | A | 03:32:46.32 | -27:53:27.01 | 1.382 | 10/2011 | H | 0.65 | 8′′8′′ | 2.0 | 0.4 | 5313 |
| J033249.352-275845.07 | A | 03:32:49.35 | -27:58:45.07 | 2.326 | 10/2011 | K | 0.86 | 8′′8′′ | 2.0 | 8.1 | 565 |
| L50879 | A | 03:33:37.67 | -27:46:35.26 | 2.509 | 11/2011 | K | 0.64 | 8′′8′′ | 2.5 | 0.8 | 46 |
| RGJ030258+001016 | B | 03:02:58.94 | +00:10:16.3 | 2.236 | 10/2012 | K | 0.34 | 3′′3′′ | 3.75 | 0.77 | 46 |
| SMMJ04431+0210 (N4) | B | 04:43:07.25 | +02:10:23.3 | 2.509 | 10/2012 | K | 0.35 | 3′′3′′ | 3.75 | 0.3 | 40 |
| SMMJ2135-0102 | B | 21:35:11.60 | -01:02:52.0 | 2.326 | 10/2012 | K | 0.34 | 3′′3′′ | 3.75 | 0.23 | 30-60 |
2.1.1 Group A – Selected
Group A consists of several warm-dust star-forming ULIRGs at 1-2. While SMGs are proposed to contribute to as much as half of the star formation density at early epochs (Gruppioni et al., 2013), SMG observations at 850 m naturally select colder-dust ULIRGs with Td45K and thus potentially miss a whole subpopulation of high-z ULIRGs by virtue of their warmer dust temperatures. Recent work by Casey et al. (2009, 2011) show that there is a population of ULIRGs that are fainter at 850 m and have higher dust temperatures, Td50 K (e.g., Chapman et al., 2004; Blain et al., 2004). These so-called warm-dust ULIRGs may contribute significantly to the cosmic star formation rate density at its peak, similar to the SMG contribution. However, the warmer-dust temperatures implied by the absence of 850 m-flux suggests that they might have inherently different evolutionary origins compared to the well-studied cold-dust SMGs. It is possible that these higher temperatures are due to the effects of AGN heating.
We have assembled a sample of warm-dust star-forming ULIRGs from spectroscopic samples of 250 m-selected BLAST galaxies from the observations described by Casey et al. (2011). All of them have existing redshift measurements from long-slit spectroscopy. In four of the five galaxies (J033246, J033249, J033129 and J033212) the redshift was determined based on the detection of the H emission line, while for L50879 the Ly line was detected and identified.
J033246 was first identified in spectroscopic surveys by Kriek et al. (2008) and Vanzella et al. (2008). It was later classified as a star-forming radio galaxy based on a significant sub-mm detection by Weiß et al. (2009). The galaxy has a redshift of =1.382, as indicated by the detection of an emission line using VLT/ISAAC identified as H by Casey et al. (2011). The measured rest-frame [NII]/H line flux ratio of 0.13 suggests that the emission in this galaxy is dominated by star formation activity. J033249 is a very similar source, also classified as a vigorous star forming galaxy at =2.326 (Casey et al., 2011). Two systems (J033212 and J033129) in our sample were not detected by our VLT/SINFONI observations and thus are not further discussed.
2.1.2 Group B – SMGs with natural AO Observations
Sources in this group were selected roughly independently of the target physical properties. The main goal in this case is to achieve the highest possible spatial resolution for our kinematic measurements. Hence, the only SMG selection criteria were the availability of a suitable reference star for the AO corrections (which for VLT/SINFONI was a R14 star closer than 30′′), a measured spectroscopic redshift of 1.5 or 2.5, so that H would fall in either the H or K near-IR bands, and that the source is observable at high enough elevation by the VLT.
This resulted in the selection of three sources for this group: SMMJ2135-0102, RGJ0302+0010 and SMMJ04431+0210 (N4). The mean redshift for these sources is =2.189. SMMJ04431+0210 (N4) is one of the 15 original sub-mm sources found in the SCUBA Lens Survey (S850=7.2 mJy; Smail et al., 1997, 2002). SMMJ2135-0102 was identified by Swinbank et al. (2010) in a APEX/LABOCA 870 m observation of the galaxy cluster MACSJ2135-010217. The galaxy RGJ0302+0010 was selected from the catalogs of SMGs of Chapman et al. (2004, 2005); Takata et al. (2006).
RGJ030258+001016
was identified as a ULIRG by Chapman et al. (2004). Rest-frame UV spectroscopy shows strong [CIV] emission, which together with a high [NII]/H suggests the presence of AGN activity and a redshift of 2.24040.0008 (Chapman et al., 2004; Swinbank et al., 2004). The [O III]4959,5007 emission-line doublet shows a narrow and redshifted broad component. This broad component is offset from the center by about 8 kpc and can be explained by an outflow with its near-side obscured by dust (Harrison et al., 2012).
SMMJ04431+0210 (N4)
is an extremely red galaxy identified as the near-IR counterpart of the faint sub-mm source reported by Smail et al. 1999, which was undetected in deep optical images (Smail et al., 1998). It is located behind the =0.18 cluster MS0440+02, with an amplification factor for the background galaxy of =4.4 (Smail et al., 1999). A spectroscopic redshift of 2.50920.0008 was measured by Frayer et al. (2003) based on the detection of an H, [NII]6583,6548, and [OIII]5007 emission lines using the NIRSPEC spectrograph at Keck. The rest-frame [NII]/H line flux ratio of 0.470.06 suggests that this emission can be explained by a narrow-line AGN/LINER nucleus surrounded by a resolved starburst.
SMMJ2135-0102
(also known as the “cosmic eyelash”) is a gas-rich starburst galaxy. The galaxy was identified in the field of the massive lensing cluster MACSJ2135-010217 (cl=0.325) via ground-based 870m imaging (Swinbank et al., 2010). They unambiguously identified the redshift of the source as =2.32590.0001 thanks to the detection of carbon monoxide (CO) J=10 emission at 34.64 GHz and derive an amplification factor for the background galaxy of =32.54.5. Later, Swinbank et al. (2011) used the IRAM Plateau de Bure Interferometer and the EVLA to obtain maps of the CO(6-5) and CO(1-0) emission, finding that the molecular gas kinematics are well described by a rotationally-supported disk with an inclination-corrected rotation speed vrot=32025 km s-1, a ratio of rotational to dispersion-support of v/=3.50.2 and a dynamical mass of (6.00.5)1010 M⊙ within a radius of 2.5 kpc. Follow-up sub-mm studies of both molecular and atomic transitions in this galaxy reported by Danielson et al. (2011) and Danielson et al. (2013) found evidence for a two-phase medium and physical properties such as ISM density and far-UV radiation fields similar to those observed in nearby ULIRGs and central regions of starburst galaxies.
2.2. Observations and Data Reduction
Near-IR IFU observations of the sample described above were performed using the SINFONI instrument (Eisenhauer et al., 2003), installed at the ESO VLT. These data were obtained as part of program 088.A-0452 in October and November 2011 for sample A and program 090.A-0464 observed from October 2011 to November 2012 for sample B.
For the observations of the group A sources we used SINFONI in no-AO mode, with a 250 milli-arcsec pixel scale and a field-of-view (FOV) of 8′′8′′. For group B, sources were selected to have a suitable AO reference star, R14 mag closer than 30′′. Hence, observations were taken using the natural guide star (NGS) AO mode, using the 100 milli-arcsec pixel scale and a 3′′3′′ FOV. Since the main goal of these observations was to map the H emission, we used either the H-band grating, which provides a wavelength coverage of 1.45-1.85 m and a spectral resolution of 3000, or the K-band grating with a spectral resolution of 4000 and wavelength coverage of 1.95 to 2.45 m, depending on the redshift of the source. The K grating was used for all sources except for J033246. The total integration time per source ranged from 2 to 4 hours. Since each source occupied a small fraction of the FOV, the surrounding empty regions were used for sky-subtraction, thus achieving a 100% on-source time. Each observation was broken into 1-hour observing blocks (OB), which includes all overheads. For each OB, a corresponding telluric standard star was observed.
The primary data reduction was performed using the ESO SINFONI pipeline version 2.5.2222 Available at http://www.eso.org/sci/software/pipelines/sinfoni/sinfoni-pipe-recipes.html . This pipeline is organized as a set of 6 stand-alone recipes. The first step evaluates the detector linearity; this is produced by analyzing flat fields taken with increasing intensity in order to create a map of highly non-linear bad pixels. Then, a master dark frame and a map of hot pixels are created from the median of a series of dark frames. Finally, flat field frames with nearly constant intensity are combined to produce a master flat field and a third bad-pixels map (BPM). These three BPMs are then combined to produce a master BPM. The pipeline then computes the geometric distortions by placing a fiber at different positions on the detector. Each science frame is therefore corrected for dark current, bad pixels, geometric distortions and then flat fielded and wavelength calibrated.
We then performed sky estimation and subtraction, which is critical when dealing with faint sources, such as those in our sample, at near-IR wavelengths. Since our targets have relatively small spatial extents, the SINFONI FOV contains enough source-free area to provide a good sky estimation. The pipeline provides two methods to estimate and subtract the sky contribution. The first one, which computes the median of all images on a set as an estimation of the sky, is not very accurate especially when the sky is not stable. The second method, which we chose for our data reduction, uses the closest frame in time as an estimation of the sky to be subtracted. All frames are then shifted and co-added. They contain both spectral and spatial information, and are therefore reconstructed to produce 3D cubes.
The extraction of a 2D image from the data cube for each source was done by creating a pseudo-longslit using the QfitsView software333 Available at http://www.mpe.mpg.de/ott/QFitsView/ and its ImRed analysis option. The size of the extraction aperture for each source is determined as a compromise between the maximum gathered flux and the minimum sky residual contribution. Then, the apall IRAF task was used to extract an integrated 1D spectrum for each source. Finally, additional sky correction, particularly useful to eliminate residuals of sky emission lines, was carried out using the Skycorr package (Noll et al., 2014). Flux calibration and telluric corrections were performed using observations of standard stars closer than 2 hours in time and with a 1.2 in airmass. Specifically, we used the Fitting Utility for SINFONI (FUS) package developed by Dr. Krispian Lowe as part of his PhD thesis444 Available at http://uhra.herts.ac.uk/bitstream/handle/2299/2449/Krispian%20Lowe.pdf .
In order to estimate the spatial resolution of our observations, for each target we fitted Gaussian profiles to the images of the corresponding standard stars. As presented in Table 1, the effective angular resolution for the non-AO targets ranges from 0.64′′ to 0.84′′, with a mean and median of 0.7 and 0.65 respectively (corresponding to 0.59 kpc and 0.55 kpc at z2). For the galaxies in group B, which correspond to AO-assisted observations, these values are: 0.34′′ for mean and median (corresponding to 0.28 kpc at z2). We note that these estimates come from shorter exposures (10s) of brighter sources than the science exposures and are therefore most likely lower limits to the spatial resolution in our targets. However, we expect this underestimation to be rather small, 0.1′′, and thus does not affect any of our conclusions.
3. Results
With the SINFONI data described above, we were able to study both the galaxy-integrated and the spatially resolved properties of the H emission in our galaxy sample. In this section, we present images of the near-IR continuum and H emission, star formation rates, and test for evidence of AGN activity. We further study the star formation rate surface density, velocity fields and velocity dispersion maps. In Table 2, we present the spectroscopic properties for the sources in our sample derived from the VLT/SINFONI data, including H fluxes, H luminosities amongst others. The derived sources properties and associated SFRs, including those derived from IR observations obtained from the literature are listed in Table 3.
3.1. Source Images
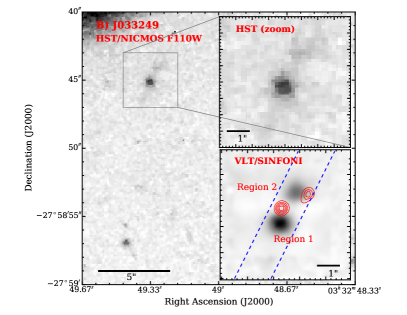
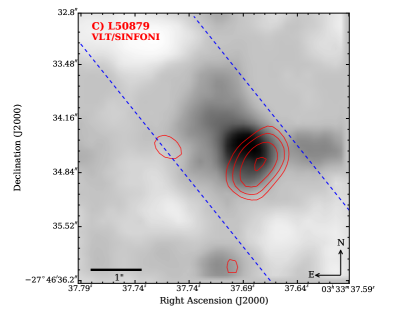
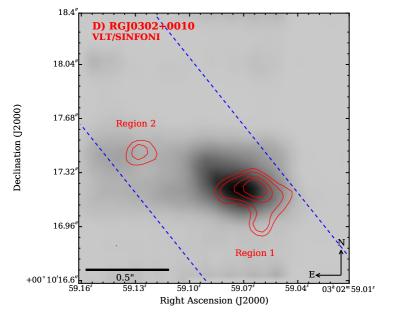
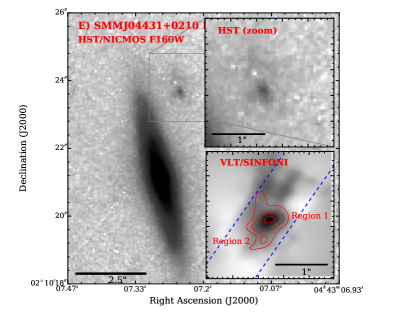
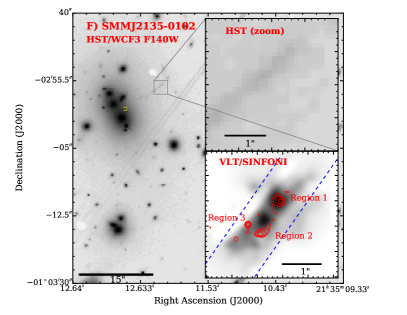
Figure 1 shows the HST observed-frame near-IR images for J033246 and J033249, SMMJ04431+0210 (N4) and SMMJ2135-0102. In all of them we also present a zoom-in around the region where the sub-mm emission is detected and a reconstructed 2-D image obtained from the VLT/SINFONI data cube. For RGJ0302 and L50879 only the VLT/SINFONI image is presented, as these sources were not observed by HST. In all cases, the H emission is overlaid on the VLT/SINFONI image as red contours.
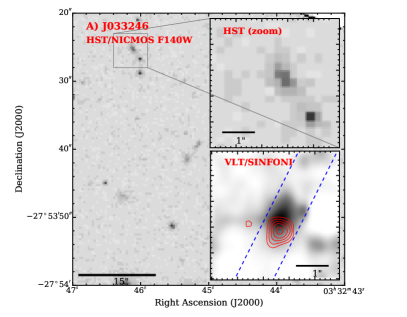
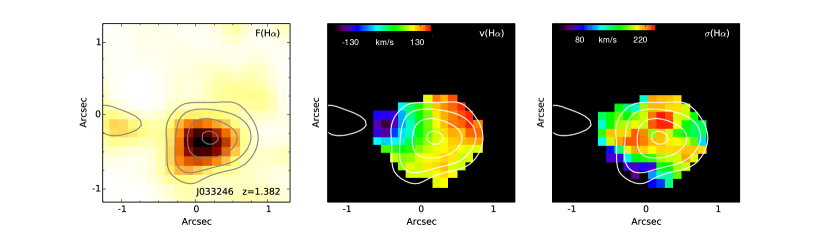
J033246
J033246 presents an extended morphology with an angular extension of 187, which corresponds to a physical size of 16 kpc. The H emission is marginally resolved spatially, with an angular diameter of 16901, which corresponds to a physical size of 14.50.8 kpc. Interestingly, the region where the H emission originates from appears to be significantly displaced from the rest-frame optical continuum. This is further discussed in the next section.
J033249
J033249 also shows an extended morphology, with an angular extension of 147 and a size of 11.3 kpc for Region 1 and for 128 or 10.7 kpc the Region 2, as can be seen in Fig 1. The spatial distribution of H emission is resolved and offset from the galaxy center, with an angular extension of 08201 or 6.80.9 kpc for Region 1 and 0701 or 5.80.9 kpc for Region 2. The morphology of this system is consistent with that of an early-stage merger with a projected distance between the two components of 11.4 kpc.
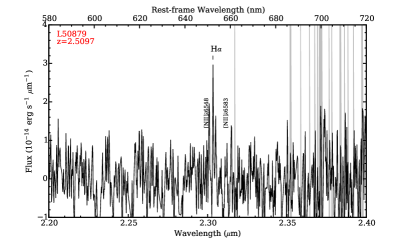
L50879
L50879 presents a rather smooth morphology with a spatial extension of 2.32′′, which corresponds to 10.25 kpc at the redshift of the source. The spatial distribution of the H line emission shows that most of it is offset from the center of the system as discussed in the following section. For the H emission we measured an angular size of 1202 or 101.4 kpc.
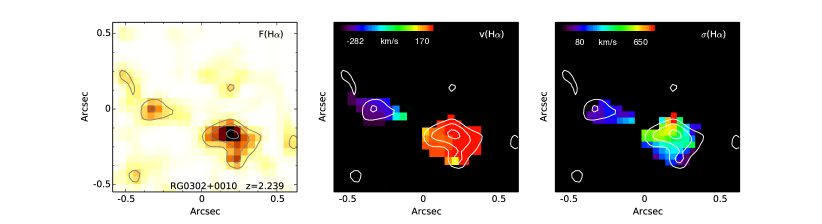
RGJ0302+0010
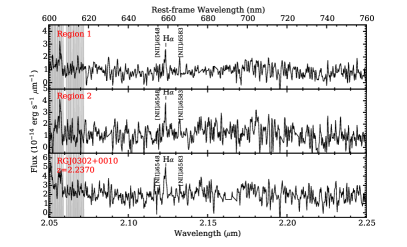
RGJ0302+0010 shows a disturbed morphology, as can be seen in Fig 1. The brighter region has a spatial extension of 115 or 9.8 kpc, while for the fainter one the size is 035 or 3 kpc. The H distribution is clumpy, presenting a larger central region (Region 1) of 050.2 in size, corresponding to 4.22.0 kpc. Another region can be identified (Region 2), with an angular size of 0380.2 or 3.22.0 kpc.
SMMJ04431+0210 (N4)
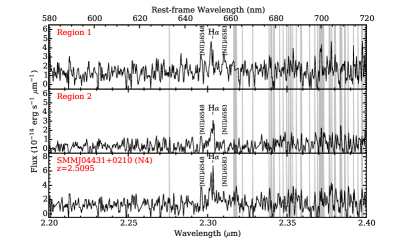
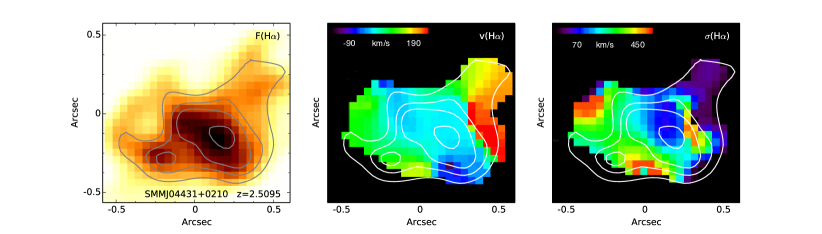
For SMMJ04431+0210 (N4), the SINFONI/VLT K band image of this region reconstructed from the data cube shows a rather clumpy morphology, with one strong and prominent source and at least one and possibly two other clumps. The H emission is strongly concentrated on the southern, brightest, region. The H emission is spatially resolved, showing a disturbed morphology. We can identify two marginally-separated components. The brighter one (Region 1) has a angular size of 085 corresponding to 7.0 kpc, while the other one (Region 2) has a size of 048 (3.9 kpc). The overall H emission extends for 1403, corresponding to 11.52.4 kpc, uncorrected for lensing amplification. Correcting for lensing magnification using a magnification factor of =4.4 (Smail et al., 1999), Region 1 has a size of 1.60.3 kpc and Region 2 of 0.90.3 kpc.
SMMJ2135-0102
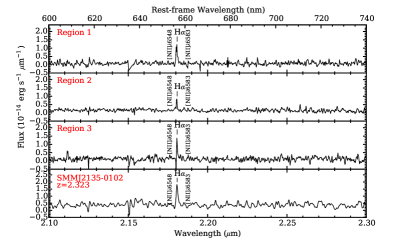
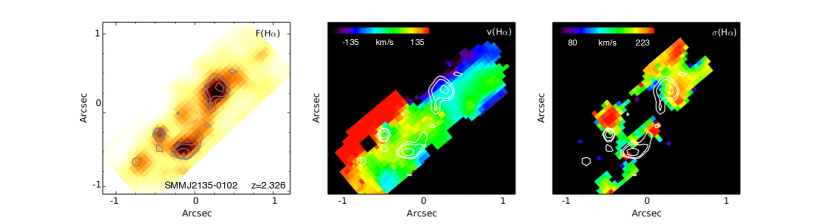
Figure 1 presents the HST/WCF3 F140W image of the region around the source SMMJ2135-0102 (the “cosmic eyelash”), located near the massive cluster MACS J2135-0102. The K-band image obtained from the VLT/SINFONI data cubes shows a clumpy morphology, in which at least two bright star-forming regions in the source plane can be clearly seen, corresponding to regions identified as Y1 and Y2 by Swinbank et al. (2011). These regions are separated by 2.8 kpc and have a spatial extension of 05, corresponding to 2.4 kpc. We can further distinguish a smaller unresolved star forming region, labeled “region 3”. For the region Y1 we measure an angular size of 0601 corresponding to a diameter of 2.80.5 kpc, while for the Y2 region the size is 0501, corresponding to 2.40.5 kpc. For region 3 we measure an angular size of 03 or 1.4 kpc, all of them uncorrected for lensing magnification. In order to correct for the distorsions of the size measurements caused by the lensing effects, we used the HST images. This is done by comparing the physical sizes of different images of the same source caused by lensing. From the HST data presented by Swinbank et al. (2011) we conclude that the spatial magnification corresponds to a factor of 2. Hence, applying this correction factor, we find that the Y1 Region has an intrinsic size of 1.4 kpc, while for the Y2 Region the size is 1.2 kpc and 0.7 kpc for region Y3.
3.1.1 Offset H Emission
Sources J033246, J033249, L50879 and region 2 of SMMJ2135-0102 show a clear spatial displacement between the H and the continuum emission, as can be seen in Figure 1. These spatial offsets range from 013 to 050, corresponding to 1.2-4.2 kpc, relative to the center of the base continuum emission at nearby wavelengths. These offsets could be explained by off-nuclear star formation, perhaps as a consequence of a recent major merger similar to the one found in II Zw 096, where 80% of the total infrared luminosity comes from an extremely compact, red, source not associated with either nucleus of the merging galaxies (Inami et al., 2010). Alternately, the offset H distribution could result from a superwind blowing out of the galaxy, similar to the one detected in M82 (Lehnert et al., 1999). In the latter scenario, the asymmetry would be due to obscuration of the receding wind by the galaxy, as a consequence of a viewing angle which is not edge-on. Furthermore, the H offset could be explained by the effects of obscuration in the direction of the nucleus. Recently, Chen et al. (2015) also find significant displacements between the positions of the H160-band continuum and the 870 m emission in SMGs. This suggests that the dusty starburst regions and the less-obscured stellar distributions are not co-located.
3.2. Extracted Integrated 1-D Spectra
| Name | aaTypical redshift uncertainty for the sources detected by SINFONI is 0.001. | FluxHαbbObserved (i.e., not corrected for extinction) H flux measured from the 1D spectra. | EQWHα | FWHMHα | [NII]/H |
|---|---|---|---|---|---|
| [10-17ergs-1cm-2] | [Årest] | [km s-1] | |||
| J033129cc3- upper limits to the fluxes were determined from the noise properties in the measured continuum around the expected positions of the lines based on the redshifts reported by Casey et al. (2011). | 1.482 | 45 | – | – | – |
| J033212cc3- upper limits to the fluxes were determined from the noise properties in the measured continuum around the expected positions of the lines based on the redshifts reported by Casey et al. (2011). | 1.93 | 39 | – | – | – |
| J033246 | 1.383 | 274 | 458 | 10638 | 0.1280.01 |
| J033249 | 2.327 | 425 | 569 | 30030 | 0.1440.02 |
| Region 1 | 2.327 | 172 | 202 | 21139 | – |
| Region 2 | 2.327 | 134 | 293 | 21824 | – |
| L50879 | 2.509 | 292 | 425 | 8814 | – |
| RGJ0302+0010 | 2.236 | 547 | 419 | 17359 | 0.800.40 |
| Region 1 | – | 238 | 4210 | 10329 | 0.710.13 |
| Region 2 | – | 255 | 478 | 14415 | 0.130.03 |
| SMMJ04431+0210 (N4) | 2.509 | 185 | 462 | 43029 | 0.470.06 |
| Region 1 | – | 71 | 11215 | 39757 | 0.760.3 |
| Region 2 | – | 51 | 304 | 17527 | 0.060.10 |
| SMMJ2135-0120 | 2.323 | 242 | 624 | 12716 | 0.150.02 |
| Region 1 | – | 102 | 624 | 12716 | 0.150.02 |
| Region 2 | – | 153 | 7611 | 8526 | 0.180.10 |
| Region 3 | – | 61 | 242 | 484.7 | 0.130.10 |
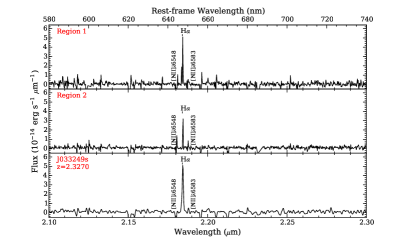
Figure 2 shows the extracted 1-D spectra for the six sources in our sample detected by our SINFONI observations. The spectra were obtained using the pseudo-longslits defined in the source images shown in Figure 1. The redshift of each source was confirmed by the detection of the H emission line. For the undetected sources, J033219 and J033212 we derived the 3 H flux upper limits by measuring the noise properties of the continuum regions surrounding the expected wavelengths of the lines based on the redshift values provided by Casey et al. (2011).
For the detected sources, we then used these spectra to classify each spatially-resolved region as dominated by either AGN or star-formation using the classification scheme based on emission line ratios of Kewley et al. (2006). Ideally, this is done using a combination of line ratios such as [NII]/H and [OIII]/H. However, in this case only the H and [NII] emission lines are available in our SINFONI data. Hence, we adopt a [NII]/H0.7 flux ratio for sources or regions classified as AGN dominated, based on the Kewley et al. (2006) classification scheme.
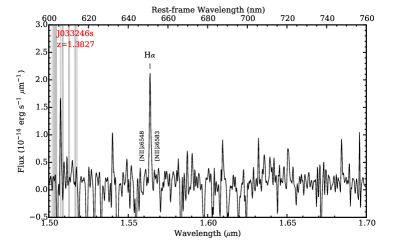
J033246
From the SINFONI H-band spectrum of J033246 we derive a redshift of =1.383 based on the H and [NII]6583 lines, fully consistent with the value reported by Casey et al. (2011) of =1.382 from VLT/ISAAC observations. The intrinsic H line width is 13038 km s-1, in line with the value previously reported by Casey et al. (2011) of 15070 kms-1. The rest-frame [NII]/H line flux ratio is 0.130.01, also in accord with the value found by Casey et al. (2011), which suggests that J033246 is consistent with star-forming activity. Starting from the measured spatially-integrated H line flux, and assuming that it is entirely due to star formation, we can estimate the star formation rate for J033246 using the relation reported by Kennicutt (1998):
| (1) |
We find a SFR of 264 M⊙yr-1. Using the measured size and derived SFR, we compute a star formation rate surface of =0.5 M⊙yr-1kpc-2.
J033249
For J033249 we measure a redshift of =2.327 based on the H and [NII]6583 lines. The rest frame [NII]/H line flux ratio is 0.1440.02, fully consistent with the value reported by Casey et al. (2011) of 0.140.10, while for H we find a FWHM of 31030 km s-1, consistent with the value of 36050 km s-1 reported by Casey et al. (2011). From the observed H flux we derive a SFR of 13217 M⊙yr-1. Using these estimates, we compute a star formation rate surface density of =7.9 M⊙yr-1kpc-2.
L50879
In the case of L50879, we measure a redshift of 2.5097 from the H and [NII]6583 lines. The measured rest-frame [NII]/H line flux ratio is 0.30.7, suggesting that L50879 is dominated by star-forming activity. The intrinsic H line width is 425 km s-1. From the integrated H emission of the galaxy we derive a SFR of 608 M⊙yr-1. We then compute a star formation rate surface density of =2.4 M⊙yr-1kpc-2.
RGJ0302+0010
For RGJ0302+0010 we derive a redshift of =2.237 based on the H and NII6583 lines. Similar results were reported previously using Keck/NIRSPEC and VLT/ISAAC (Swinbank et al., 2004) and NIFS at Gemini-North (Harrison et al., 2012). The intrinsic FWHM of H is 18859 km s-1. The rest frame [NII]/H line flux ratio is measured to be 0.80.4, marginally suggesting the presence of AGN activity. This is consistent with the values found by Chapman et al. (2004) and Swinbank et al. (2004) of 1.10.4. Similarly, the value of (O[III]/H)=0.970.13 (O[III]/H=9.31.3) previously found by Harrison et al. (2012), further confirms this conclusion regarding the AGN activity in this galaxy. From the galaxy-wide integrated H emission we derive an SFR of 13620 M⊙yr-1, assuming that the H is only due to star formation, which as we discussed above is unlikely to be the case. Region 1 has [NII]/H=0.710.13 and a line ratio [O III]/H=93 indicating that this this is the region where the AGN is located, while Region 2 has [NII]/H=0.130.03, likely suggesting that it is dominated by star-forming activity. The SFR derived from the H line emission is 7520 M⊙yr-1 for Region 1, and 10514 M⊙yr-1 for Region 2. Using these estimates of the sizes of H and SFR derived from the H emission, we compute the star formation rate surface densities and find =17 M⊙yr-1kpc-2 for Region 1 and =5.7 M⊙yr-1kpc-2 for Region 2.
SMMJ04431+0210 (N4)
For SMMJ04431+0210 (N4) we derive a redshift of =2.5095 based on the H and [NII]6583 lines, similar to the value found by Frayer et al. (2003) of =2.5092 from Keck/NIRSPEC observations. The SINFONI K-band spectrum, presented in Fig. 2, shows a strong H line with a FWHM of 43729 km s-1, somewhat smaller than the value reported by Frayer et al. (2003) of 52040 km s-1, and larger than the measurement by Neri et al. (2003) of 35060 km s-1. The observed [NII]6583 line is narrower, having an intrinsic FWHM of 16528 km s-1. The observed [NII]6583/H flux ratio is 0.470.06.
We find a SFR of 7720 M⊙yr-1 (uncorrected for lensing magnification), and 17.54.8 M⊙yr-1 corrected for lensing magnification, assuming an amplification factor of =4.4 as measured by Smail et al. (1999). We find that region 1 is consistent with ionization due to an AGN, given the observed flux ratio of [NII]/H=0.760.3 and a SFR of 303.7 M⊙yr-1, while region 2 is probably dominated by star formation processes, as it has a flux ratio of [NII]/H=0.060.1 and SFR of 202.9 M⊙yr-1, all of them uncorrected for lensing magnification. Combining the H SFR with the observed sizes of each region we can compute SFR surface densities of SFR of 2.3 M⊙yr-1kpc-2 for the entire galaxy, SFR=2.4 M⊙yr-1kpc-2 for region 1 and SFR=7.9 M⊙yr-1kpc-2 for region 2.
SMMJ2135-0102
Figure 2 shows the extracted one-dimensional K-band spectrum for each of the three regions in SMMJ2135 and the galaxy-wide integrated spectrum. We confirm the redshift of the source at =2.323 based on the H and [NII]6583 lines, consistent with the value found by (Swinbank et al., 2010) of =2.3259 based on GBT/Zpectrometer Observations of CO lines. The overall [NII]/H line flux ratio is found to be 0.150.02 suggesting that the observed emission lines are dominated by star formation activity. From the integrated H emission we derive a SFR of 824 M⊙yr-1, uncorrected for lensing magnification and extinction. We measure star formation rates of 337 M⊙yr-1, 548 M⊙yr-1 and 203 M⊙yr-1 for regions Y1, Y2 and 3 respectively. Using these estimates of the sizes of H present in the previous section and SFR from H emission for these regions we derive star formation rate surface of =16.8 M⊙yr-1kpc-2 for region Y1, =37.5 M⊙yr-1kpc-2 for region Y2, and =40.8 M⊙yr-1kpc-2 for region 3.
3.3. Velocity Maps
In addition to the identification and redshift measurements of the galaxy responsible for the sub-mm emission, the VLT/SINFONI data cubes can be also used to study their dynamical properties.Velocity fields and velocity dispersion maps are measured from the shift in observed wavelength and the width of the H line across each source. Figure 3 shows the H velocity maps for four of our targets: J033246, RGJ0302+0010, SMMJ04431+0210 (N4), and SMMJ2135-0102. For the two remaining sources, J033249 and L50879, the signal to noise ratio of the H line was not high enough to produce a velocity map.
J033246 has the most symmetric velocity field, showing some evidence of rotation, with a gradient of 250 km/s from one side to the opposite. SMMJ04431+0210 (N4) is clearly irregular, both in the flux distribution and velocity profile, with no evidence of ordered motions. Finally, both RGJ0302+0010 and SMMJ2135-0102 present a clumpy structure, with no signs of ordered motions.
In about half of the targets in our sample, J033246, RGJ0302+0010, SMMJ04431+0210 (N4) and SMMJ2135-0102, we find velocity offsets of few 100 km s-1 between distinct galactic-scale regions, with irregular kinematics. These velocity offsets could be explained by invoking a merger scenario, as presented by e.g., Engel et al. (2010). This is also supported by the clearly disrupted morphologies shown by the deep HST images available for these sources. Evidence for a connection between high luminosity SMGs and major mergers has been previously and extensively reported in the literature (e.g., Smail et al., 1998, 2004; Ivison et al., 2010; Swinbank et al., 2010; Alaghband-Zadeh et al., 2012).
4. Discussion
4.1. H Morphologies
We have spatially mapped the H line emission for a sample of six high-redshift luminous SMGs. As presented in Section 3.1, the H morphologies in our sample tend to be irregular and/or clumpy. We measure the H emission to be extended on scales 4 kpc, with an average H half-light radius of r1/2=3.21.8 kpc. These sizes are in good agreement with previous, seeing-limited measurements of the extent of SMGs in H (4–16 kpc; Menéndez-Delmestre et al., 2013; Alaghband-Zadeh et al., 2012) and nebular lines (4–11 kpc; Swinbank et al., 2006). Similarly, recent high-resolution measurements (0.3′′) using the Atacama Large Millimeter Array (ALMA) 870 m of 52 bright SMGs in the Ultra Deep Survey (UDS) field reported by Simpson et al. (2015a) yielded a median physical half-light diameter of 2.40.2 kpc. However using HST/WFC3, Chen et al. (2015) reported a median half-light radius of 4.4 kpc for a sample of 48 bright SMGs in the Extended Chandra Deep Field South (ECDF-S). Our H size measurements are also consistent with the expectations based on theoretical simulations of mergers with high gas fractions (e.g., Mihos, 1999; Narayanan et al., 2010).
For three galaxies in our sample, we were able to resolve the H emission into two or more galactic-scale extensions/components on 0.5-1.5 arcsec (3-11 kpc) scales. In two of these three systems we were able to identify possible signs of AGN activity based on the observed [NII]/H flux ratio. Previous IFU studies of SMGs have targeted galaxies showing AGN signatures in their H spectra (Menéndez-Delmestre et al., 2013), while just two systems in our sample display clear H AGN signatures.
In the remaining sources in our sample we find undisturbed morphologies, with extended spatial extensions (size 8-11 kpc) of narrow-line H emission that contribute a significant fraction (40%-90%) of the galaxy-wide H emission. Furthermore, we also find a lower [NII]/H flux ratio, thus strongly suggesting that the H component in these systems is associated with star-forming activity. High-resolution radio continuum observations (Chapman et al., 2004; Biggs & Ivison, 2008) found spatial extensions of 8-10 kpc in diameter, while a high-resolution far-IR study by Younger et al. (2010) revealed that this emission typically extends out to spatial scales in the range of 5-8 kpc. In high-resolution observations of a range of CO transitions (e.g., Engel et al., 2010; Ivison et al., 2011; Tacconi et al., 2006, 2008; Hainline et al., 2006), the size measurements of SMGs from CO fluxes are in the range of 1-16 kpc.
Our results indicate that the SMG clumps in our sample have high star formation surface densities (Section 3.2), close to those found in local extreme environments, such as in circum-nuclear starbursts and luminous infrared galaxies. In some of our targets, the H distribution appears to be offset from the observed-frame near-IR continuum emission traced by SINFONI and HST observations. Considering the much greater spatial extents found for these SMGs ( 3-11 kpc) in comparison to the 1-kpc sized nuclear starbursts (Kennicutt, 1998) and the 100 pc starburst regions observed in local ULIRGs (e.g., Scoville et al., 2000), SMGs appear to be undergoing this intense activity over much larger spatial scales. This is well in line with similar conclusions reported by several studies in the past (Swinbank et al., 2006; Alaghband-Zadeh et al., 2012; Menéndez-Delmestre et al., 2013).
4.2. Kinemetry Analysis
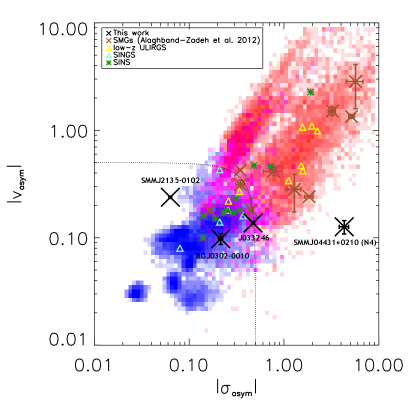
As described in Section 3.3, the SMGs studied in this work present a wide range of H kinematical properties. In order to establish if the motions observed in these galaxies are dominated by ordered (e.g., rotation) or random (as caused by e.g., a recent major galaxy merger) dynamics, we employ kinemetry analysis. This is done by measuring the level of symmetry in the mean of the velocity and the velocity dispersion fields. The kinemetry measurement procedure described by Shapiro et al. (2008) uses the method detailed in Krajnović et al. (2006) to analyze maps of kinematic moments based on the line-of-sight-velocity distribution. This can be considered as an extension of the surface photometry to the higher-order moments of the velocity distribution. This technique was developed to study stellar dynamics of local ellipticals (Copin et al., 2001), but has been extended to the dynamics of high- galaxies (e.g., Förster Schreiber et al., 2009). More recently, Alaghband-Zadeh et al. (2012) used a technique based on measuring velocity and velocity dispersion asymmetries in order to establish if galaxies are dominated by rotation or random motions. They applied this technique to SMGs similar to the ones in our sample.
Asymmetries in moment fields are measured by fitting ellipses, varying the position angle and ellipticity, to the velocity and dispersion fields. These coefficients, vasym and asym, are used to establish the level of asymmetry. The two asymmetry measures are combined as Kasym = . Following the definition of Alaghband-Zadeh et al. (2012), systems with Kasym0.5 are classified as mergers. Any asymmetries in these fields represent deviations from the idealized model (a rotating thin disk) and as such the combined asymmetry of the two fields can fully describe how accurately a system is represented by this idealized disk. This model displays an ordered velocity field, peaking at the semi-major axis of the ellipse and reaching a value of zero at the semi-minor axis, and a centrally peaked velocity dispersion field.
In Fig. 4 we compare the levels of asymmetry in the velocity and velocity dispersion for the four SMGs in our sample for which velocity maps were obtained. As can be seen on that figure, and perhaps surprisingly, 3/4 of the galaxies in the SMG sample (J033246, RGJ0302+0010 and SMMJ2135-0102) are found in the region where disk-dominated sources are located. This is somewhat expected for J033246, since as discussed above, this source appears to be dominated by rotation. The other two sources appear to be clumpy in their H morphologies, which might explain why their asymmetry values are lower than expected, as each individual clump is spatially unresolved and thus does not show significant asymmetries. Hence, their classifications based on the derived asymmetry values are probably explained by the limitations of the spatial resolution of our observations. Finally, SMMJ04431+0210 (N4) clearly shows very high asymmetry levels, as can be seen in Figure 3. Therefore, it is not surprising that this source is also classified as “merger-dominated” in this diagram. Hence, the kinemetry analysis also suggests that most of these sources are dominated by random motions. This is in line with previous observations of similar high-luminosity IR and sub-mm galaxies at 2, such as those reported by Alaghband-Zadeh et al. (2012) and Menéndez-Delmestre et al. (2013) among others. A recent analysis presented by Hung et al. (2015), which takes a sample of local IR-luminous galaxies and artificially redshifts their H IFU data, shows that post-coalescence mergers may also display kinematics that can be wrongly classified as “disk like”, as appears to be the case for some of our sources.
4.3. H Star Formation Rates
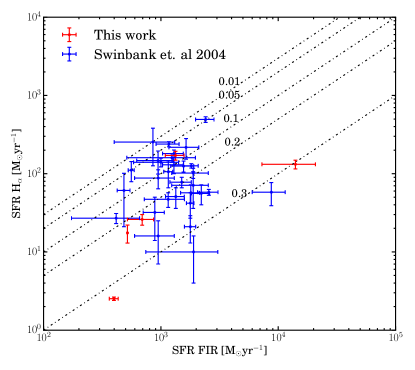
We now compare the star formation rates for the galaxies in our sample, previously derived from far-IR observations, with those obtained from the H observations described here. The implied star formation rates, including those derived from IR observations obtained from the literature are presented in Table 3. Specifically, we use the values reported by Casey et al. (2011) for J033246 and J033249 from Spitzer-MIPS, BLAST and LABOCA observations. For RGJ0302+0010 the values were derived by Swinbank et al. (2004) fitting model spectral energy distributions (SEDs) to the observed 850 m and 1.4 GHz fluxes assuming that the local far-IR/radio correlation (Condon et al., 1991; Garrett, 2002) holds at higher redshifts. For SMMJ04331+0210 we used the values obtained by Neri et al. (2003) from observed 850m flux densities and assuming a modified grey-body model (T=40 K) and a frequency-dependent emissivity. Finally, for SMMJ2135-0120 values were derived by Ivison et al. (2010) from Herschel, SCUBA-2, VLA and APEX observations. Both SFR measurements for SMMJ2135-0120 were corrected for lensing magnification assuming a factor of =32.54.5 (Swinbank et al., 2010), while a magnification factor of =4.4 (Smail et al., 1999) was assumed for SMMJ04431+0210 (N4). It should be noted that using the same lensing magnification for the H and FIR fluxes is not ideal, as these emissions might come from slightly different regions and thus might present small variations in their magnifications.
In Figure 5, we compare the SFR derived from the H luminosity with the FIR SFRs for the galaxies in our sample, without correcting the H measurements for extinction. We also include in this comparison a sample of 30 high-redshift far-infrared luminous galaxies from Swinbank et al. (2004). The H determined SFRs are significantly lower than the values determined from the IR luminosity, by factors of 3-5. This is most likely explained by both the presence of large amounts of dust obscuration in these systems and if there are fully-dust-obscured SF regions in the galaxy that do not contribute much to the Balmer emission lines. Unfortunately, the wavelength coverage of our spectroscopic observations does not extend to the emission line, and thus the reddening in these galaxies cannot be estimated directly from the Balmer decrement, which would test this hypothesis. However, if we assume an average extinction value of Av=2.90.5, as previously used by Swinbank et al. (2004) and measured by Takata et al. (2006), we find that the extinction-corrected H SFRs are in good agreement with those derived from the IR. The scatter seen in Figure 5 could be explained by a combination of the fact that most of the star formation in these galaxies is not occurring in fully-dust-obscured regions, and due to the morphological diversity of sub-mm/ULIRGs-selected galaxies.
Estimates of the SFR from the H flux in SMGs retain the substantial caveat that in the presence of an AGN, the blended nuclear emission may result in the broadening and brightening of the H emission, potentially leading to overestimates of the SFR. Due to the large gas and dust reservoirs of SMGs, which could potentially provide ample fuel to trigger an AGN that could contaminate our estimates of SFR and SFR. However, we note that only two sources in our sample show some evidence for the presence of an AGN, either via elevated [NII]/H ratios or a broad line component. Previous IFU studies of SMGs have mainly targeted galaxies showing strong AGN signatures in their H spectra (Menéndez-Delmestre et al., 2013), whereas the majority of our sample does not display clear H AGN signatures. In SMGs, AGN were found to only contribute at low levels (20%) to the bolometric output (Alexander et al., 2008). However, even if an AGN is not dominating the bolometric output it may still affect the H distribution and dynamics, being energetic enough to drive ionized gas over scales of a few kpc (Nesvadba et al., 2008).
| Name | SFR(H)aaSFR(H) derived from the observed LHα using the relation SFR(H) = 7.9 10-42 LHα [erg s-1] (Kennicutt, 1998). SFR(H) values are not corrected for extinction. | SFR(FIR)bbFar-IR luminosities are converted to SFR(FIR) using the relation SFR(FIR) = 4.5 10-44 LFIR [erg s-1] (Kennicutt, 1998). The SFR(FIR) of SMMJ2135-0120 and SMMJ04431+0210 (N4) are corrected for lensing magnification, assuming magnification factors of =32.54.5 (Swinbank et al., 2010) and =4.4 (Smail et al., 1999), respectively. | rHα | SFR(Hα) | Kasym |
|---|---|---|---|---|---|
| [M⊙yr-1] | [M⊙yr-1] | [kpc] | [M⊙yr-1kpc-2]ccSurface densities within rHα, determined, for instance, as: . | ||
| J033246 | 264 | 692 | 14.5 | 0.5 | 0.49260.0106 |
| J033249 | 13217 | 14084 | 8.2 | 7.9 | – |
| Region 1 | 586 | – | 6.8 | 5.0 | – |
| Region 2 | 4614 | – | 5.8 | 5.5 | – |
| RGJ0302+0010 | 17122 | 1340 | – | – | 0.23800.0174 |
| Region 1 | 7325 | – | 4.2 | 17.0 | – |
| Region 2 | 7516 | – | 3.2 | 5.7 | – |
| L50879 | 608 | – | 10 | 2.4 | – |
| SMMJ04431+0210 (N4) | 7720 | 520 | 11.5 | 2.3 | 4.32570.4890 |
| Region 1 | 304 | – | 7.0 | 2.4 | – |
| Region 2 | 203 | – | 3.9 | 7.9 | – |
| SMMJ2135-0120 | 824 | 398 | – | – | 0.24610.0018 |
| Region 1 | 337 | – | 2.8 | 16.8 | – |
| Region 2 | 548 | – | 2.4 | 37.5 | – |
| Region 3 | 203 | – | 1.4 | 40.8 | – |
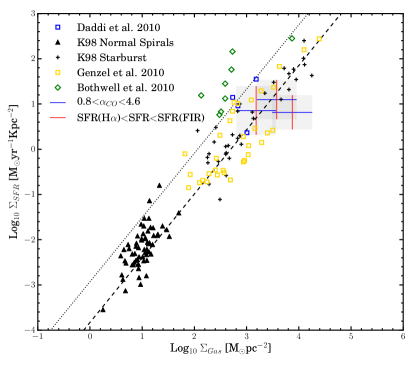
4.4. Schmidt-Kennicutt Relation
We now use the H-derived sizes for these SMGs to compare the SFR surface densities determined from H and FIR luminosities with the molecular gas surface density. Two of our sources have previously been observed in CO. Due to the uncertainties in the conversion between L’CO(1-0) and the H2 mass (e.g., Bolatto et al., 2013), we consider both values of 4.6 and 0.8 K km s-1 pc-2 -1, corresponding to spiral galaxies (Solomon & Barrett, 1991) and to ULIRGs & star-forming galaxies at high redshift (Solomon & Vanden Bout, 2005), respectively.
For SMMJ04431+0210 (N4) we considered a line luminosity L’CO(1-0) 1.00.2 1010 K km s-1pc-2 (corrected for the lensing magnification), and CO diameter of 1.8 kpc, as reported by Neri et al. (2003). With these measurements, we compute gas surface densities for =0.8 and =4.6 of 3.1103 M⊙pc-2 and 18 103 M⊙pc-2 respectively.
For the galaxy SMMJ2135-0120 we use the line luminosities L’CO(1-0) reported by Swinbank et al. (2011) based on EVLA observations, corrected for lensing magnification. The reported luminosities are (3.9 0.4)108 K km s-1pc-2 for region Y1 and (7.1 0.8)108K km s-1pc-2 for region Y2. We use the H size measurements of 1.4 kpc for Region Y1 and 1.2 kpc for Region Y2. Then, we derive gas surface densities, assuming =0.8 and =4.6, of 6.3102 M⊙pc-2 and 3.6103 M⊙pc-2 for region Y1 and 1.5 103 M⊙pc-2 and 9103 M⊙pc-2 for region Y2, respectively and corrected for lensing magnification. For the other four sources, J033246, J033249, RGJ0302+0010 and L50879, there are no observations of CO emission available so far.
Figure 6 shows the gas surface density versus the SFR surface density for the sources in our sample along with local and high-z sources from the literature. The values from the literature were taken directly from each publication. As can be seen in Figure 6, in all three sources for which we could measure gas and (SFR), they appear to be slightly below (but consistent) with the relation derived for local and high redshift star forming galaxies (e.g., Kennicutt, 1997; Genzel et al., 2010). This is in contrast with previous results reported by Daddi et al. (2010a) and Genzel et al. (2010, 2015), who found a higher relation for both local and high redshift ULIRGs and SMG. While here we do not attempt to correct the values previously reported for different assumed values, for our sources we assume a wide range of , from 0.8 to 4.6, finding that our sources still fall below the ULIRG and SMG relation and appear to be consistent with that for normal SFGs. While this is certainly interesting, it is hard to reach stronger conclusions given the small sample studied here and the lack of high resolution CO data. Work to increase the number of sources in our sample and to obtain ALMA observations for them is currently being carried out.
5. Conclusions
In this paper we used the VLT/SINFONI integral field spectrometer to study, at high resolution, the spatial distribution and kinematics of eight SMGs at 1.32.5 using the H emission line as a tracer. These observations allow us to study the gas dynamics and morphologies for six sources in our sample for which the H line was detected at sufficient signal to noise ratio.
Overall, we find that these SMGs have highly irregular and/or clumpy morphologies. The H emission has relatively large spatial extent, kpc, with a mean value for our sample of rHα= 6.4 kpc, in contrast to local ULIRGs, which tend to be more compact. We find that in three cases the H emission is significantly offset from the observed-frame near-IR continuum emission derived from the SINFONI and HST images.
We then analyzed the velocity and velocity dispersion fields in this sample, finding that these SMGs in general show large velocity gradients across each system. The majority of the SMGs in our sample are not consistent with being disk-like systems dominated by rotation and instead present irregular and turbulent or clumpy velocity and velocity dispersion fields, which could be explained by a recent major merger. We find that of the six SMGs with resolved spectroscopy, at least three appear to comprised of two or more dynamical sub-components. The average velocity offsets between these components is 180 km s-1 across a projected spatial scale of 8 kpc. The obvious merging/interacting nature of these systems suggests that they are analogous to the typically less luminous and slightly more compact ULIRGs in the local Universe. This is confirmed by a kinemetry analysis performed for the sources in our sample, which suggests that most of them do not show strong evidence for the presence of ordered motions.
The SMGs in our sample display high SFR surface densities (SFR), similar to those found in the most extreme local environments, such as circum-nuclear starbursts and IR-luminous galaxies but over larger spatial extents. Our IFU observations allow us to disentangle AGN and starburst-like components (from [N II]/H flux ratios). Two of our targets (RJ0302-0010 and SMMJ04431+0210 (N4)) show possible signs of AGN activity surrounded by star-forming regions/clumps. We then further confirm that these extreme SMGs at high- appear to follow the same star-formation scaling relations as less luminous “normal” star forming galaxies. SMGs in our Group B sample are the only ones which present evidence for AGN activity. Therefore the data do not support the hypothesis that the AGN leads to hotter dust, at least for the sources in our Group A, which contain the warm-dust ULIRGs.
While still very expensive and limited in sample size, rest-frame optical IFU observations of high- extreme star-forming galaxies are starting to reveal the details of the violent star formation episodes in the early Universe. In the near future, such studies will be possible for much larger samples thanks to e.g., the KMOS multi-object IFU spectrograph at the VLT. In addition, ALMA observations will allow studies of the molecular gas contents, fuel for both star formation and for the central supermassive black holes, for these galaxies.
References
- Alaghband-Zadeh et al. (2012) Alaghband-Zadeh, S., Chapman, S. C., Swinbank, A. M., Smail, I., Harrison, C. M., Alexander, D. M., Casey, C. M., Davé, R., Narayanan, D., Tamura, Y., & Umehata, H. 2012, MNRAS, 424, 2232
- Alexander et al. (2005) Alexander, D. M., Bauer, F. E., Chapman, S. C., Smail, I., Blain, A. W., Brandt, W. N., & Ivison, R. J. 2005, ApJ, 632, 736
- Alexander et al. (2008) Alexander, D. M., Chary, R.-R., Pope, A., Bauer, F. E., Brandt, W. N., Daddi, E., Dickinson, M., Elbaz, D., & Reddy, N. A. 2008, ApJ, 687, 835
- Barger et al. (2012) Barger, A. J., Wang, W.-H., Cowie, L. L., Owen, F. N., Chen, C.-C., & Williams, J. P. 2012, ApJ, 761, 89
- Bauer et al. (2010) Bauer, F. E., Yan, L., Sajina, A., & Alexander, D. M. 2010, ApJ, 710, 212
- Biggs & Ivison (2008) Biggs, A. D. & Ivison, R. J. 2008, MNRAS, 385, 893
- Blain et al. (2004) Blain, A. W., Chapman, S. C., Smail, I., & Ivison, R. 2004, ApJ, 611, 52
- Blain et al. (1999) Blain, A. W., Smail, I., Ivison, R. J., & Kneib, J.-P. 1999, MNRAS, 302, 632
- Bolatto et al. (2013) Bolatto, A. D., Wolfire, M., & Leroy, A. K. 2013, ARA&A, 51, 207
- Bothwell et al. (2010) Bothwell, M. S., Chapman, S. C., Tacconi, L., Smail, I., Ivison, R. J., Casey, C. M., Bertoldi, F., Beswick, R., Biggs, A., Blain, A. W., Cox, P., Genzel, R., Greve, T. R., Kennicutt, R., Muxlow, T., Neri, R., & Omont, A. 2010, MNRAS, 405, 219
- Bothwell et al. (2015) Bothwell, M. S., Maiolino, R., Peng, Y., Cicone, C., Griffith, H., & Wagg, J. 2015, ArXiv e-prints
- Bothwell et al. (2013) Bothwell, M. S., Smail, I., Chapman, S. C., Genzel, R., Ivison, R. J., Tacconi, L. J., Alaghband-Zadeh, S., Bertoldi, F., Blain, A. W., Casey, C. M., Cox, P., Greve, T. R., Lutz, D., Neri, R., Omont, A., & Swinbank, A. M. 2013, MNRAS, 429, 3047
- Bouché et al. (2007) Bouché, N., Cresci, G., Davies, R., Eisenhauer, F., Förster Schreiber, N. M., Genzel, R., Gillessen, S., Lehnert, M., Lutz, D., Nesvadba, N., Shapiro, K. L., Sternberg, A., Tacconi, L. J., Verma, A., Cimatti, A., Daddi, E., Renzini, A., Erb, D. K., Shapley, A., & Steidel, C. C. 2007, ApJ, 671, 303
- Casey et al. (2009) Casey, C. M., Chapman, S. C., Beswick, R. J., Biggs, A. D., Blain, A. W., Hainline, L. J., Ivison, R. J., Muxlow, T. W. B., & Smail, I. 2009, MNRAS, 399, 121
- Casey et al. (2011) Casey, C. M., Chapman, S. C., Smail, I., Alaghband-Zadeh, S., Bothwell, M. S., & Swinbank, A. M. 2011, MNRAS, 411, 2739
- Casey et al. (2012) Casey, C. M., Berta, S., Béthermin, M., et al. 2012, ApJ, 761, 140
- Casey et al. (2014a) Casey, C. M., Narayanan, D., & Cooray, A. 2014a, Phys. Rep., 541, 45
- Casey et al. (2014b) Casey, C. M., Scoville, N. Z., Sanders, D. B., Lee, N., Cooray, A., Finkelstein, S. L., Capak, P., Conley, A., De Zotti, G., Farrah, D., Fu, H., Le Floc’h, E., Ilbert, O., Ivison, R. J., & Takeuchi, T. T. 2014b, ApJ, 796, 95
- Chapman et al. (2005) Chapman, S. C., Blain, A. W., Smail, I., & Ivison, R. J. 2005, ApJ, 622, 772
- Chapman et al. (2004) Chapman, S. C., Smail, I., Blain, A. W., & Ivison, R. J. 2004, ApJ, 614, 671
- Chen et al. (2015) Chen, C.-C., Smail, I., Swinbank, A. M., Simpson, J. M., Ma, C.-J., Alexander, D. M., Biggs, A. D., Brandt, W. N., Chapman, S. C., Coppin, K. E. K., Danielson, A. L. R., Dannerbauer, H., Edge, A. C., Greve, T. R., Ivison, R. J., Karim, A., Menten, K. M., Schinnerer, E., Walter, F., Wardlow, J. L., Weiß, A., & van der Werf, P. P. 2015, ApJ, 799, 194
- Condon et al. (1991) Condon, J. J., Anderson, M. L., & Helou, G. 1991, ApJ, 376, 95
- Copin et al. (2001) Copin, Y., Bacon, R., Bureau, M., Davies, R. L., Emsellem, E., Kuntschner, H., Miller, B., Peletier, R., Verolme, E. K., & de Zeeuw, P. T. 2001, in SF2A-2001: Semaine de l’Astrophysique Francaise, ed. F. Combes, D. Barret, & F. Thévenin, 289
- Daddi et al. (2010a) Daddi, E., Bournaud, F., Walter, F., Dannerbauer, H., Carilli, C. L., Dickinson, M., Elbaz, D., Morrison, G. E., Riechers, D., Onodera, M., Salmi, F., Krips, M., & Stern, D. 2010a, ApJ, 713, 686
- Daddi et al. (2010b) Daddi, E., Elbaz, D., Walter, F., Bournaud, F., Salmi, F., Carilli, C., Dannerbauer, H., Dickinson, M., Monaco, P., & Riechers, D. 2010b, ApJ, 714, L118
- Danielson et al. (2013) Danielson, A. L. R., Swinbank, A. M., Smail, I., Bayet, E., van der Werf, P. P., Cox, P., Edge, A. C., Henkel, C., & Ivison, R. J. 2013, MNRAS, 436, 2793
- Danielson et al. (2011) Danielson, A. L. R., Swinbank, A. M., Smail, I., Cox, P., Edge, A. C., Weiss, A., Harris, A. I., Baker, A. J., De Breuck, C., Geach, J. E., Ivison, R. J., Krips, M., Lundgren, A., Longmore, S., Neri, R., & Flaquer, B. O. 2011, MNRAS, 410, 1687
- Dunne et al. (2000) Dunne, L., Eales, S., Edmunds, M., Ivison, R., Alexander, P., & Clements, D. L. 2000, MNRAS, 315, 115
- Eisenhauer et al. (2003) Eisenhauer, F. et al. 2003, in Society of Photo-Optical Instrumentation Engineers (SPIE) Conference Series, Vol. 4841, Society of Photo-Optical Instrumentation Engineers (SPIE) Conference Series, ed. M. Iye & A. F. M. Moorwood, 1548–1561
- Engel et al. (2010) Engel, H., Davies, R. I., Genzel, R., Tacconi, L. J., Hicks, E. K. S., Sturm, E., Naab, T., Johansson, P. H., Karl, S. J., Max, C. E., Medling, A., & van der Werf, P. P. 2010, A&A, 524, A56
- Förster Schreiber et al. (2009) Förster Schreiber, N. M., Genzel, R., Bouché, N., Cresci, G., Davies, R., Buschkamp, P., Shapiro, K., Tacconi, L. J., Hicks, E. K. S., Genel, S., Shapley, A. E., Erb, D. K., Steidel, C. C., Lutz, D., Eisenhauer, F., Gillessen, S., Sternberg, A., Renzini, A., Cimatti, A., Daddi, E., Kurk, J., Lilly, S., Kong, X., Lehnert, M. D., Nesvadba, N., Verma, A., McCracken, H., Arimoto, N., Mignoli, M., & Onodera, M. 2009, ApJ, 706, 1364
- Frayer et al. (2003) Frayer, D. T., Armus, L., Scoville, N. Z., Blain, A. W., Reddy, N. A., Ivison, R. J., & Smail, I. 2003, AJ, 126, 73
- Frayer et al. (1999) Frayer, D. T., Ivison, R. J., Scoville, N. Z., Evans, A. S., Yun, M. S., Smail, I., Barger, A. J., Blain, A. W., & Kneib, J.-P. 1999, ApJ, 514, L13
- Garrett (2002) Garrett, M. A. 2002, A&A, 384, L19
- Genzel et al. (2010) Genzel, R., Tacconi, L. J., Gracia-Carpio, J., Sternberg, A., Cooper, M. C., Shapiro, K., Bolatto, A., Bouché, N., Bournaud, F., Burkert, A., Combes, F., Comerford, J., Cox, P., Davis, M., Schreiber, N. M. F., Garcia-Burillo, S., Lutz, D., Naab, T., Neri, R., Omont, A., Shapley, A., & Weiner, B. 2010, MNRAS, 407, 2091
- Genzel et al. (2015) Genzel, R., Tacconi, L. J., Lutz, D., Saintonge, A., Berta, S., Magnelli, B., Combes, F., García-Burillo, S., Neri, R., Bolatto, A., Contini, T., Lilly, S., Boissier, J., Boone, F., Bouché, N., Bournaud, F., Burkert, A., Carollo, M., Colina, L., Cooper, M. C., Cox, P., Feruglio, C., Förster Schreiber, N. M., Freundlich, J., Gracia-Carpio, J., Juneau, S., Kovac, K., Lippa, M., Naab, T., Salome, P., Renzini, A., Sternberg, A., Walter, F., Weiner, B., Weiss, A., & Wuyts, S. 2015, ApJ, 800, 20
- Greve et al. (2005) Greve, T. R., Bertoldi, F., Smail, I., Neri, R., Chapman, S. C., Blain, A. W., Ivison, R. J., Genzel, R., Omont, A., Cox, P., Tacconi, L., & Kneib, J.-P. 2005, MNRAS, 359, 1165
- Gruppioni et al. (2013) Gruppioni, C., Pozzi, F., Rodighiero, G., Delvecchio, I., Berta, S., Pozzetti, L., Zamorani, G., Andreani, P., Cimatti, A., Ilbert, O., Le Floc’h, E., Lutz, D., Magnelli, B., Marchetti, L., Monaco, P., Nordon, R., Oliver, S., Popesso, P., Riguccini, L., Roseboom, I., Rosario, D. J., Sargent, M., Vaccari, M., Altieri, B., Aussel, H., Bongiovanni, A., Cepa, J., Daddi, E., Domínguez-Sánchez, H., Elbaz, D., Förster Schreiber, N., Genzel, R., Iribarrem, A., Magliocchetti, M., Maiolino, R., Poglitsch, A., Pérez García, A., Sanchez-Portal, M., Sturm, E., Tacconi, L., Valtchanov, I., Amblard, A., Arumugam, V., Bethermin, M., Bock, J., Boselli, A., Buat, V., Burgarella, D., Castro-Rodríguez, N., Cava, A., Chanial, P., Clements, D. L., Conley, A., Cooray, A., Dowell, C. D., Dwek, E., Eales, S., Franceschini, A., Glenn, J., Griffin, M., Hatziminaoglou, E., Ibar, E., Isaak, K., Ivison, R. J., Lagache, G., Levenson, L., Lu, N., Madden, S., Maffei, B., Mainetti, G., Nguyen, H. T., O’Halloran, B., Page, M. J., Panuzzo, P., Papageorgiou, A., Pearson, C. P., Pérez-Fournon, I., Pohlen, M., Rigopoulou, D., Rowan-Robinson, M., Schulz, B., Scott, D., Seymour, N., Shupe, D. L., Smith, A. J., Stevens, J. A., Symeonidis, M., Trichas, M., Tugwell, K. E., Vigroux, L., Wang, L., Wright, G., Xu, C. K., Zemcov, M., Bardelli, S., Carollo, M., Contini, T., Le Févre, O., Lilly, S., Mainieri, V., Renzini, A., Scodeggio, M., & Zucca, E. 2013, MNRAS, 432, 23
- Hainline et al. (2006) Hainline, L. J., Blain, A. W., Greve, T. R., Chapman, S. C., Smail, I., & Ivison, R. J. 2006, ApJ, 650, 614
- Harrison et al. (2012) Harrison, C. M., Alexander, D. M., Swinbank, A. M., Smail, I., Alaghband-Zadeh, S., Bauer, F. E., Chapman, S. C., Del Moro, A., Hickox, R. C., Ivison, R. J., Menéndez-Delmestre, K., Mullaney, J. R., & Nesvadba, N. P. H. 2012, MNRAS, 426, 1073
- Hinshaw et al. (2009) Hinshaw, G. et al. 2009, ApJS, 180, 225
- Hopkins et al. (2008) Hopkins, P. F., Hernquist, L., Cox, T. J., & Kereš, D. 2008, ApJS, 175, 356
- Hughes et al. (1998) Hughes, D. H., Serjeant, S., Dunlop, J., Rowan-Robinson, M., Blain, A., Mann, R. G., Ivison, R., Peacock, J., Efstathiou, A., Gear, W., Oliver, S., Lawrence, A., Longair, M., Goldschmidt, P., & Jenness, T. 1998, Nature, 394, 241
- Hung et al. (2015) Hung, C.-L., Rich, J. A., Yuan, T., Larson, K. L., Casey, C. M., Smith, H. A., Sanders, D. B., Kewley, L. J., & Hayward, C. C. 2015, ApJ, 803, 62
- Inami et al. (2010) Inami, H., Armus, L., Surace, J. A., Mazzarella, J. M., Evans, A. S., Sanders, D. B., Howell, J. H., Petric, A., Vavilkin, T., Iwasawa, K., Haan, S., Murphy, E. J., Stierwalt, S., Appleton, P. N., Barnes, J. E., Bothun, G., Bridge, C. R., Chan, B., Charmandaris, V., Frayer, D. T., Kewley, L. J., Kim, D. C., Lord, S., Madore, B. F., Marshall, J. A., Matsuhara, H., Melbourne, J. E., Rich, J., Schulz, B., Spoon, H. W. W., Sturm, E., U, V., Veilleux, S., & Xu, K. 2010, AJ, 140, 63
- Ivison et al. (2011) Ivison, R. J., Papadopoulos, P. P., Smail, I., Greve, T. R., Thomson, A. P., Xilouris, E. M., & Chapman, S. C. 2011, MNRAS, 412, 1913
- Ivison et al. (2010) Ivison, R. J., Swinbank, A. M., Swinyard, B., Smail, I., Pearson, C. P., Rigopoulou, D., Polehampton, E., Baluteau, J.-P., Barlow, M. J., Blain, A. W., Bock, J., Clements, D. L., Coppin, K., Cooray, A., Danielson, A., Dwek, E., Edge, A. C., Franceschini, A., Fulton, T., Glenn, J., Griffin, M., Isaak, K., Leeks, S., Lim, T., Naylor, D., Oliver, S. J., Page, M. J., Pérez Fournon, I., Rowan-Robinson, M., Savini, G., Scott, D., Spencer, L., Valtchanov, I., Vigroux, L., & Wright, G. S. 2010, A&A, 518, L35
- Johnson et al. (2013) Johnson, S. P., Wilson, G. W., Wang, Q. D., Williams, C. C., Scott, K. S., Yun, M. S., Pope, A., Lowenthal, J., Aretxaga, I., Hughes, D., Kim, M. J., Kim, S., Tamura, Y., Kohno, K., Ezawa, H., Kawabe, R., & Oshima, T. 2013, MNRAS, 431, 662
- Kennicutt (1997) Kennicutt, R. C. 1997, in Astrophysics and Space Science Library, Vol. 161, Astrophysics and Space Science Library, 171–195
- Kennicutt (1998) Kennicutt, Jr., R. C. 1998, ApJ, 498, 541
- Kewley et al. (2006) Kewley, L. J., Groves, B., Kauffmann, G., & Heckman, T. 2006, MNRAS, 372, 961
- Kim & Sanders (1998) Kim, D.-C. & Sanders, D. B. 1998, ApJS, 119, 41
- Krajnović et al. (2006) Krajnović, D., Cappellari, M., de Zeeuw, P. T., & Copin, Y. 2006, MNRAS, 366, 787
- Kriek et al. (2008) Kriek, M., van Dokkum, P. G., Franx, M., Illingworth, G. D., Marchesini, D., Quadri, R., Rudnick, G., Taylor, E. N., Förster Schreiber, N. M., Gawiser, E., Labbé, I., Lira, P., & Wuyts, S. 2008, ApJ, 677, 219
- Laird et al. (2010) Laird, E. S., Nandra, K., Pope, A., & Scott, D. 2010, MNRAS, 401, 2763
- Le Floc’h et al. (2005) Le Floc’h, E. et al. 2005, ApJ, 632, 169
- Lehnert et al. (1999) Lehnert, M. D., Heckman, T. M., & Weaver, K. A. 1999, ApJ, 523, 575
- Menéndez-Delmestre et al. (2013) Menéndez-Delmestre, K., Blain, A. W., Swinbank, M., Smail, I., Ivison, R. J., Chapman, S. C., & Gonçalves, T. S. 2013, ApJ, 767, 151
- Mihos (1999) Mihos, J. C. 1999, in IAU Symposium, Vol. 186, Galaxy Interactions at Low and High Redshift, ed. J. E. Barnes & D. B. Sanders, 205
- Murphy et al. (2011) Murphy, E. J., Chary, R.-R., Dickinson, M., Pope, A., Frayer, D. T., & Lin, L. 2011, ApJ, 732, 126
- Narayanan et al. (2010) Narayanan, D., Hayward, C. C., Cox, T. J., Hernquist, L., Jonsson, P., Younger, J. D., & Groves, B. 2010, MNRAS, 401, 1613
- Neri et al. (2003) Neri, R., Genzel, R., Ivison, R. J., Bertoldi, F., Blain, A. W., Chapman, S. C., Cox, P., Greve, T. R., Omont, A., & Frayer, D. T. 2003, ApJ, 597, L113
- Nesvadba et al. (2008) Nesvadba, N. P. H., Lehnert, M. D., De Breuck, C., Gilbert, A. M., & van Breugel, W. 2008, A&A, 491, 407
- Noll et al. (2014) Noll, S., Kausch, W., Kimeswenger, S., Barden, M., Jones, A. M., Modigliani, A., Szyszka, C., & Taylor, J. 2014, A&A, 567, A25
- Sanders & Mirabel (1996) Sanders, D. B. & Mirabel, I. F. 1996, ARA&A, 34, 749
- Sanders et al. (1988) Sanders, D. B., Soifer, B. T., Elias, J. H., Madore, B. F., Matthews, K., Neugebauer, G., & Scoville, N. Z. 1988, ApJ, 325, 74
- Scoville et al. (2000) Scoville, N. Z., Evans, A. S., Thompson, R., et al. 2000, AJ, 119, 991
- Shapiro et al. (2008) Shapiro, K. L., Genzel, R., Förster Schreiber, N. M., Tacconi, L. J., Bouché, N., Cresci, G., Davies, R., Eisenhauer, F., Johansson, P. H., Krajnović, D., Lutz, D., Naab, T., Arimoto, N., Arribas, S., Cimatti, A., Colina, L., Daddi, E., Daigle, O., Erb, D., Hernandez, O., Kong, X., Mignoli, M., Onodera, M., Renzini, A., Shapley, A., & Steidel, C. 2008, ApJ, 682, 231
- Simpson et al. (2015a) Simpson, J. M., Smail, I., Swinbank, A. M., Almaini, O., Blain, A. W., Bremer, M. N., Chapman, S. C., Chen, C.-C., Conselice, C., Coppin, K. E. K., Danielson, A. L. R., Dunlop, J. S., Edge, A. C., Farrah, D., Geach, J. E., Hartley, W. G., Ivison, R. J., Karim, A., Lani, C., Ma, C.-J., Meijerink, R., Michałowski, M. J., Mortlock, A., Scott, D., Simpson, C. J., Spaans, M., Thomson, A. P., van Kampen, E., & van der Werf, P. P. 2015a, ApJ, 799, 81
- Simpson et al. (2015b) Simpson, J. M., Smail, I., Swinbank, A. M., Chapman, S. C., Geach, J. E., Ivison, R. J., Thomson, A. P., Aretxaga, I., Blain, A. W., Cowley, W. I., Chen, C.-C., Coppin, K. E. K., Dunlop, J. S., Edge, A. C., Farrah, D., Ibar, E., Karim, A., Knudsen, K. K., Meijerink, R., Michałowski, M. J., Scott, D., Spaans, M., & van der Werf, P. P. 2015b, ApJ, 807, 128
- Simpson et al. (2014) Simpson, J. M., Swinbank, A. M., Smail, I., Alexander, D. M., Brandt, W. N., Bertoldi, F., de Breuck, C., Chapman, S. C., Coppin, K. E. K., da Cunha, E., Danielson, A. L. R., Dannerbauer, H., Greve, T. R., Hodge, J. A., Ivison, R. J., Karim, A., Knudsen, K. K., Poggianti, B. M., Schinnerer, E., Thomson, A. P., Walter, F., Wardlow, J. L., Weiß, A., & van der Werf, P. P. 2014, ApJ, 788, 125
- Smail et al. (2004) Smail, I., Chapman, S. C., Blain, A. W., & Ivison, R. J. 2004, ApJ, 616, 71
- Smail et al. (1997) Smail, I., Ivison, R. J., & Blain, A. W. 1997, ApJ, 490, L5
- Smail et al. (1998) Smail, I., Ivison, R. J., Blain, A. W., & Kneib, J.-P. 1998, ApJ, 507, L21
- Smail et al. (2002) —. 2002, MNRAS, 331, 495
- Smail et al. (1999) Smail, I., Ivison, R. J., Kneib, J.-P., Cowie, L. L., Blain, A. W., Barger, A. J., Owen, F. N., & Morrison, G. 1999, MNRAS, 308, 1061
- Smail et al. (2000) Smail, I., Ivison, R. J., Owen, F. N., Blain, A. W., & Kneib, J.-P. 2000, ApJ, 528, 612
- Solomon & Barrett (1991) Solomon, P. M. & Barrett, J. W. 1991, in IAU Symposium, Vol. 146, Dynamics of Galaxies and Their Molecular Cloud Distributions, ed. F. Combes & F. Casoli, 235
- Solomon & Vanden Bout (2005) Solomon, P. M. & Vanden Bout, P. A. 2005, ARA&A, 43, 677
- Swinbank et al. (2006) Swinbank, A. M., Chapman, S. C., Smail, I., Lindner, C., Borys, C., Blain, A. W., Ivison, R. J., & Lewis, G. F. 2006, MNRAS, 371, 465
- Swinbank et al. (2011) Swinbank, A. M., Papadopoulos, P. P., Cox, P., Krips, M., Ivison, R. J., Smail, I., Thomson, A. P., Neri, R., Richard, J., & Ebeling, H. 2011, ApJ, 742, 11
- Swinbank et al. (2014) Swinbank, A. M., Simpson, J. M., Smail, I., Harrison, C. M., Hodge, J. A., Karim, A., Walter, F., Alexander, D. M., Brandt, W. N., de Breuck, C., da Cunha, E., Chapman, S. C., Coppin, K. E. K., Danielson, A. L. R., Dannerbauer, H., Decarli, R., Greve, T. R., Ivison, R. J., Knudsen, K. K., Lagos, C. D. P., Schinnerer, E., Thomson, A. P., Wardlow, J. L., Weiß, A., & van der Werf, P. 2014, MNRAS, 438, 1267
- Swinbank et al. (2004) Swinbank, A. M., Smail, I., Chapman, S. C., Blain, A. W., Ivison, R. J., & Keel, W. C. 2004, ApJ, 617, 64
- Swinbank et al. (2010) Swinbank, A. M., Smail, I., Longmore, S., Harris, A. I., Baker, A. J., De Breuck, C., Richard, J., Edge, A. C., Ivison, R. J., Blundell, R., Coppin, K. E. K., Cox, P., Gurwell, M., Hainline, L. J., Krips, M., Lundgren, A., Neri, R., Siana, B., Siringo, G., Stark, D. P., Wilner, D., & Younger, J. D. 2010, Nature, 464, 733
- Swinbank et al. (2012) Swinbank, A. M., Smail, I., Sobral, D., Theuns, T., Best, P. N., & Geach, J. E. 2012, ApJ, 760, 130
- Tacconi et al. (2010) Tacconi, L. J., Genzel, R., Neri, R., Cox, P., Cooper, M. C., Shapiro, K., Bolatto, A., Bouché, N., Bournaud, F., Burkert, A., Combes, F., Comerford, J., Davis, M., Schreiber, N. M. F., Garcia-Burillo, S., Gracia-Carpio, J., Lutz, D., Naab, T., Omont, A., Shapley, A., Sternberg, A., & Weiner, B. 2010, Nature, 463, 781
- Tacconi et al. (2008) Tacconi, L. J., Genzel, R., Smail, I., Neri, R., Chapman, S. C., Ivison, R. J., Blain, A., Cox, P., Omont, A., Bertoldi, F., Greve, T., Förster Schreiber, N. M., Genel, S., Lutz, D., Swinbank, A. M., Shapley, A. E., Erb, D. K., Cimatti, A., Daddi, E., & Baker, A. J. 2008, ApJ, 680, 246
- Tacconi et al. (2006) Tacconi, L. J., Neri, R., Chapman, S. C., Genzel, R., Smail, I., Ivison, R. J., Bertoldi, F., Blain, A., Cox, P., Greve, T., & Omont, A. 2006, ApJ, 640, 228
- Tacconi et al. (2013) Tacconi, L. J., Neri, R., Genzel, R., Combes, F., Bolatto, A., Cooper, M. C., Wuyts, S., Bournaud, F., Burkert, A., Comerford, J., Cox, P., Davis, M., Förster Schreiber, N. M., García-Burillo, S., Gracia-Carpio, J., Lutz, D., Naab, T., Newman, S., Omont, A., Saintonge, A., Shapiro Griffin, K., Shapley, A., Sternberg, A., & Weiner, B. 2013, ApJ, 768, 74
- Takata et al. (2006) Takata, T., Sekiguchi, K., Smail, I., Chapman, S. C., Geach, J. E., Swinbank, A. M., Blain, A., & Ivison, R. J. 2006, ApJ, 651, 713
- Trentham et al. (1999) Trentham, N., Blain, A. W., & Goldader, J. 1999, MNRAS, 305, 61
- Vanzella et al. (2008) Vanzella, E. et al. 2008, A&A, 478, 83
- Wang et al. (2013) Wang, S. X., Brandt, W. N., Luo, B., Smail, I., Alexander, D. M., Danielson, A. L. R., Hodge, J. A., Karim, A., Lehmer, B. D., Simpson, J. M., Swinbank, A. M., Walter, F., Wardlow, J. L., Xue, Y. Q., Chapman, S. C., Coppin, K. E. K., Dannerbauer, H., De Breuck, C., Menten, K. M., & van der Werf, P. 2013, ApJ, 778, 179
- Weiß et al. (2009) Weiß, A., Kovács, A., Coppin, K., Greve, T. R., Walter, F., Smail, I., Dunlop, J. S., Knudsen, K. K., Alexander, D. M., Bertoldi, F., Brandt, W. N., Chapman, S. C., Cox, P., Dannerbauer, H., De Breuck, C., Gawiser, E., Ivison, R. J., Lutz, D., Menten, K. M., Koekemoer, A. M., Kreysa, E., Kurczynski, P., Rix, H.-W., Schinnerer, E., & van der Werf, P. P. 2009, ApJ, 707, 1201
- Younger et al. (2010) Younger, J. D., Fazio, G. G., Ashby, M. L. N., Civano, F., Gurwell, M. A., Huang, J.-S., Iono, D., Peck, A. B., Petitpas, G. R., Scott, K. S., Wilner, D. J., Wilson, G. W., & Yun, M. S. 2010, MNRAS, 407, 1268