Phase sensitive parametric interactions in a photonic crystal waveguide
Abstract
We report phase sensitive amplification in a long, dispersion engineered photonic crystal waveguide which has a flattened dispersion profile. A signal degenerate configuration with pulsed pumps whose total peak power is only yields a phase sensitive extinction ratio of .
Index Terms:
Photonic crystals, nonlinear optical devices, optical communicationI Introduction
The concept of a phase sensitive parametric amplifier (PSA) was formulated several decades ago [1, 2]. The parametric interaction in a PSA involves three fields with a well-defined mutual phase relationship. The gain experienced by one of those fields is maximized when it is in-phase with the other two fields; this field is de-amplified when its phase is changed by radians. The difference between maximum and minimum gain is defined as the phase-sensitive extinction ratio (PSER). The noise accompanying the amplification process is squeezed in one quadrature and the noise figure can, in principle, reach a value of unity () [3]. Every PSA requires a preparatory stage of some kind [4, 5, 6, 7] where the mutual phases of the fields are properly arranged.
The fundamental concept of a PSA gained significant attention in recent years as systems using phase encoded signals started to dominate fiber optic communications. Indeed, PSAs were used in several experiments where low noise amplification and phase noise regeneration were demonstrated [6, 8, 9, 10]. The use of a PSA in quantum optics where phase correlated spontaneous photons are used for quantum information processing has also been suggested [11].
Most PSA demonstrations made use of optical fibers. Nonlinear interactions in fibers are well understood; they can carry high optical powers needed for the parametric interactions and they are naturally integrated in fiber communication systems. The disadvantage of optical fibers is their low nonlinearity which requires long interaction lengths and hence special operating conditions have to be applied to prevent Stimulated Brillouin and Raman scattering.
An attractive alternative to fiber based PSAs are compact waveguide devices with large nonlinearities stemming from the materials used and the small cross sections. A signal-degenerate PSA was demonstrated in a long chalcogenide ridge waveguide [7] with pulses and a total pump peak powers of , yielding a PSER of . A similar device was used in the pump-degenerate configuration [12] and achieved a higher PSER of with a peak pulse pump power. A long silicon waveguide with a reverse-biased PIN junction [13] reached PSER values between and with total peak pump powers of . The PIN junction served to sweep out free carriers generated by two-photon absorption (TPA) thereby reducing losses and increasing the nonlinear efficiency. A recent report of a long SiGe ridge waveguide [14] demonstrated a PSER of for total pump powers of only .
Since every parametric process is governed by phase matching, dispersion control is a key feature. Photonic crystal waveguides (PCWs), in particular dispersion engineered PCWs [15, 16] are therefore ideal media for any parametric amplifier. A PSA based on a pump degenerate configuration in a short, , silicon dispersion engineered PCW was demonstrated in [17]. TPA limited operation even for such a short length so that a peak pulse pump power of was needed to reach a PSER of . Refractive index changes due to TPA induced free carriers were also clearly observed.
In this paper, we report a PSA comprising a long dispersion engineered PCW. The advantage of is its large bandgap which prevents TPA at and hence requires lower pump powers than similar silicon waveguides. Indeed, such a waveguide availed the first phase insensitive parametric amplifier which provided an gain in a waveguide with a peak pump power of less than [18]. The present PSA uses a signal degenerate configuration and exhibits a PSER of with total peak pump powers of less than . The experimental results were confirmed by a simulation using the split step Fourier transform (SSFT) numerical scheme.
II Results
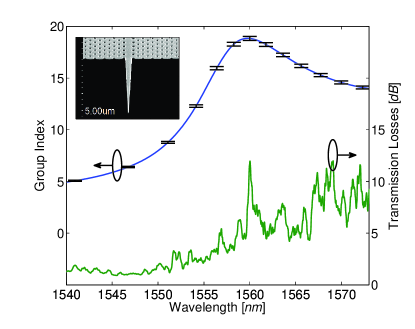
The device we tested consists of a thick membrane with air holes patterned in a hexagonal grid. Dispersion engineering [16] is obtained by shifting asymmetrically the two innermost rows next to the core, and also changing the radius of the holes closest to the core. Tapered mode converters are formed at the input and output facets to increase the coupling efficiency and to prevent reflections. The inset of Fig. 1 is an SEM image of one waveguide end. The losses were determined from transmission measurements of a wideband light source; these are presented in Fig. 1. The irregular shape of the transmission function stems from a cascade of micro defects that act as local resonances [19]. The group-index values were measured with accuracy of using the OCT technique [20], and recalculated with the PCW nonlinear properties using a periodic Finite Differences Time Domain, with an accuracy of . The errors are marked in Fig. 1 in black bars, from which a continuous function (blue curve) was evaluated using spline interpolation.
The experimental setup is described in Fig. 2. A Pritel femtosecond fiber laser (FFL) produces wide pulses at a repetition rate of . The pulse’s spectrum is sliced by a Spectral Pulse Shaper (SPS) forming three coherent pulses at different wavelengths. The amplitude and phase of each pulse is controllable so that a signal-degenerate spectrum can be formed. Each pulse is approximately wide with the signals at the longest and shortest wavelengths serving as pumps. The experiments are performed with pulsed pumps since the membrane type PCWs cannot handle large average powers. Continuous wave (CW) operation is feasible by improving thermal conductivity or coating the PCW’s surface by a dielectric to reduce surface effects.
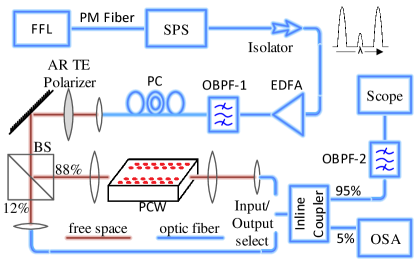
The three waves are amplified by an Erbium-Doped Fiber Amplifier (EDFA). The EDFA is followed by an Optical Bandpass Filter, designated OPBF-1, that suppresses any FWM products that are generated within the EDFA. The three waves propagate in free-space passing through an anti-reflection (AR) polarizer. A beam-splitter (BS) extracts of the beam for monitoring while the remaining is coupled to the PCW using an objective lens. Outcoupling uses a similar lens after which the beam is coupled to a single mode fiber which feeds the measurement instruments. An optical spectrum analyzer (OSA) is used to examine the complete optical spectrum from which the signal pulse is extracted by a narrowband optical filter, designated OBPF-2 so it can be measured in the time domain by a fast detector and a sampling oscilloscope.
(a) (b)
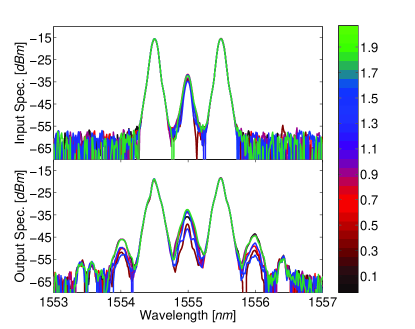
In the first set of measurements we describe, the three fields propagated in the anomalous dispersion region of the waveguide. The signal wavelength was and the two pumps were detuned from it by . The EDFA operated at a gain level of which yielded a peak power for each pump of , namely the total peak pump power was . The SPS changed the signal phase from to rad in increments of rad. Exemplary spectra are presented in Fig. 3(a)-3(b) for different signal phase values. It is clear that FWM takes place in the long semiconductor PCW with first and second order FWM products clearly seen in Fig. 3(b). Some degree of phase sensitive FWM takes place in the EDFA affecting the signal pulse shape and spectrum at the PCW input. We estimate that the pump peak powers are to stronger than that of signal at the PCW input.
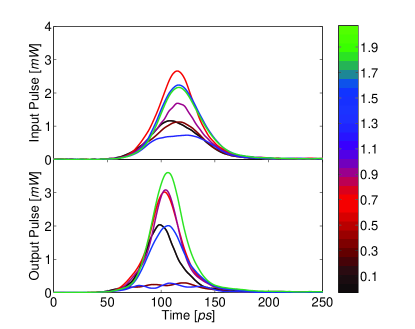
Time domain measurements of the signal pulses at the input and output of the PCW are shown in Fig. 4(a)-4(b). The walk-off between the signal and pumps is small compared to the width of each pulse and has little effect on signal distortion. The change in output signal pulse shape is due to the parametric gain dependence on the pump pulsed profile: (de-)amplification of the pulse center more than the tails causes (broadening) compression of the signal profile. Using CW or quasi-CW pumps can diminish signal distortions and improve bandwidth limitation.
(a) (b)
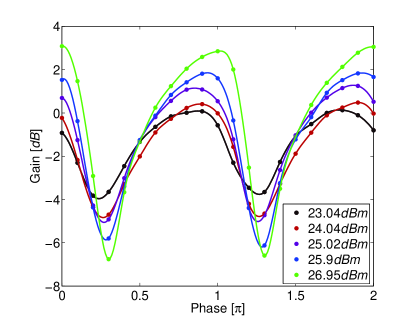
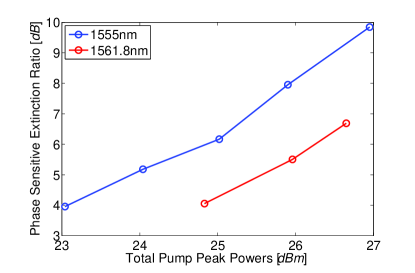
We thus examine the mean power gain given by with the mean power of the signal pulses defined as . The integration is performed over an oscilloscope span of less than (to account for the low duty-cycle of the pulse train). The PCW input and output coupling losses were determined to be and , respectively. These loss values are consistent with results of detailed simulations described later in this paper. The phase-dependent net gain (inside the PCW) is presented in Fig. 5. The green curve corresponds to the highest total peak pump powers we used, . The other curves represent lower powers obtained by reducing the EDFA gain. The gain varies cyclically with a period of rad, and the PSER increases from to as the power of the pumps increases. We note that for large peak pump powers, the minimum signal gain may be lower than shown in the figure since the lowest measurable signal level was limited by the receiver noise.
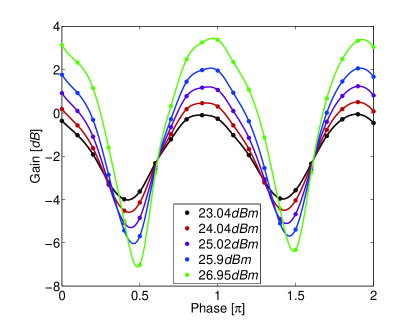
Pulse evolution upon propagation along the PCW was simulated using the SSFT computation method with an adaptive step-size [21]. The measured dispersion profile and loss spectrum were used in the simulations together with the measured input pulse envelopes and spectra. The nonlinear parameter at was evaluated as using the model detailed in [22]. The small, , detuning between pumps and signal changes insignificantly so that the standard SSFT method suffices and a more accurate but cumbersome technique [23] is not needed. Different initial signal phase values yield a calculated cyclical gain from which the maximum gain and PSER were computed. An optimization procedure for the input power of the waves and the exact loss level (which has many random spectral features) yielded the best fit to experiments when the input and output coupling losses were and , respectively. Figure 6 shows the calculated signal gain dependence on phase for different total peak pump powers which fit well with the measured results shown in Fig. 5.
The curves in Fig. 5 show an asymmetry and differ from the theoretical logarithmic cosine dependence of the gain on the signal phase [24]. Indeed the latter is deduced for a theoretical scenario assuming undepleted pumps and a weak signal, a condition not fully satisfied here. Moreover, prior to entering the PCW the three emitted waves propagate in an EDFA and through additional dispersive components so the input phases of the two pumps may not be the same. Finally, as can be seen in Fig. 3(b), the additional idler waves also contribute to the asymmetry and reduce the the overall interaction between the two pumps and the signal [25]. The simulations show a slight asymmetry, yet some of the parasitic effects are not considered and reconstruction of the experimental results is imperfect.
The measurements were repeated for a signal wavelengths of with both pump detunings set once more to . The waves propagate in this case in the normal dispersion regime, where both the inherent losses and the nonlinearity are larger (). The corresponding simulations show a similarly good fit to the experiments when using the same coupling losses. The dependence of PSER on total peak pump powers is shown in Fig. 7. The increased losses dominate the behavior at long wavelengths and even though the nonlinearity increases, the overall phase-sensitive interaction in the PCW decreases.
III Conclusions
We have demonstrated phase sensitive parametric interactions in a chip scale long dispersion engineered PCW. A signal-degenerate configuration with two equally detuned pumps produces PSER of with total pump peak powers of only . The moderate required pump power is strictly due to the wide bandgap of which prevents TPA. Higher PSER may be obtained with higher pump powers, however, membrane structures tend to damage at high power and therefore the peak pump powers in the present experiments were limited. Moreover, even though the absolute maximum net gain is moderate, this experiment proves that mode squeezing takes place which can be used for phase regeneration of noisy signals in phase encoded coherent communication.
References
- [1] C. M. Caves, “Quantum limits on noise in linear amplifiers,” Phys. Rev. D, vol. 26, pp. 1817–1839, Oct 1982.
- [2] H. P. Yuen, “Reduction of quantum fluctuation and suppression of the gordon–haus effect with phase-sensitive linear amplifiers,” Opt. Lett., vol. 17, no. 1, pp. 73–75, Jan 1992.
- [3] Y. Mu and C. M. Savage, “Parametric amplifiers in phase-noise-limited optical communications,” J. Opt. Soc. Am. B, vol. 9, no. 1, pp. 65–70, Jan 1992.
- [4] W. Imajuku, A. Takada, and Y. Yamabayashi, “Inline coherent optical amplifier with noise figure lower than 3 db quantum limit,” Electronics Letters, vol. 36, no. 1, pp. 63–64, Jan 2000.
- [5] R. Tang, J. Lasri, P. S. Devgan, V. Grigoryan, P. Kumar, and M. Vasilyev, “Gain characteristics of a frequency nondegenerate phase-sensitive fiber-optic parametric amplifier with phase self-stabilized input,” Opt. Express, vol. 13, no. 26, pp. 10 483–10 493, Dec 2005.
- [6] R. Tang, P. S. Devgan, V. S. Grigoryan, P. Kumar, and M. Vasilyev, “In-line phase-sensitive amplification of multi-channel cw signals based on frequency nondegenerate four-wave-mixing in fiber,” Opt. Express, vol. 16, no. 12, pp. 9046–9053, Jun 2008.
- [7] R. Neo, J. Schröder, Y. Paquot, D.-Y. Choi, S. Madden, B. Luther-Davies, and B. J. Eggleton, “Phase-sensitive amplification of light in a (3) photonic chip using a dispersion engineered chalcogenide ridge waveguide,” Opt. Express, vol. 21, no. 7, pp. 7926–7933, Apr 2013.
- [8] R. Slavik, F. Parmigiani, J. Kakande, C. Lundstrom, M. Sjodin, P. A. Andrekson, R. Weerasuriya, S. Sygletos, A. D. Ellis, L. Gruner-Nielsen, D. Jakobsen, S. Herstrom, R. Phelan, J. O’Gorman, A. Bogris, D. Syvridis, S. Dasgupta, P. Petropoulos, and D. J. Richardson, “All-optical phase and amplitude regenerator for next-generation telecommunications systems,” Nat Photon, vol. 4, no. 10, pp. 690–695, Oct 2010.
- [9] Z. Tong, C. Lundstrom, P. A. Andrekson, C. J. McKinstrie, M. Karlsson, D. J. Blessing, E. Tipsuwannakul, B. J. Puttnam, H. Toda, and L. Gruner-Nielsen, “Towards ultrasensitive optical links enabled by low-noise phase-sensitive amplifiers,” Nat Photon, vol. 5, no. 7, pp. 430–436, Jul 2011.
- [10] T. Richter, C. Meuer, R. Ludwig, and C. Schubert, “Black-box phase-sensitive fiber-optic parametric amplifier assisted by a semiconductor optical amplifier,” in Optical Fiber Communication Conference. Optical Society of America, 2012, p. OM3B.4.
- [11] D. Levandovsky, M. Vasilyev, and P. Kumar, “Amplitude squeezing of light by means of a phase-sensitive fiber parametric amplifier,” Opt. Lett., vol. 24, no. 14, pp. 984–986, Jul 1999.
- [12] Y. Zhang, J. Schröder, C. Husko, S. Lefrancois, D.-Y. Choi, S. Madden, B. Luther-Davies, and B. J. Eggleton, “Pump-degenerate phase-sensitive amplification in chalcogenide waveguides,” J. Opt. Soc. Am. B, vol. 31, no. 4, pp. 780–787, Apr 2014.
- [13] F. D. Ros, D. Vukovic, A. Gajda, K. Dalgaard, L. Zimmermann, B. Tillack, M. Galili, K. Petermann, and C. Peucheret, “Phase regeneration of dpsk signals in a silicon waveguide with reverse-biased p-i-n junction,” Opt. Express, vol. 22, no. 5, pp. 5029–5036, Mar 2014.
- [14] M. A. Ettabib, F. Parmigiani, A. Kapsalis, A. Bogris, M. Brun, P. Labeye, S. Nicoletti, K. Hammani, D. Syvridis, david Richardson, and P. Petropoulos, “Record phase sensitive extinction ratio in a silicon germanium waveguide,” in CLEO: 2015. Optical Society of America, 2015, p. STh1O.8.
- [15] C. Monat, M. Ebnali-Heidari, C. Grillet, B. Corcoran, B. J. Eggleton, T. P. White, L. O’Faolain, J. Li, and T. F. Krauss, “Four-wave mixing in slow light engineered silicon photonic crystal waveguides,” Opt. Express, vol. 18, no. 22, pp. 22 915–22 927, Oct 2010.
- [16] P. Colman, S. Combrié, G. Lehoucq, and A. D. Rossi, “Control of dispersion in photonic crystal waveguides using group symmetry theory,” Opt. Express, vol. 20, no. 12, pp. 13 108–13 114, Jun 2012.
- [17] Y. Zhang, C. Husko, J. Schröder, S. Lefrancois, I. H. Rey, T. F. Krauss, and B. J. Eggleton, “Phase-sensitive amplification in silicon photonic crystal waveguides,” Opt. Lett., vol. 39, no. 2, pp. 363–366, Jan 2014.
- [18] I. Cestier, S. Combrié, S. Xavier, G. Lehoucq, A. D. Rossi, and G. Eisenstein, “Chip-scale parametric amplifier with 11db gain at 1550nm based on a slow-light gainp photonic crystal waveguide,” Opt. Lett., vol. 37, no. 19, pp. 3996–3998, Oct 2012.
- [19] N. Mann, S. Combrié, P. Colman, M. Patterson, A. D. Rossi, and S. Hughes, “Reducing disorder-induced losses for slow light photonic crystal waveguides through bloch mode engineering,” Opt. Lett., vol. 38, no. 20, pp. 4244–4247, Oct 2013.
- [20] C. Caër, S. Combrié, X. Le Roux, E. Cassan, and A. De Rossi, “Extreme optical confinement in a slotted photonic crystal waveguide,” Applied Physics Letters, vol. 105, no. 12, 2014.
- [21] O. Sinkin, R. Holzlohner, J. Zweck, and C. Menyuk, “Optimization of the split-step fourier method in modeling optical-fiber communications systems,” Lightwave Technology, Journal of, vol. 21, no. 1, pp. 61–68, Jan 2003.
- [22] S. Roy, M. Santagiustina, P. Colman, S. Combrié, and A. De Rossi, “Modeling the dispersion of the nonlinearity in slow mode photonic crystal waveguides,” Photonics Journal, vol. 4, no. 1, pp. 224–233, feb. 2012.
- [23] A. Willinger and G. Eisenstein, “Split step fourier transform: A comparison between single and multiple envelope formalisms,” J. Lightwave Technol., vol. 30, no. 18, pp. 2988–2994, sept.15, 2012.
- [24] C. McKinstrie, M. Raymer, S. Radic, and M. Vasilyev, “Quantum mechanics of phase-sensitive amplification in a fiber,” Optics Communications, vol. 257, no. 1, pp. 146 – 163, 2006.
- [25] M. Gao, T. Inoue, T. Kurosu, and S. Namiki, “Evolution of the gain extinction ratio in dual-pump phase sensitive amplification,” Opt. Lett., vol. 37, no. 9, pp. 1439–1441, May 2012.