Diagonal and off-diagonal susceptibilities of conserved quantities in relativistic heavy-ion collisions
Abstract
Susceptibilities of conserved quantities, such as baryon number, strangeness and electric charge are sensitive to the onset of quantum chromodynamics (QCD) phase transition, and are expected to provide information on the matter produced in heavy-ion collision experiments. A comprehensive study of the second order diagonal susceptibilities and cross correlations has been made within a thermal model approach of the hadron resonance gas (HRG) model as well as with a hadronic transport model, UrQMD. We perform a detailed analysis of the effect of detector acceptances and choice of particle species in the experimental measurements of the susceptibilities for heavy-ion collisions corresponding to = 4 GeV to 200 GeV. The transverse momentum cutoff dependence of suitably normalised susceptibilities are proposed as useful observables to probe the properties of the medium at freezeout.
pacs:
25.75.-q,25.75.Gz,25.75.Nq,12.38.Mh1 Introduction
Heavy-ion collisions at relativistic energies create matter at extreme conditions of temperature and energy density, consisting of deconfined quarks and gluons. The major motivations of facilities at the Relativistic Heavy Ion Collider (RHIC) at Brookhaven National Laboratory, the Large Hadron Collider (LHC) at CERN and FAIR at GSI are to study the formation of this new form of matter, called quark-gluon plasma (QGP) and study its basic properties. In the Quantum Chromodynamics (QCD) phase diagram, location of the QCD critical point could be one of the compelling discovery in the heavy-ion collisions. The end point of the first order phase transition between hadronic matter to QGP phase is known as QCD critical point, after which there is no genuine phase transition but a cross over from hadronic to quark-gluon degrees of freedom [1, 2]. While the temperature for this crossover transition at zero baryon chemical potential is now theoretically established from lattice QCD (LQCD) computations [3], the existence and location of the critical point at non-zero baryon density is far from settled [4, 5]. On the experimental front, the ongoing beam energy scan program at RHIC is attempting to establish the onset of phase transition and locate the critical point.
One of the foremost methods for the critical point search is through measurements of fluctuations of conserved quantities [6, 7]. These quantities have been estimated theoretically - both on the lattice [8, 9, 10, 11, 12] as well as in models [13, 14, 15, 16, 17, 18, 19, 20, 21, 22, 23]. Recently, RHIC experiments have published results on the diagonal susceptibilities of conserved charges, like, net electric charge [24, 25] and net baryon [26]. Comparison of the experimental data to HRG model calculation [27] shows that at higher beam energies ( GeV) there is reasonably good agreement between data and the model. This suggests that at these energies, the observed fluctuation of conserved charges must be grand-canonical thermal fluctuations. However, at lower energies there is disagreement between data and model calculation for certain conserved charge susceptibilities indicating non-thermal fluctuations. It is not yet clear whether such non-thermal behaviour is a signature of QCD critical physics.
Similar to the diagonal susceptibilities, different combinations of higher order off-diagonal susceptibilities of net charge, net baryon number and net strangeness can be estimated using different combinations of higher order central moments of conserved charges in the experiments. The measurement of these observables give information to explore the flavor carrying susceptibilities and also the nature of QCD phase transitions [28, 29, 30, 31].
There are several constraints in the experimental measurements which need to be properly understood in order to interpret the results and compare with theoretical calculations. A limited set of produced particles are measured on an event-by-event basis. The neutron, whose contribution to net baryon () is as good as the proton (), is not measured. -baryon is the lightest strange baryon and hence contributes most significantly to the baryon-strangeness correlation. Although -baryon is measured over an ensemble through its charged daughter particles, its measurement on an event-by-event level poses a daunting task. Thus, only the moments of net charge () are measured faithfully. For the other charges we have to rely on proxies, e.g. net proton serves as a good proxy for net baryon and net kaons serve as a proxy for net strangeness.
We have studied the dependence on the observed particle sets for all the second order susceptibilities. We have made a comprehensive study of the effect due to finite number of the conserved quantities. Ideally, in order to observe grand canonical fluctuations of the conserved charges, the fraction of the conserved charge carried by the system to that of the total available charge carried by the bath as well as the system should be much smaller than half (). However, in reality for full overlap collisions, the equals to twice the mass number of the nucleus and equals to twice the atomic number of the nucleus that are distributed in the momentum rapidity () direction within . Thus, the final distribution of this and into the system and bath depends on three factors: (a) the available experimental acceptance, (b) , and (c) the baryon stopping phenomenon which decides the initial rapidity distribution of the conserved charges. It is important to note that the strong dependence of baryon stopping rubs off on to , complicating the comparison of measured moments at different .
In this article, we have used the Ultra-relativistic Quantum Molecular Dynamics (UrQMD v3.3) as well as the hadron resonance gas (HRG) model to analyze the diagonal and off-diagonal susceptibilities of the conserved charges. Model descriptions for UrQMD and HRG are presented in Section II. In Section III, we discuss the observables used for the present study. In Section IV, we present the collision energy dependence of all the susceptibilities. We discuss the species dependence on the observables and effect of detector acceptances. We present the results from both the models. The article is summarised in Section V. An appendix at the end discusses the estimation of statistical errors associated with the observables.
2 Model considerations
UrQMD is a microscopic transport model [32, 33]. In this model, the space-time evolution of the fireball is studied in terms of excitation of color strings which fragment further into hadrons, the covariant propagation of hadrons and resonances which undergo scatterings and finally the decay of all the resonances. This model setup has been quite successful and widely applied in heavy-ion phenomenology [32, 33]. It has also been previously used to compute several susceptibilities [34, 35, 36, 37, 38]. The acceptance window plays an important role in such studies. The initial distribution of and in is a consequence of the baryon stopping phenomenon which has a strong dependence- as a result at higher the mid-rapidity region is almost free of and while at lower almost all the and are deposited in the mid-rapidity region. This is also expected to have significant effect on the fluctuations of conserved quantities. This dependent baryon stopping phenomenon is dynamically included in the UrQMD approach. Here, we have generated around a million events per beam energy from GeV.
We have compared the UrQMD results with those from a thermal approach, by using the HRG model. Here it is important to note that while the HRG results are expected to reflect the susceptibilities at the time of chemical freezeout where inelastic collisions cease, the UrQMD results reveal the above quantities at the kinetic freezeout surface where the elastic collisions cease. Thus, while the latter are more realisitic in the context of heavy ion collisions, the HRG results here serve as useful guide for a qualitative understanding of the results. The HRG model consists of all hadrons and resonances as listed in the Particle Data Book [39] within the framework of a multiple species non-interacting ideal gas in complete thermal and chemical equilibrium. The only parameters are the temperature , chemical potentials , and corresponding to the conserved quantities of baryon number , electric charge and strangeness , and the volume of the fireball which are obtained by fits to data. The HRG model has been found to provide a very good description of the mean hadron yields using a few thermodynamic parameters at freeze-out (for a recent compilation of the freeze-out parameters, see Ref. [40]). In this work, we have used the same parametrisation for the dependence of , , and as given in Ref. [20]. The chemical freezeout volumes, are taken from Ref. [40]. These parameters are listed in Table 1.
| (GeV) | () | (MeV) | (MeV) | (MeV) | (MeV) |
|---|---|---|---|---|---|
| 6.27 | 1.4 | 130.8 | 482.4 | 12.7 | 106.5 |
| 7.62 | 1.3 | 139.2 | 424.6 | 11.7 | 96.1 |
| 7.7 | 1.3 | 139.6 | 421.6 | 11.6 | 95.5 |
| 8.76 | 1.1 | 144.2 | 385.7 | 10.9 | 88.8 |
| 11.5 | 1.5 | 151.6 | 316.0 | 9.5 | 75.0 |
| 17.3 | 2.0 | 158.6 | 228.6 | 7.4 | 56.5 |
| 39 | 1.7 | 164.2 | 112.3 | 4.1 | 29.4 |
| 62.4 | 1.8 | 165.3 | 72.3 | 2.8 | 19.4 |
| 130 | 2.1 | 165.8 | 35.8 | 1.4 | 9.8 |
| 200 | 2.5 | 165.9 | 23.5 | 1.0 | 6.4 |
Lately, susceptibilities have also been employed to study the freeze-out conditions of the fireball within the HRG model [27]. All the quantities of interest can be computed from the partition function
| (2) | |||||
where for mesons and for baryons, , , , , and
| (3) |
refer to the degeneracy factor, mass, baryon number, electric charge, strangeness and hadron chemical potential respectively of the th hadron species, is the part of the fireball volume under study that can also be called the system and is the modified Bessel function of the second kind. From , all thermodynamic quantities could be computed.
3 Observables and methods
The susceptibilities of the conserved quantities of the strongly interacting matter in thermal and chemical equilibrium can be computed within the grand canonical ensemble (GCE) from partial derivatives of the pressure () with respect to the chemical potentials
where the is obtained from as follows
| (5) |
From the experimental point of view it is straightforward to compute the central moments, ,
| (6) |
Using the fact that the generating function for the cumulants is given by the logarithm of that of the moments, one can express one in terms of the other. Up to the second order, this relationship is one-to-one, such as,
| (7) |
Using this relation, all the diagonal and non-diagonal susceptibilities of second order can be expressed in terms of second order central moments ():
The ratios of of to can be suitably constructed to cancel the volume effect. In the quasiparticle picture of quarks and gluons, the ratios and become -1/3 and 1/3 respectively. It is not possible to find such simple factors for other ratios like that receive contribution from both light and strange quarks. Thus the following the ratios of off-diagonal and diagonal susceptibilities have been constructed:
| (8) | |||||
| (9) | |||||
| (10) |
We have studied the susceptibilities and these ratios as a function of collision energy and detector acceptances in terms of pseudorapidity () and transverse momentum ().
4 Beam energy dependence
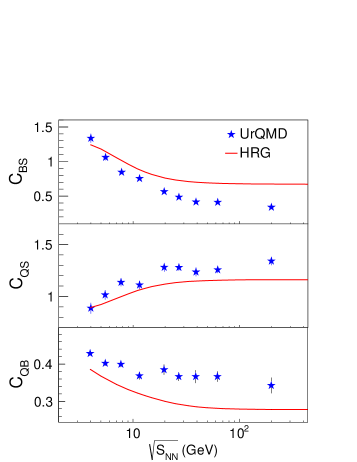
In Figure 1, we present the ratios, , , and as a function of for top central (0-5% of total cross section) Au+Au collisions using both UrQMD and HRG models. In this construction, the ratios are calculated by considering all the charges, baryons and strange particles within and GeV/c . The trends of the ratios for both the models are similar, although there are quantitative differences. In going from low to high collision energy, the values of decrease and remain constant after = 27GeV, whereas the values of increase and then remain constant after = 20GeV. The values of show decreasing trend with increasing .
These trends can be understood on the basis of the thermal model framework of the HRG. gets dominant contribution from (being the lightest strange baryon) in the numerator while in the denominator, it gets contribution mainly from the kaons (being the lightest strange mesons). With decreasing , increases which in turn enhances the relative contribution from compared to kaons resulting in the increasing trend of . In case of , it receives dominant contribution from the kaons both in the numerator and denominator. However the contribution from the lightest strange baryon to keeps growing with decreasing . This results in the monotonic increasing trend for with . Finally, the weak rising trend of with decreasing can be traced to the contribution from the multiply charged to the numerator.
4.1 Species Dependence of the hadrons
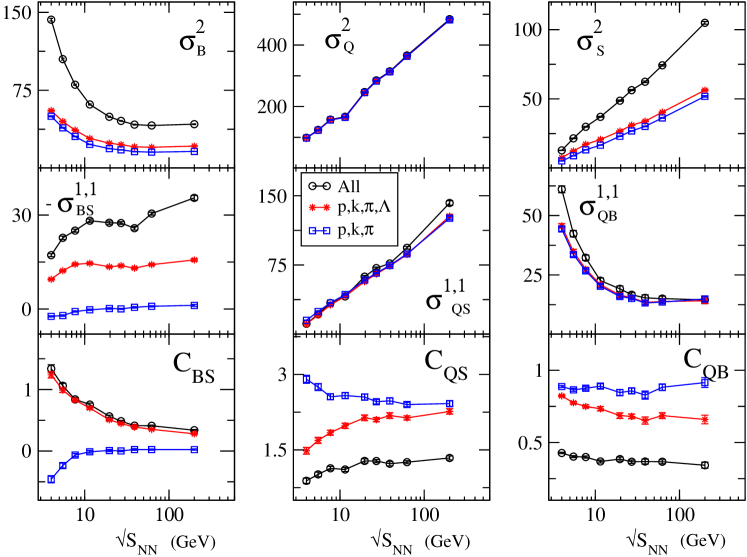
Susceptibilities and their ratios have a strong species dependence. In the experiments, only charged hadrons are measured. At present, it is possible to perform an event-by-event analysis of only , , and their anti-particles. Neutral hadrons, like , and , which contribute significantly to the strangeness fluctuation, baryon fluctuation and baryon-strangeness correlation, respectively, are not measured on an event-by-event basis. We have estimated the effect of such missing contributions by computing all the ratios for three different hadron sets: (i) considering all hadrons as in Fig. 1, (ii) with , , , and and , and (iii) with only , , and . The results of the study using UrQMD model are shown in Fig. 2 as a function of collision energy. Ratios like , and are constructed using variances (like , and ), and covariances (like , and ) of different conserved quantities. Large differences have been observed for the three cases. In all cases, it is clear that using only , , , as event-by-event measurements, the sensitiveness of the ratios as a function of collision energy reduces to a large extent. For , there is practically no difference between the cases with all particles and those with , , , and and . But the trend for only , , , is very different. It is necessary to analyse at least and included in the measurements. Here we note that an additional hurdle in experiments will be to distinguish from . However, our results here with all the particles as well as only , , , and and are almost identical. Thus the role of is probably sub-dominant. It is well known that in UrQMD, the yields of multi-strange baryons are highly underestimated [41, 42]. It might be possible that similar reason also leads to the above observation of marginal influence of the multi-strange baryons towards strange susceptibilities as well as baryon-strange correlations. on the other hand is almost constant across all - the case with only , , and is roughly twice of the case when we include all hadrons due to the missing neutrons in the denominator in the former.
.
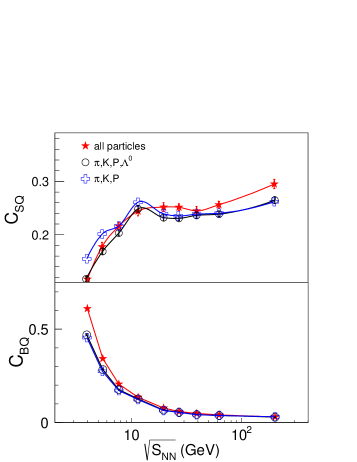
In order to reduce the dependence on the choice of hadron set we also look at the other ratios, and , where only charged hadrons contribute. We show the results of these two quantities from UrQMD in Fig. 3. For both of these quantities, the leading contributors to numerator as well as denominator come from the measured hadron sets , , and . Thus, we find that these results are quite stable to further inclusion of other hadrons and hence can be estimated in experiments with the limited particle identification capability.
4.2 Acceptance dependence
Limited event-by-event particle identification, realistic efficiency corrections in the experiments and finite kinematic acceptances in and - all of these contribute to dilute the signal for susceptibilities in the experiments [43]. Some of these effects have been already discussed earlier [44, 45, 22, 46, 47, 48]. In the previous section we discussed the effect of limited particle identification on susceptibilities. We will now discuss specifically the effect of the window of detector acceptances in terms of and windows for measuring the susceptibilities.
Ideally, grand canonical fluctuations trivially scale with system volume when in contact with an infinite bath. On the other hand, in heavy-ion collisions for large enough acceptance it is possible that the system size becomes comparable with that of the bath and even larger. Global charge conservation in such cases cause suppression of thermal fluctuation resulting in non-thermal fluctuations [49, 50]. Thus, the interpretation of conserved charge fluctuations in terms of thermal and critical fluctuations is not straightforward in such cases. Another factor that adds to the above complication is the fact that baryon stopping is not constant across , resulting in completely different distributions of conserved charges in for different .
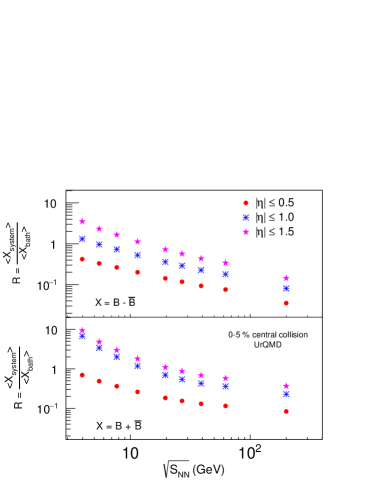
The rapidity dependence of baryons affects the beam energy dependence of the ratio of the number of baryons carried by the system to the total carried by the system as well as bath. Ideally, in order to observe grand canonical fluctuations . We study this ratio for net baryons and total number of baryons as a function of collision energy for central Au+Au collisions using UrQMD model. The ratios are plotted for three different windows (0.5, 1.0 and 1.5) in Fig. 4. We find that at high , is sufficiently less than . However, at lower , the case stays around while for even larger acceptance windows, signalling the inapplicability of the grand canonical ensemble for fluctuations. Thus, a fixed window across all beam energies does not correspond to same system to bath effective volume ratio for all [51]. This suggests that for low , is the upper bound for the acceptance window in . We have studied in detail the dependence of susceptibilities on the acceptance window in and .
4.2.1 Susceptibilities from HRG model
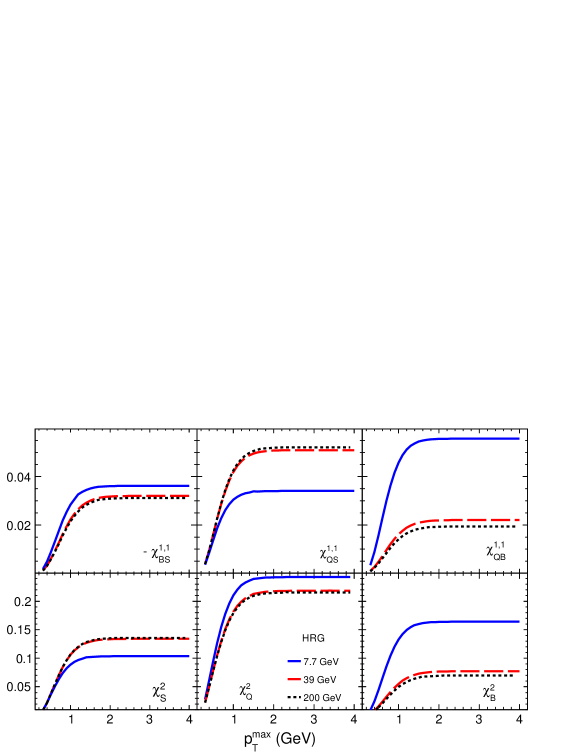
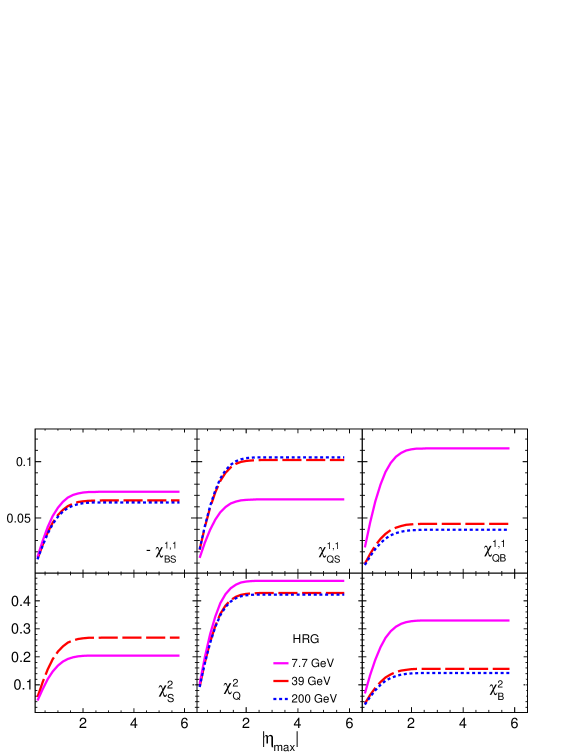
Let us first analyse the acceptance dependence of the susceptibilities of conserved quantities using the HRG model. From Eq. 2 and LABEL:eq.sus, we can write the susceptibilities due to the -th hadron as,
where and similarly for . For ease of understanding, we have written down the explicit cutoff dependence on the momentum rapidity instead of the pseudorapidity which is more relevant experimentally. As noted from the integrand, the Boltzmann factor in terms of and transverse momentum is . The dependence ensures that thermal production of particles is more strongly suppressed in as compared to .
The susceptibilities have a strong dependence on the maximum value of transverse momentum () value and maximum -window (). These dependences are studied for central Au+Au collisions for three collision energies and plotted in Figs. 5 and 6 as a function of () and , respectively. All the susceptibilities show similar trends with both and . Small values of susceptibilities are observed for small and which steadily grow with increasing and as more phase space is included, finally saturating off to a constant value as the Boltzmann factor suppresses any further contribution from high and .
4.2.2 Susceptibilities from UrQMD model
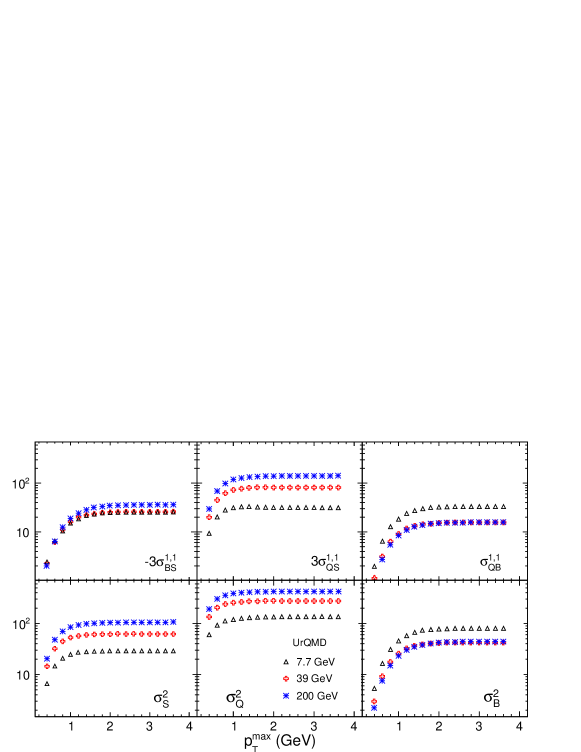
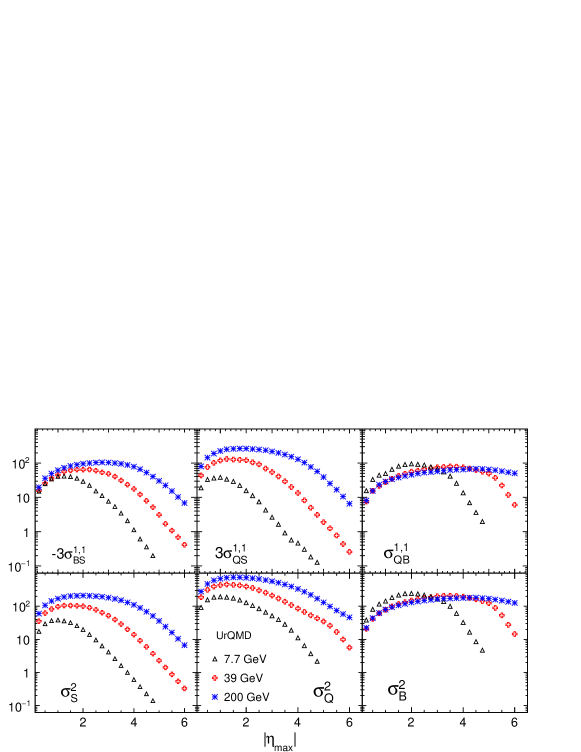
Figures 7 and 8 show the different second order susceptibilities with acceptances in terms of and as obtained using the UrQMD model. The dependence of susceptibilities turns out to be similar to those obtained from the HRG model. However, the dependence exhibits quite different behaviour, primarily because of global conservation. There is an initial increase for small and attain maximum value at intermediate rapidity window within 1 to 2 units. At large rapidity window both variance and covariance terms go to zero because of the charge conservation effect at full phase space. This suggests that 2 to 3 capture the full essence of conserved charge correlations.
4.2.3 Normalised susceptibilities from HRG and UrQMD
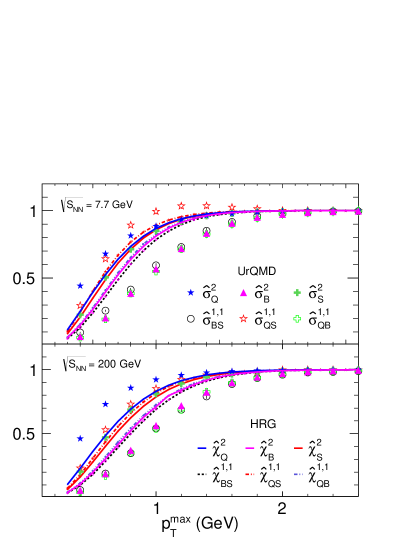
The and dependence of the susceptibilities within the HRG and UrQMD models presented in the earlier sections can be compared and nicely summarised after they are suitably normalised. Here, we have normalised by their values at GeV and . We denote these normalised susceptibilities as and . Thus by construction, for GeV and , and are unity. Figure 9 shows dependence of the variance and covariance of conserved quantities, from both UrQMD and HRG models, in central Au+Au collisions for two collision energies. For small , the susceptibilities in both the models approach zero as the system phase space volume approaches zero. In all the cases the fluctuations grow with before saturating to a constant value. It is interesting to observe a clear conserved charge ordering in these normalised susceptibilities with the increase of . This is observed in both HRG and UrQMD model calculations. that receives contribution mainly from net pion reaches its saturation value fastest while that gets contribution from net proton saturates at larger values of . which mainly gets contribution from kaons saturates at intermediate , closer to that of .
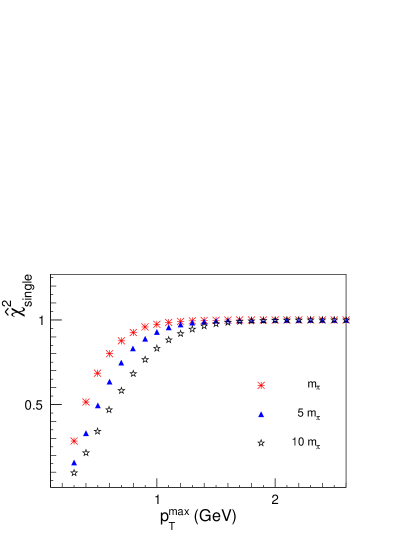
In the HRG setup, it is easy to understand that such conserved charge ordering arises from the ordering of the masses of the hadrons that contribute dominantly to the different susceptibilities. This can be clearly understood within the framework of a single particle ideal gas. We have plotted the second order normalised susceptibility of this single particle ideal gas for three different masses of the particle. The results of these calculations are shown in Fig. 10. As the mass of the particle increases, the saturation in kicks in at a higher . As we go from HRG to UrQMD, we find the effect of the mass ordering gets even more pronounced as seen in Fig. 9.
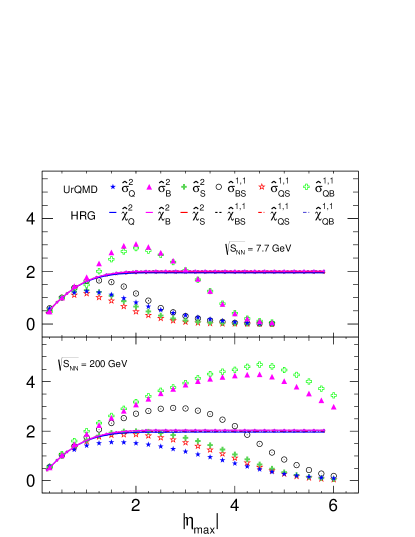
We have plotted the dependence of all the normalised susceptibilities with GeV in Fig. 11. They are all normalised by their values for . Unlike the dependence, in this case all the plots collapse on each other and we don’t see any mass ordering in the HRG results. The UrQMD results show a similar collapse for beyond which total charge conservation effect kicks in and the plots deviate from each other. While the mesonic moments peak around beyond which they start going to zero, the baryonic moments continue with their rise and peak at higher . The location of the peaks of the baryonic moments are clearly dictated by the baryon stopping effect and closely follow the peak in the distribution of baryons. The mesonic moment peaks are much less sensitive to .
5 Summary
The moments of conserved charges are important observables to probe the QCD phase diagram in heavy ion collisions. These provide glimpses of the thermal conditions prevalent in the fireball. They quantities are also expected to carry the signatures of non-thermal behaviour, like those close to the QCD critical point. Although the study of these observables is very well motivated, there are several experimental issues that need to be understood in order to interpret the data and draw physics conclusions. Using UrQMD and HRG models, we have studied some of the issues with respect to particle identification as well as detector acceptances in the experiments with regard to all the second order susceptibilities. The main results of our study are as follows:
-
1.
, and can be measured accurately with the event-by-event measurements of the limited particle set: , , and , while the measured from net proton roughly scale as half of that expected from the complete particle set due to the missing neutrons,
-
2.
We should have acceptance in order to have the ratio of conserved charge in bath to the total conserved charge from bath and system much smaller than half as it should be for grand canonical fluctuations for all GeV,
-
3.
Suitably normalised susceptibilities show a conserved charge ordering in the acceptance in HRG as well as in UrQMD. The net charge susceptibilities saturate to their maximum value at smaller value followed by net strangeness and net baryon. For a thermal medium, the dependence arises from the different masses of the relevant degrees of freedom that contribute to these conserved charge fluctuations. For a hadronic medium, this implies a clear ordering in the different conserved charges. By virtue of being normalised, they are independent of the fireball volume and thus can be reliably compared between experiments and theory. An experimental observation of such ordering will confirm the presence of the hadronic medium at the time of freeze-out of the susceptibilities. On the other hand, a negative result will hopefully lead to more interesting physics. It will be interesting in this context to study the influence of critical fluctuations on such ordering.
6 Acknowledgement
We acknowledge many helpful discussions on susceptibilities with Sourendu Gupta and Prithwish Tribedy. SC acknowledges XIIth plan project no. 12-RD-NIS-5.11-0300 and CNT project PIC XII-RD-VECC-5.02.0500 for support. NRS is supported by the US Department of Energy under Grant No. DE-FG02-07ER41485. This research used resources of the LHC grid computing center at the Variable Energy Cyclotron Center, Kolkata, India.
7 Appendix: Statistical error estimation
Let us consider the observable, which is the ratio of off-diagonal () to diagonal () cumulants of conserved charged distributions,
| (12) |
where is a constant, and and are the net charge (), net baryon () or net strangeness (). can be expressed as
| (13) |
Now using the error propagation formula, one can find the variance of as,
| (14) | |||||
Using and , the variance of can be expressed in terms of the following:
| (15) | |||||
The general expression for covariance between moment ( and ) [52] is
| (16) |
Where is the total number of events in an ensemble. Using above two equations one obtains,
| (17) | |||||
The error in is finally written as
| (18) |
Similarly, one can derive error of any observable (the higher order off-diagonal and diagonal cumulants of different multiplicity distributions).
References
References
- [1] L. McLerran et al., Phys.Rev. D24 450 (1981).
- [2] B. Svetitsky, Phys.Rept. 132 1-53 (1986).
- [3] Y. Aoki et al., Nature 443 675-678 (2006).
- [4] K. Rajagopal, Nucl. Phys. A661 150-161 (1999).
- [5] R.V. Gavai, Pramana 84 757 (2015).
- [6] M. A. Stephanov, K. Rajagopal, and E. Shuryak, Phys. Rev. Lett. 81 4816-4819 (1998).
- [7] M. A. Stephanov, K. Rajagopal, and E. Shuryak, Phys.Rev. D60 114028 (1999).
- [8] M. Cheng et al., Phys. Rev. D79, 074505 (2009).
- [9] S. Borsanyi et al., JHEP 1201, 138 (2012).
- [10] R. Gavai and S. Gupta, Phys. Lett. B696, 459 (2011).
- [11] A. Bazavov et al., Phys. Rev. Lett. 109, 192302 (2012).
- [12] S. Borsanyi et al., Phys. Rev. Lett. 111, 062005 (2013).
- [13] K. Fukushima, Phys. Rev. D77, 114028 (2008).
- [14] W. j. Fu, Y. x. Liu, and Y. L. Wu, Phys. Rev. D81, 014028 (2010).
- [15] W. j. Fu and Y. l. Wu, Phys. Rev. D82, 074013 (2010).
- [16] A. Bhattacharyya, P. Deb, A. Lahiri, and R. Ray, Phys. Rev. D82, 114028 (2010).
- [17] B. J. Schaefer, M. Wagner, and J. Wambach, Phys. Rev. D81, 074013 (2010).
- [18] J. Wambach, B. J. Schaefer, and M. Wagner, Acta Phys. Polon. Supp. 3, 691 (2010),
- [19] A. Bhattacharyya, P. Deb, A. Lahiri, and R. Ray, Phys. Rev. D83, 014011 (2011).
- [20] F. Karsch and K. Redlich, Phys. Lett. B 695, 136–142 (2011).
- [21] S. Chatterjee and K. A. Mohan, Phys. Rev. D86, 114021 (2012).
- [22] P. Garg et. al, Phys. Lett. B 726, 691-696 (2013).
- [23] S. Basu, S. Chatterjee, R. Chatterjee, T. K. Nayak and B. K. Nandi, Phys. Rev. C94, 044901 (2016)
- [24] L. Adamczyk et al., (STAR Collaboration), Phys. Rev. Lett. 113 (2014) 092301.
- [25] PHENIX Collaboration (L. Adamczyk et al.), Phys. Rev. C93 011901(R) (2016)
- [26] STAR Collaboration (L. Adamczyk et al.), Phys. Rev. Lett. 112 (2014) 32302.
- [27] P. Alba et al., Phys. Lett. B738 305-310 (2014).
- [28] V. Koch, A. Majumder and J. Randrup, Phys. Rev. Lett. 95 182301 (2005).
- [29] A. Majumder and B Muller, Phys. Rev. C 74, 054901 (2006).
- [30] R. V. Gavai, Sourendu Gupta, Phys. Rev. D 73, 014004 (2006).
- [31] D.K. Mishra, P.K. Netrakanti and B. Mohanty, arXiv:1606.06538 [hep-ph]
- [32] S. A. Bass et al., Prog. Part. Nucl. Phys. 41 255 (1998).
- [33] M. Bleicher et al., J. Phys. G25 1859-1896 (1999).
- [34] M. Bleicher et al.,, Phys. Lett. B435, 9 (1998).
- [35] M. Bleicher, S. Jeon, and V. Koch, Phys. Rev. C 62, 061902(R) (2000).
- [36] S. Haussler, H. Stocker, and M. Bleicher, Phys. Rev. C 73, 021901 (R) 2006.
- [37] N. R. Sahoo, S. De, and T. K. Nayak, Phys. Rev. C 87, 044906 (2013).
- [38] B. Sharma, M. M. Aggarwal, N. R. Sahoo, T. K. Nayak, Phys. Rev. C 91, 024909 (2015).
- [39] K. A. Olive et al., Chin. Phys. C38 090001 (2014).
- [40] S. Chatterjee et al., Adv. High Energy Phys. 2015 349013 (2015).
- [41] J. Steinheimer at al., Phys. Rev. C 93, 064908 (2016)
- [42] J Steinheimer and M Bleicher J. Phys. G: Nucl. Part. Phys. 43 (2016) 015104
- [43] A. Bzdak and V. Koch, Phys. Rev. C86 044904 (2012).
- [44] M. Bleicher, S. Jeon and V. Koch, Phys. Rev. C62 061902 (2000).
- [45] A. Bzdak, V. Koch and V. Skokov, Phys. Rev. C87 014901 (2013).
- [46] A. Bzdak and V. Koch, Phys. Rev. C91 027901 (2015).
- [47] F. Karsch et al., Phys. Rev. C93 034907 (2016)
- [48] H. Petersen et al., arXiv: 1512.05603 [nucl-th].
- [49] M. Nahrgang et al., Eur. Phys. J. C72 2143 (2012).
- [50] Ji Xu, et. al., Phys. Rev. C94, 024901 (2016).
- [51] S. Gupta, arXiv:1508.01136[nucl-th].
- [52] G. Maurice and M. A. Kendall, The Advanced Theory of Statistics, Vol. I 2nd ed. (Charles Griffin & Company, London, 1945).