First-principles investigations into the thermodynamics of cation disorder and it’s impact on electronic structure and magnetic properties of spinel
Abstract
Cation disorder over different crystallographic sites in spinel oxides is known to affect their properties. Recent experiments on Mn doped multiferroic indicate that a possible distribution of Mn atoms among tetrahedrally and octahedrally coordinated sites in the spinel lattice give rise to different variations in the structural parameters and saturation magnetisations in different concentration regimes of Mn atoms substituting the Cr. A composition dependent magnetic compensation behaviour points to the role conversions of the magnetic constituents. In this work, we have investigated the thermodynamics of cation disorder in system and it’s consequences on the structural, electronic and magnetic properties, using results from first-principles electronic structure calculations. We have computed the variations in the cation-disorder as a function of Mn concentration and the temperature and found that at the annealing temperature of the experiment many of the systems exhibit cation disorder. Our results support the interpretations of the experimental results regarding the qualitative variations in the sub-lattice occupancies and the associated magnetisation behaviour, with composition. We have analysed the variations in structural, magnetic and electronic properties of this system with variations in the compositions and the degree of cation disorder from the variations in their electronic structures and by using the ideas from crystal field theory. Our study provides a complete microscopic picture of the effects that are responsible for composition dependent behavioural differences of the properties of this system. This work lays down a general framework, based upon results from first-principles calculations, to understand and analyse the substitutional magnetic spinel oxides in presence of cation disorder.
I Introduction
Spinel oxides have been the subjects of continuously evolving scientific research as they constitute a fascinating class of materials with a plethora of interesting electrical, thermal, and magnetic properties. Above these, spinel oxides are ideal materials for investigating structure-property relationships and consequent controlled engineering of functional properties for device applications. The last traits are results of the facts that many of them are known to exhibit substantial degrees of cation disorder dis1 ; dis2 ; dis3 ; dis4 ; dis5 ; dis6 ; dis7 ; dis8 ; dis9 ; dis10 over the two types of sub-lattices, the tetrahedrally coordinated and the octahedrally coordinated .The degree of cation disorder is represented by a single parameter which can take values between 0 and 1. The ”Normal spinel” compounds are those with when the atoms in compounds occupy the tetrahedral sites and atoms the octahedral sites. The ”Inverse spinel” compounds are the ones with where the tetrahedral sites are completely occupied by the atoms, while the octahedral sites are occupied by equal amounts of and atoms. The degree of cation disorder in a material depends on experimental conditions such as the annealing temperature anneal1 ; anneal2 ; anneal3 or the control of the non-equilibrium disorder advfuncmat . Various studies on a variety of spinels have established that the electrical jpcm ; advfuncmat , electronic mg and thermal mg1 ; crystres properties of these compounds can be controlled by manipulating the degree of cation disorder. Thus, precise knowledge of the degree of cation disorder in a spinel compound is important to understand it’s fundamental properties.
Magnetic spinels with different magnetic constituent in and sub-lattices have gained prominence as they widen the scope of functionalities of spinel oxides arising out of different magnetic interactions. Moreover, magnetism offers greater perspectives regarding coupling between various degrees of freedom, such as the lattice and the magnetic ones spphonon1 ; spphonon2 . Recently discovered coupling between the charge and spin degrees of freedom, the multiferroic property, in a few chromite spinels,polarization ; mncr2o4 ; cdcr2s4 has generated considerable interests regarding the understanding of the structure-property relationships and subsequent discovery of new multiferroic materials with improved functionalities. Among these the oxide spinel is found to be a promising multiferroic material as it exhibits switchable electric polarisation under reversal of magnetic field polarization . The richness of it’s magnetic phase diagram comprising of various long range and short-range, collinear and non-collinear magnetic structures cco1 ; cco2 ; cco3 ; cco4 prompted researchers to examine the effects of substitution of one of the magnetic atom with a new one on it’s properties. Subsequently, new and interesting phenomena like tunable Exchange Bias, temperature dependent magnetic compensation and magneto-strictions were observed upon controlled substitution of Cr with Fe atoms padam-thesis ; padam1 ; padam2 ; pss13 . These novel phenomena were attributed to the composition dependent occupancy pattern of the substituted Fe atoms in which violated the empirical idea of expected occupancy pattern obtained from Mossbauer experiments moss and also from the theoretical model based upon the relative sizes of cations shannon .
The interesting structure-property relationship upon substitution of Cr atoms at sites in with Fe, led to a systematic investigation of Mn substituted experiment . The system is expected to provide interesting insights into the site preferences of the cations, and it’s associations with the changes in various properties as increases. This is due to the fact that while has a cubic ground state (space group ), is tetragonal with a significant elongation along axis (space group ) anneal1 ; there is no evidence of any cation disorder in the former while non-negligible cation disorder ()depending upon the annealing temperature is reported for the later anneal1 ; cmo . Investigations into the structural and magnetic properties experiment revealed a deviation in the variations of the lattice constant for smaller values () from the expected linear increase with increasing , a structural distortion for , a magnetic compensation at , and three different patterns of variations in magnetisations depending upon the ranges of . The authors addressed this non-regular behaviour in the lattice constants and the magnetisation along with the phenomena of composition dependent magnetic compensation to the varying trends in the site preferences of the Mn atoms substituting the Cr. They explained the trends in the properties by assuming that the substituting Mn atoms first occupy the tetrahedral sites upto the compensation point, and then they first occupy one of the sites till a critical value of and finally occupy the other site upon further increase in . However, this investigation neither quantified the cation disorder, nor provided any microscopic picture behind the non-regular behaviours.
With a motivation to understand the observed non-regular phenomena in from microscopic point of view and thus interpret them with a robust framework, in this work, we provide a detailed account of the composition dependences and thermodynamics of the cation disorder in by combining Density Functional Theory (DFT) based first-principles calculations and a thermodynamic model. These first-principles calculation based results substantiate the experimental claim of the site preferences of the Mn atoms by putting it on a solid theoretical ground. Concurrently, a systematic study of the structural, magnetic and electronic properties as a function of composition and degree of cation disorder is carried out. These results are interpreted in terms of the elements in the crystal field theory and the electronic structures, thus presenting the necessary microscopic picture governing the physics of this system. In Section II, we present details of the models and the computational techniques. The results are presented in Section III, followed by the conclusions.
II Details of calculations
In an spinel, like , with no cation disorder between the sub-lattices, the tetrahedral sites are occupied by the atoms in +2 charge state and the octahedral sites are occupied by the atoms in +3 charge state. In case of cation disorder between the sub-lattices where degree of cation disorder is denoted by the parameter , the tetrahedral sites consist of a binary alloy and each of the octahedral sites has the composition . The degree of cation disorder at a finite temperature can be calculated from the thermodynamic consideration of cation distributions by treating it as a simple chemical equilibrium navr . Such modelling has been proved to agree reasonably well with the experiments in most of the cases advfuncmat ; navr1 ; navr2 ; navr3 ; navr4 ; navr5 ; NN-app2 . In this model, the configurational free energy of cation disorder per formula unit is given as
is the cation disorder energy per formula unit, the temperature and the configurational entropy which is calculated using the general formula ; is the concentration of the cation at the -th sub-lattice. The equilibrium degree of cation disorder parameter at the given temperature can, then, be obtained by minimising with respect to .
The system, for a given value of , can be represented as a system. Since we are dealing with a more complicated cation disorder as our system has substitutional disorder with respect to one type of magnetic atom too, one has to first decide on the compositions of each of the sub-lattices at a given value of and for an arbitrary value of . Ideally, the cation disorder should take place between all three magnetic atoms. However, in our system, has a very strong preference to the octahedral sites; the octahedral site preference energy(OSPE) of has been found to be 46.7 kCal/mol while that of is 25.3 kCal/mol and that of is 0 ospe . Thus we can assume that the cation disorder will take place only between the and the atoms, that is, and respectively. In spite of this simplification, the compositions of the sub-lattices will be dependent upon the concentration of the atoms as shown in Table 1.
| Conc. | Composition at | Composition at |
|---|---|---|
| site | site | |
For , the two different patterns of sub-lattice occupancy shown in Table 1 will be identical. The reason behind different compositions for different ranges of is due to the fact that the total concentration at the tetrahedral sub-lattice cannot exceed 1; hence when the content is greater than the content, the atoms, in excess of 1 must occupy the octahedral sub-lattice. In case of ”complete inversion” i.e. , this is not satisfied if one uses the site occupancy patterns for ,listed in Table 1, for compositions with . The configurational entropy now assumes the form
The non-configurational contributions towards the entropy, such as the contributions from lattice vibrations, have been ignored in the expression for as they have found to be typically small compared to the configurational parts navr1 ; navr2 ; NN-app2 ; advfuncmat . However, for magnetic systems, contributions from the magnetic entropy can be important in cases of severe fluctuations in magnetic moments of a particular constituent advfuncmat . In the present work, we have incorporated it in the expression for wherever appropriate, and will be discussed later.
The cation disorder energy is the energy difference between a state with cation disorder and the ”normal” state () and should take into account the changes in the electrostatic and short-range interactions, the crystal fields and charge states. Neil and Navrotsky NN-model have shown that follows a quadratic dependence on in the form ; are the parameters. The quadratic dependence was also empirically recognised by Kriessman and Harrison harrison . The advantage of this simple dependence of on is that the total energies need to be calculated only for a few values of and the energies can be fitted to the quadratic form so that the energy of cation disorder can be interpolated for any value of between and . In the present work, we have calculated the total energies of our systems, at each , for three different values 0,0.5 and 1. The energies are then fitted to the above quadratic form, in order to obtain the dependence of on for the entire range of .
Modelling of the substitutional disorder in a condensed matter system is a challenging problem. Although disorder of any arbitrary degree is now routinely addressed by the mean field Coherent Potential Approximation (CPA) cpa in conjunction with multiple scattering Green’s function methods emto ; kkr , it has a serious limitation in dealing with systems having significant local distortions. In case of ternary spinels, the local distortion is substantial even without cation disorder as is being seen by the deviations of the oxygen parameter from it’s ideal value of NN-app2 ; biplab ; dd1 . With the introduction of a substituting element having very different ionic radius, the distortion gets amplified dd2 . Due to this, a recent investigation into the effects of Fe substitution in using the CPA had limited itself to very low concentration of Fe so that the local distortions do not have appreciable effects biplab . Since we are interested to explore the properties for the entire range of , varying between 0 and 1, we have taken the alternative approach of modelling the substitutional disorder by constructing supercells of the spinel unit cell. In this approach, addressing an arbitrary often becomes difficult as the supercell size becomes prohibitively large. We have therefore considered and for the present study. Such choices, nevertheless, cover the composition regimes where the experimental observations need to be addressed and interpreted.
For system, a unit cell of 14 atoms can be considered. This unit cell is sufficient for simulating the three different degrees of cation disorder given by for and only. Therefore, we have considered a 56 atom supercell for all except ; a 112 atom supercell, the minimum one, was required for this concentration in order to address all three degrees of cation disorder. In Table 2 we show the configurations at tetrahedral and octahedral sites for each and .
| Conc. | Cell | Composition | Composition | |
|---|---|---|---|---|
| size | at site | at site | ||
| 0.0625 | 112 | 0 | ||
| 0.5 | ||||
| 1.0 | ||||
| 0.125 | 56 | 0 | ||
| 0.5 | ||||
| 1.0 | ||||
| 0.25 | 56 | 0 | ||
| 0.5 | ||||
| 1.0 | ||||
| 0.50 | 56 | 0 | ||
| 0.5 | ||||
| 1.0 | ||||
| 0.75 | 56 | 0 | ||
| 0.5 | ||||
| 1.0 | ||||
| 1.0 | 56 | 0 | ||
| 0.5 | ||||
| 1.0 |
The magnetic configuration in all cases have been taken to be Neel neel configuration, with spins of and sub-lattices anti-aligned. Although the magnetic structure of the end compounds of the system under investigation are non-collinear at low temperatures, it is difficult to model, particularly since the progression of it with is not known. Thus we have considered the collinear Ferrimagnetic structure which would help in qualitative understanding of the magnetisation as the composition or degree of cation disorder is changed. Before fixing Neel configuration as the magnetic configuration, we have done several calculations with different spin configurations at different sub-lattices. In almost all cases, the Neel configuration came out to be energetically lowest. In cases where it was not, the lowest energy spin configurations were lower by less than 0.1 meV per atom. This, thus, further justifies consideration of Neel configuration for all and . The small values of energy differences between Neel and other configurations also indicate that the magnetic structures may be spin disordered.
The total energies, the structural parameters, the magnetic moments and the electronic structures were calculated by the DFT+U dft-u method using Projector Augmented Wave (PAW) paw basis set as implemented in VASP vasp code. The effects of electron localisation were addressed by the approach of Dudarev et al dudarev . The Hund’s coupling parameter was taken to be eV, while the Coulomb parameter was taken to be eV for , eV for and eV for . A plane wave cut-off of eV and a mesh centred at point for Brillouin zone integrations have been used throughout with the only exception for where a mesh was enough to achieve an energy convergence of eV. Force convergences of eV/ were ensured during structural relaxations.
III Results and Discussions
III.1 Temperature and concentration dependences of degree of cation disorder
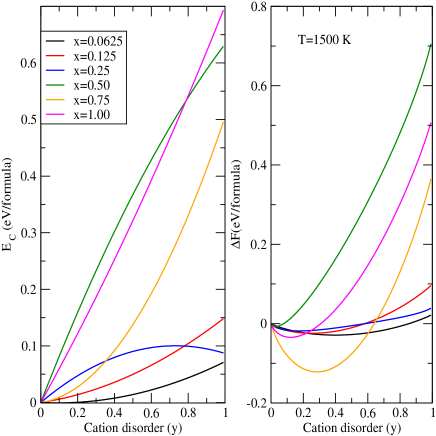
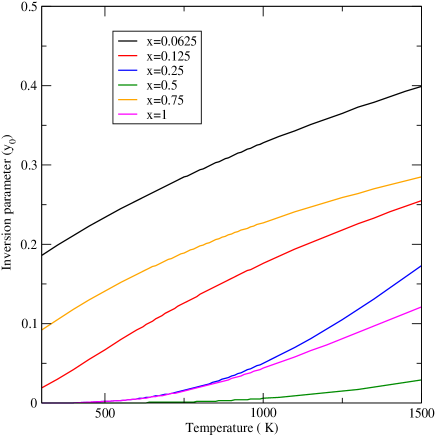
Before discussion of the physical properties of , it is required to find out the degrees of cation disorder between and as a function of concentration and the temperature . The temperature dependence is important because earlier works on various spinel compounds have demonstrated that may be quite sensitive to the annealing temperature anneal2 ; anneal3 ; navr5 ; NN-app2 . In Fig. 1 we show the dependences of the cation disorder energy and the configurational free energy of cation disorder on for different concentration , at a temperature K which is close to the annealing temperature of K reported in the experiment experiment . We find that the cation disorder is zero for all values of if we do not consider the configurational entropy. This implies that all substituting atoms will be occupying the octahedral sites if the effect of the entropy is not included. Upon inclusion of the entropy term, states with cation disorder that is with non-zero values of parameter are stabilised. The results suggest that the equilibrium value of at which is a minimum goes towards as increases till 0.5, that is, up to the composition when the and contents in the system are identical. Further increase in the content that is at increases the equilibrium value of before it is further reduced when the substitution is complete at . The quantitative variations of , the equilibrium value of , with temperature , presented in Fig. 2, shows this qualitative behaviour clearly. At K, and nearly for and respectively. At , the value of is which decreases to when . This result, thus, suggests that in the beginning of substitution in , a significant amount of prefers to occupy the tetrahedral positions, instead of the expected octahedral ones. As the content increases, more and more occupies the octahedral positions until one reaches the point where the content is equal to content (). Further increase in content initially puts some of it again in the tetrahedral sites, only to provide more preferences to the octahedral sites as the content increases towards complete substitution of . The importance of this result is that it supports the qualitative picture of site occupancies as conjectured in the experiments experiment . The differences with the picture provided by the experimentalists is that they did not predict the re-emergence of the phenomenon of atoms preference to tetrahedral sites after a critical composition. In the next sub-sections we will provide an explanation of this.
The other important outcome of the thermodynamics of cation disorder is that the degree of cation disorder in this system is not very robust as can be made out from the substantial variations in with temperature. For any value of , decreases continuously towards , and at room temperature the cation disorder for most of the compositions are insignificant. As cation disorder is suggested to be the reason behind non-regular behaviours of magnetisation and phenomenon such as magnetic compensation experiment , the importance of our results is that it provides the temperature range over which the degree of cation disorder is appreciable and hence the experimental preparation of the samples should be done accordingly. This also suggests that the cation disorder in these systems can be manipulated by controlling the temperatures. Such manipulations of cation disorder can substantially affect functional properties like the electrical conductivity as has been seen elsewhere advfuncmat .
III.2 Structural parameters and their variations with and
| Tetrahedral site | Octahedral site | |||||
| x | y | Co-O | Mn-O | Cr-O | Mn-O | Co-O |
| 0 | 0 | 2.00 | - | 2.01 | - | - |
| 0 | 2.00 | - | 2.01 | 2.07 | - | |
| 0.0625 | 0.5 | 2.00 | 2.04 | 2.01 | 1.98 | 2.10 |
| 1 | 2.00 | 2.04 | 2.01 | - | 2.10 | |
| 0 | 2.00 | - | 2.01 | 2.06 | - | |
| 0.125 | 0.5 | 2.00 | 2.04 | 2.01 | 1.97 | 1.97 |
| 1 | 1.99 | 2.03 | 2.01 | - | 1.97 | |
| 0 | 2.00 | - | 2.01 | 2.07 | - | |
| 0.25 | 0.5 | 2.00 | 2.04 | 2.01 | 2.07 | 1.97 |
| 1 | 1.99 | 2.03 | 2.01 | - | 1.96 | |
| 0 | 2.00 | - | 2.01 | 2.07 | - | |
| 0.5 | 0.5 | 2.00 | 2.04 | 2.01 | 2.07 | 1.95 |
| 1 | - | 2.03 | 2.01 | - | 1.95 | |
| 0 | 1.99 | - | 2.01 | 2.1 0.15 | - | |
| 0.75 | 0.5 | 2.00 | 2.04 | 2.01 | 2.06 0.1 | 2.09 0.03 |
| 1 | - | 2.03 | 2.02 | 2.1 0.14 | 2.03 0.04 | |
| 0 | 1.99 | - | - | 2.13 0.17 | - | |
| 1.0 | 0.5 | 2.02 | 2.02 0.04 | - | 2.1 0.13 | 2.09 0.07 |
| 1 | - | 2.02 0.04 | - | 2.12 0.14 | 2.04 0.12 | |
| 0 | 0 | 8.43 | 8.43 | 0.262 | 0.262 |
|---|---|---|---|---|---|
| 0 | 8.44 | 8.44 | 0.262 | 0.262 | |
| 0.0625 | 0.5 | 8.44 | 8.44 | 0.262 | 0.262 |
| 1 | 8.45 | 8.45 | 0.262 | 0.262 | |
| 0 | 8.45 | 8.45 | 0.262 | 0.262 | |
| 0.125 | 0.5 | 8.45 | 8.45 | 0.262 | 0.262 |
| 1 | 8.43 | 8.43 | 0.262 | 0.262 | |
| 0 | 8.46 | 8.46 | 0.261 | 0.261 | |
| 0.25 | 0.5 | 8.43 | 8.43 | 0.262 | 0.262 |
| 1 | 8.42 | 8.42 | 0.263 | 0.262 | |
| 0 | 8.48 | 8.48 | 0.261 | 0.261 | |
| 0.5 | 0.5 | 8.44 | 8.44 | 0.263 | 0.263 |
| 1 | 8.40 | 8.40 | 0.265 | 0.265 | |
| 0 | 9.08 | 8.26 | 0.254 | 0.264 | |
| 0.75 | 0.5 | 8.68 | 8.35 | 0.259 | 0.263 |
| 1 | 8.67 | 8.42 | 0.262 | 0.262 | |
| 0 | 9.20 | 8.22 | 0.250 | 0.264 | |
| 1.0 | 0.5 | 9.06 | 8.24 | 0.257 | 0.264 |
| 1 | 8.70 | 8.45 | 0.256 | 0.262 |
The first signature of cation disorder upon substitution in was noted from the non-regular variations in their measured lattice constants with increasing content, in the low content regime experiment . If the , expected to be in +3 charge state, had occupied the octahedral sites from the beginning, the lattice constant should have increased linearly with content as atoms have larger ionic radii than at octahedral sites shannon . We, therefore, first discuss the variations in the structural parameters with concentration of as well as with variations in the degree of cation disorder. In Table 3, we present various cation-anion bond distances at sites of different symmetries and their variations with and . In Table 4, we present the lattice constants and along with the oxygen parameters for various and . The lattice constants and the cation-anion bond distances are obtained from the DFT+U calculations. The oxygen parameters are then obtained as ucalc
where , the ratio of the average cation-anion bond distances at the octahedral and the tetrahedral sites; are obtained by concentration averages of individual cation-anion bond distances. The results show that for upto , the systems retain the cubic structure for all degrees of cation disorder, in agreement with the experiments. For and , a structural distortion leading to tetragonal phases are obtained, again in agreement with the experimental observations. Quantitatively, the lattice constants calculated by DFT+U are about higher than the experimentally measured ones. This is due to the choice of Generalised Gradient Approximation (GGA) gga in describing the Exchange-correlation part of the Hamiltonian. However, the qualitative agreement with the experiments is reasonably good, with a small increase in lattice constants with upto . It is to be noted that the experimentally observed deviation in the lattice constant from the expected linear behaviour was for very small range of () and the maximum change was only about . The maximum change in the DFT+U calculated lattice constant for the range is about , if we compare results of only. The comparisons of results with cation disorder only is justified as we see that between , the lattice constant does not change between and and that the equilibrium degree of inversion is well within this range of moving towards as increases. For the concentrations , we find that the qualitative nature of variations in the lattice parameters ( increases while decreases) with is in agreement with the experiment. For , the ratio (for ) obtained in our calculations is which agrees very well with the experimental value of experiment . We also find that the ratio decreases to when . Since our calculated equilibrium is in between and , the agreement with experiment would have been better had we considered the actual for the calculations. For , the calculated ratio varies from 1.1 to 1.04 as varies from to while the experimental value is . Thus our results qualitatively agree with the experiments as the calculated at this concentration is in between and . Comparison of our calculated parameters with experimental results for an arbitrary is not possible due to unavailability of reported experimental values. The comparisons can be made only for the end compounds. For , the calculated value of agrees well with the experimental value of cco2 . For , the calculated values of and for and (), respectively, agree reasonably well with the experimental results of and anneal1 . Thus, overall, our calculated structural parameters and their trends with are consistent with the trends of calculated with variations in .
We next turn our attentions to the variations of the lattice parameters with cation degree of disorder . The general trend seen in Table 4 is that with increase in , the lattice constants decrease, except at . This can be understood from the compositions of the tetrahedral and octahedral sites for different and and the variations in their bond distances (Table 3). For , we find that while the cation-anion bond distances at tetrahedral sites are insensitive to the degree of cation disorder, the octahedral bonds shorten considerably as changes from to . On the other hand, larger octahedral bond distances at state, bring the average octahedral cation-anion bond distances equal to that at . Thus the lattice constants for and are identical. For , the octahedral sites are completely occupied by the atoms making the average cation-anion bond distances associated with octahedral sites larger, resulting in a subsequent increase of the lattice constants with respect to . The noticeable changes in the lattice constants with for and can be understood from the considerable decrease in the octahedral bond distances with cation disorder. The significant reduction in the bond distances from their values at reduce the average octahedral cation-anion bond lengths and consequently the lattice constants. For and , the tetragonal distortions bring in a lot of dispersions in the bond distances as can be seen from Table 3. Once again, it is the octahedral bond lengths which decide the trends in the lattice constants. The overall decrease in the lattice parameter with is mainly brought about by the contracted bonds along the -direction; the increase in is due to subsequent expansions of the bonds in the -plane of the octahedra.
We now try to provide explanations as to why the octahedral bond distances reduce dramatically for certain concentrations and degrees of cation disorder. It is expected that at both sites will be having a +2 charge state. In that case, the effective ionic radius of should be at octahedral site and at tetrahedral sites shannon . The bond distances at tetrahedral sites, thus, would be considerably lower than that for at octahedral sites. Our calculations are consistent with this for for all degrees of cation disorder. For and , and for , our calculations show the opposite trend. This indicates that the at octahedral sites for these cases would either be in a +2 charge state with low spin or in a +3 charge state with either high or low spin(The effective ionic radii of in low spin state, in high spin state and in low spin states are and shannon respectively). From elementary crystal field theory cf , it is known that the OSPE of a configuration is more than that of a configuration in high spin state, while it is exactly opposite for a low spin state. Thus, the octahedral atoms for these and parameters are expected to be in a low spin +3 state ( configuration). The results on magnetic moments, and the electronic structures, discussed in next sub-sections confirm this and will be dealt in more detail.
The reason behind the tetragonal deformations at can also be understood from the crystal field theory. In a comprehensive work, Dunitz and Orgel dunitz had attributed the electronic configurations at the octahedral and tetrahedral sites to the degrees of distortion from cubic symmetry in spinels. Counting the average number of and electrons of tetrahedral and octahedral sites obtained from the charge states of the cations, we find that for , the octahedral sites have like configurations, which will give rise to a large distortion in order to lift the degeneracy associated with the states. With increase in the cation disorder, the presence of atoms in the octahedral site reduces the degeneracies associated with the orbitals. Thus, the degree of tetragonal distortions decrease as is seen from our calculated results of decreasing with increasing .
Finally, we try to explain the reason behind re-appearance of non-negligible cation disorder at after it had reduced to zero at . The arguments are based upon the bond distance results and elements of crystal field theory. From Table 3, we find that up to , octahedral bond distances were constant for state. At , these bond lengths increase as a whole. From elementary crystal field theory, we know that the crystal field parameter at octahedral site is inversely proportional to the cation-anion distance ()cf . Thus, when the bonds increase in lengths at , the corresponding octahedral crystal field will become weaker in comparison to that for other concentrations significantly. Consequently, the octahedral crystal field stabilisation energy for the atoms will reduce as it is decided by the strength of , resulting in an increased preference of atoms towards tetrahedral sites at in comparison to . This is exactly reflected in the re-emergence of non-zero at . In the next sub-sections we provide more conclusive evidences of the possible charge and spin states of various atoms in different crystal sites which will corroborate the explanations given here.
III.3 Magnetic properties and their dependencies on and
| 0 | -2.83 | - | -4.25 | - | - | -0.49 |
| 0.0625 | -2.83 | -3.34 | -2.15 | -0.50 | - | -0.50 |
| 0.125 | -2.83 | -3.31 | -2.77 | -0.40 | - | -0.50 |
| 0.25 | -2.80 | -3.28 | -2.70 | -1.06 | - | -0.47 |
| 0.50 | -2.59 (-2.36) | -3.38 (-3.42) | -1.34(-3.88) | -1.64 (-4.98) | -3.39 | -0.42 |
| 0.75 | -4.26 | -2.91 | - | -1.32 | -1.95 (out of plane) | -0.31 |
| -8.64 (in plane) | ||||||
| 1 | - | -3.47 | - | - | -1.054 (out of plane) | -0.30 |
| -9.46 (in plane) | ||||||
| Tetrahedral | site | Octahedral | site | ||||
|---|---|---|---|---|---|---|---|
| x | y | ||||||
| 0 | 0 | -2.68 | - | 2.95 | - | - | 2.95 |
| 0 | -2.68 | - | 2.95 | 3.86 | - | 3.07 | |
| 0.0625 | 0.5 | -2.68 | -4.50 | 2.95 | 3.23 | 2.71 | 2.84 |
| 1 | -2.68 | -4.46 | 2.95 | - | 2.56 | 2.72 | |
| 0 | -2.68 | - | 2.95 | 3.87 | - | 3.19 | |
| 0.125 | 0.5 | -2.68 | -4.50 | 2.95 | 3.41 | 2.71 | 2.73 |
| 1 | -2.68 | -4.50 | 2.98 | - | 0.18 | 1.76 | |
| 0 | -2.68 | - | 2.95 | 3.86 | - | 3.41 | |
| 0.25 | 0.5 | -2.67 | -4.50 | 2.93 | 3.84 | 0.05 | 2.00 |
| 1 | -2.68 | -4.49 | 2.91 | - | 0.02 | 0.58 | |
| 0 | -2.67 | - | 2.94 | 3.83 | - | 3.89 | |
| 0.5 | 0.5 | -2.68 | -4.48 | 2.93 | 3.81 | 0.00 | 1.05 |
| 1 | - | -4.48 | 2.89 | - | 0.10 | -1.81 | |
| 0 | -2.68 | - | 2.92 | 3.85 | - | 4.37 | |
| 0.75 | 0.5 | -2.69 | -4.49 | 2.88 | 3.80 | 2.72 | 2.53 |
| 1 | - | -4.40 | 2.89 | 3.80 | 3.07 | 2.54 | |
| 0 | -2.71 | - | - | 3.80 | - | 4.84 | |
| 1 | 0.5 | -2.68 | -4.48 | - | 3.70 | 2.71 | 3.01 |
| 1 | - | -4.39 | - | 3.78 | 3.07 | 3.02 |
The magnetisation measurements experiment on shows three distinct compositions ranges where the variations of magnetisations with composition are different, although in all three regions, the variations are linear. For , the magnetisation decreases and reaches the point of magnetic compensation. Further increase of shows a linearly increasing magnetisation till another critical point after which the magnetisation decreases again with increase in content. The explanation of this behaviour was based upon the canted spin structures observed in cco1 and anneal1 . The authors of Ref. experiment considered that like , the canted spin structure will have opposing spin alignments at the two octahedral sites with one of them (site ) aligning with the tetrahedral site. The magnetic compensation behaviour was, thus, attributed to the initial occupation of atoms at both tetrahedral and the other octahedral site with opposing spin alignments, thus, cancelling the net moment as content is increased. The reason behind increase of the magnetisation after compensation was thought of due to atoms occupying sites, diminishing the effects of atoms at sites gradually, till the next critical point, after which the extra atoms start occupying the sites again, bringing a decreasing trend in magnetisation as increases. The experimentalists, however, did not substantiate their claim with detailed calculations. Their magnetisation measurements also indicated that the canting angles changed upon substitution.
Before interpreting the experimental results and checking the validity of the arguments given in Ref. experiment we first present results on nearest neighbour inter-atomic magnetic exchange interactions for different in Table 5. These are calculated by mapping the DFT total energies for various collinear spin configurations on a Heisenberg Hamiltonian as is done elsewhere dd1 . The calculations are done primarily for the ”normal” spinel configuration (). Calculations for other values require prohibitively large resources and often led to trouble in convergences of self-consistent cycles. Hence, results for at is only presented. The main point that can be made out of these results is that and where stands for an atom at tetrahedral site and stands for an atom at octahedral site, are comparable , being negligible. The competing exchange interactions make the spin structure non-collinear throughout the entire range of as in agreement with experimental suggestion experiment . For the compositions where the crystal structure is cubic, do not vary much while the two prominent compete as changes. As the content reduces, the exchange interaction starts to strengthen at the expense of reduced interaction strength, until at , the strengths of the two interactions become comparable. At , atoms have other in their near neighbourhood due to their increasing content and thus have the strongest exchange interaction. The increased distances between atoms and between and atoms due to reduced content weaken and exchange interactions considerably. With further increase in the content, and with tetragonal distortion, has no or as nearest neighbours and the is dominated by the atoms. A strong anisotropy in the exchange interactions is observed due to the tetragonal distortions as was explained in Ref. dd2 . The spin structures at these compositions, are. therefore, expected to be more complicated.
Since it is extremely difficult to model these non-collinear spin structures, particularly since no experimental information is available for substituted samples, we took recourse to the results obtained from calculations on collinear Neel structure in order to interpret the experimental results qualitatively. Table 6 presents the results on atomic and total magnetic moments for each and . We find that the magnetic moments of tetrahedral and tetrahedral are insensitive to the changes in and . As expected, the moment of tetrahedral atom is close to implying that this is in a +2 charge state ( configuration). However, the moment of at tetrahedral site is rather close to which implies that this is primarily in a +2 charge state ( configuration). The reason behind this charge state of tetrahedral can be understood from the fact that the OSPE for in high spin state is 0 while that of is kCal/mol ospe and thus the probability of assuming +2 charge state is greater for tetrahedral in high spin state. Significant variations in the magnetic moments with changes in composition and in degree of cation disorder is observed for atoms at the octahedral sites, while the moments of and at octahedral sites have insignificant variations. The and atoms at octahedral sites are in high spin, +3 charge states for all and . The much greater OSPE of high spin and states in comparison to are responsible for this. The atoms at the octahedral positions oscillate between high spin and low spin states depending upon and . For , irrespective of the degree of cation disorder, the tetrahedral are in high spin and +2 charge states as is reflected in their moments being . For , while of cation disorder () still keeps spin and charge states same, complete ”inversion” () quenches the moment leading to a low spin state with moment . This trend continues till and is independent of the degree of cation disorder. The high spin state is regained at and remains intact for with irrespective of the degree of cation disorder. As was argues in the previous sub-section, the relative OSPE values cf for and clearly demonstrate that in the low spin state, would have a greater preference towards octahedral sites. One can relate the octahedral bond distances (Table 3) with the low spin +3 charge state in this case using elementary crystal field theory. The significant decrease in octahedral bond distances for a range of and , increases the octahedral crystal field. As a result these pair up the electrons. As the magnetic moment is close to zero, the configuration must be which is consistent with the preferred +3 charge state as predicted from results on OSPE. The regaining of the high spin state at can be understood from the increase in octahedral bond lengths due to the structural relaxations, and subsequent weakening of the octahedral crystal field. As was mentioned earlier, due to the low spin state of octahedral while the rest of the atoms at different sites are in high spin states, an additional magnetic entropy of is added to for the select and values. A non-zero value for these concentrations are obtained only if this magnetic entropy term is added. Thus, a cation disordered state at this concentrations is driven by the changes in the magnetic entropy.
Although the results are for collinear spin arrangements, in conjunction with the calculated values for each , a qualitative variation in the total magnetic moment quite similar to the experimentally observed can be extracted by careful analysis of the results. Since for is , the expected magnetic moment would be close to , the calculated value for . As the is in the range of for upto 0.25, the expected values of magnetic moments may show a decreasing trend as increases. An increase in the moment upon further increase of , that is in the range , is expected as the continuously reduces making the cation disorder close to zero, and thus the appropriate moments to look at from Table 6 would be the ones with which shows continuous increase with . Our results in the range , however, do not quite seem to follow experimental behaviour qualitatively. At , the magnetic moment when , the value at this concentration, should be close to if the results between and are interpolated. This will indicate a decrease of moment as changes from to agreeing with the experimental behaviour. But the same interpolation in case of puts the magnetic moment at this concentration close to which means an increase with respect to result at , in contradiction to the experimental trend. In spite of this disagreement, it is interesting that the results from collinear spin arrangement follow the experimental trend for a significant range of composition.
A qualitative model explaining the trends in the experimentally measured magnetisation can now be constructed by using the calculated atomic moments, the site occupancy patterns given in Table 1 and the alignments of sub-lattice spins obtained in the experiments. The experimental spin structure makes a distinction between two octahedral sub-lattices which our collinear spin arrangement does not. If instead of considering the occupancies of both octahedral sub-lattices to be identical, we consider that after part of occupying the tetrahedral sites in accordance with the pattern depicted in Table 1, the rest of the for a given completely occupies the sub-lattice which is anti-aligning with the other octahedral and the tetrahedral sub-lattice, then the experimental trends of magnetisation for is qualitatively reproduced. This can be understood the following way: If we consider the DFT calculated atomic magnetic moments as the moments of individual atoms in this picture and consider that the sub-lattice has and while has and , and the value for each is taken to be equal to that of the calculated , then with increase in , the contribution of sub-lattice will gradually increase in comparison to the other two which will reduce the net magnetic moment steadily. The increasing dominance of will be due to the fact that with increase in , the steadily decreases and with rather small , the content of at the tetrahedral site is always small. Since octahedral and tetrahedral have identical moments, their moments from and the tetrahedral sites will nearly cancel each other. being the carrier of larger magnetic moments would have the maximum effect. Thus the at site would control the magnetisation variation in this concentration range. With further increase in , the value is supposed to be getting smaller and nearly vanish for . Thus, in the concentration range , the is going to occupy the octahedral sites mostly. If we now once again let the occupancies of the two octahedral sites be different with most of the extra occupying the site, then the magnetic moment of the system will increase as increases. This is because of the fact that since the occupancy of sub-lattice would not change much from what it was for , more content at site with their spins anti-aligning to those of in site would increase the total moment as the spins of and the tetrahedral sites align. This occupancy pattern would continue till and possibly a little further up till about the critical point () observed experimentally. Since when , the expected occupancies in tetrahedral sub-lattice will be only, while both octahedral sub-lattices will have equal amounts of and . With further increase in and with expected value nearly zero, will have equal amounts of and and will be rich alloy, thus shooting up the magnetic moment further. At , the cation disorder returns. Now the cation disorder will be between tetrahedral and sites, with occupying the sites but the extra mostly occupies the sites. As a result, the total moment steadily decreases as increases. This picture, thus, not only supports what was espoused by the experimentalists, but also puts it on a solid theoretical footing by using information from first-principles calculations.
III.4 Electronic structures and their variations with and
| Cation disorder | |||
|---|---|---|---|
| x | 0.0 | 0.5 | 1.0 |
| 0.0 | 2.1 | - | - |
| 0.0625 | 0.77 | 0.66 | 1.99 |
| 0.125 | 0.70 | 0.33 | 1.61 |
| 0.25 | 0.38 | 0.64 | 1.53 |
| 0.50 | 0.15 | 0.58 | 1.44 |
| 0.75 | 0.23 | 0.48 | 0.62 |
| 1.0 | 0.33 | 0.00 | 0.56 |
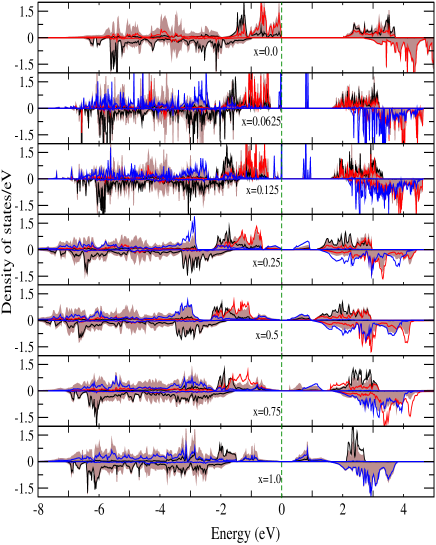
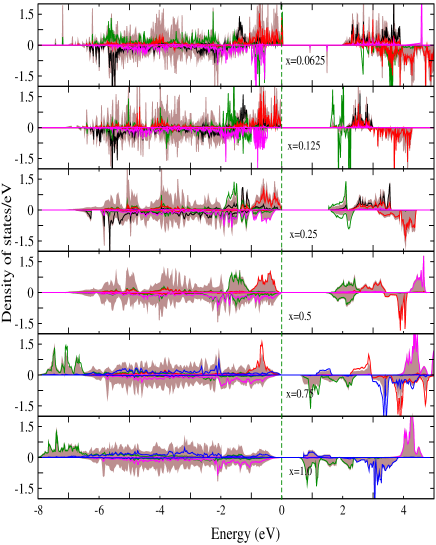
Finally we present results on the electronic structures with variations in for three degrees of cation disorder represented by and in Figures 3, 4,and 5 respectively. For the ”normal spinel” configuration (), the significant changes with content happens in the majority (spin up) band, where states occupy the states near Fermi level moving the states to lower energies. At low concentrations of , sharp peaks corresponding to half-filled states, are observed on both sides of Fermi level which smear with increase in the content. The and states dominate the majority band with increasing as expected. The contributions are around 3-4 eV below Fermi level, the states contribute mostly around 2-3 eV below Fermi level. The minority band consists of for energies below Fermi level. Thus, across the concentration range, is in a +2 state with fully filled and half-filled orbitals, is in a +3 state with half-filled and empty orbitals and is in a +3 state with completely filled and half-filled orbitals. Each of the three atoms retain their characteristics across the concentration range with the peaks corresponding to each of them occurring in distinctly separate energy regions. Due to the appearance of states in the gap after Fermi level, the band gap decreases with upto as reported in Table 7. For and , the band gap again increases due to changes in the characteristics of the densities of states with the structural distortions. This is due to the shift of the states near Fermi level and in the occupied part towards lower energy, At these concentrations, the majority and minority bands localise more, opening a larger gap. However, in going from to , the band gap reduces considerably, due to the more delocalised states as is apparent from the electronic structures presented here.
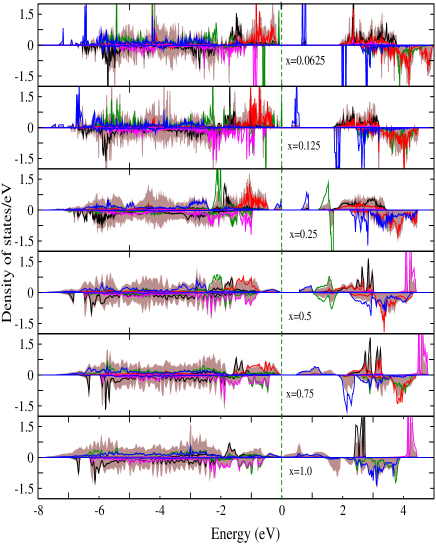
With cation disorder(), new and interesting features appear in the electronic structures. Like , we have sharp peaks coming from octahedral atoms in the unoccupied part of the majority band close to the Fermi energy for and . The contributions close to Fermi energy in the occupied part of the majority band now comes from states of at the octahedral sites. The octahedral contribution in the unoccupied part moves towards the Fermi level as changes from to , thus reducing the band gap, as happened for case. For these concentrations, the minority states near the Fermi level are made up of orbitals of octahedral and states of tetrahedral atoms. At these concentrations, both octahedral and tetrahedral atom densities of states show completely filled and half-filled orbitals. Thus at both sub-lattices are in +2 charge state. The densities of states significantly change at and continue to be so at . Now, the majority states in the occupied and unoccupied parts closest to the Fermi level are again due to the octahedral atoms which increases the band gap in comparison to that at . This happens as octahedral states in the majority band are sharply localised accommodating only the electrons. The states are now in the unoccupied part of the majority band and lie around 1-1.5 eV above Fermi level. The minority octahedral states consist of in the occupied part and in the unoccupied part. Thus, the orbitals of octahedral are completely full and the orbitals are completely empty. The octahedral atoms, therefore, are in low spin states and in a +3 charge configuration. This is consistent with our results on magnetic moments and the explanations based upon bond lengths. The strong splitting and localisations of the and states also signify a stronger crystal field. The features in the electronic structures, thus, support our arguments based upon crystal field theory given in earlier sub-sections. As a consequence, the band gaps increase from it’s value at . The densities of states again change substantially with onwards. The localised octahedral states for now delocalise considerably. The contributions due to states of octahedral appear at lower energies (at about -6 eV) indicating reduction of the crystal field and return of octahedral to a +2 charge state. For these concentrations octahedral start occupying the majority states near Fermi level and with a larger structural distortion at in comparison to , the octahedral states get energetically closer, reducing the band gap. Thus the band gap reduces to zero at . The highlights in the densities of states of the other component in the cation disorder, the atoms at the tetrahedral site have completely filled and states in the minority spin channel along with completely empty majority spin channel. This implies that the electronic configuration of this would be , a +2 charge state. Once again the results of the electronic structure confirms our picture on charge states as was discussed in earlier sub-sections.
With ”complete inversion” that is for , we now see larger splittings in the majority bands for any given concentration, in comparison to . Now the octahedral sites consist of only and atoms upto . In Reference dd2 , the octahedral crystal field parameters of and were calculated from first-principles. These were extracted from the pristine and . The results showed that the crystal field of is much stronger than that of . In here, we have seen that the states on either side of the Fermi level are occupied by the octahedral atoms. Thus, when the octahedral sites are occupied by primarily , it’s strong crystal field makes the band gaps larger in comparison to those for other degrees of cation disorder. With increasing substitution, the crystal field at the octahedral site starts losing it’s strength, a signature of which is in the appearances of octahedral states between 1-2 eV above Fermi level. Consequently, the band gap decreases with increase in concentration. A significant reduction in the band gap is observed when changes from to . In this case, the atoms have started to occupy the octahedral sites which reduces the crystal field further. However, another interesting feature of the densities of states at this concentration is that the tetrahedral states in the majority bands are now localised at a significantly lower energy region. Concurrently, there are more states of tetrahedral in the unoccupied part of the minority band at energies closer to the Fermi level. This is the reason behind drastic reduction in the band gap. This happens due to the alteration in the charge state of octahedral . Upto , this was in a low spin state due to the strong crystal field which paired all electrons leaving states empty. A inspection of the densities of states reveal that the crystal field is still strong with a significant splitting of and states. Moreover, a comparison of octahedral densities of states for and for this concentration show that in case of , the minority band had more densities of states in the energy region -0.5 to -2 eV below Fermi level. This implies that for , the octahedral has less electrons, and thus the charge state is probably +3. In the high spin state, octahedral has a higher OSPE cf than . Thus when all are made to occupy the octahedral sites as is done in case of , the expected charge state is +3. Therefore, the inferences from the features of the densities of states and the crystal field results are consistent. The tetrahedral densities of states are by and large similar to that for signifying that it’s charge state is insensitive to the degree of cation disorder.
One outcome of the systematic explorations of the densities of states is the variations in the nature of the band gap. Since the band gap depends both on the concentration and degree of cation disorder quite substantially, manipulation of the composition and the cation disorder can be a route to engineering band gap in this material which can be subsequently used for applications like solar cells. This widens the functional scope of this material.
IV Summary and Conclusions
With Density functional theory based techniques, we have investigated the thermodynamics of cation disorder, the structural, the magnetic and the electronic properties of compounds and analysed the results from their electronic structures and the elements of the crystal field theory. Our results support the model of cation disorder between and atoms as proposed by the experimentalists. The experimental non-regular behaviour of magnetisation as a function of concentration is explained on the basis of that. By generalising a thermodynamic model of cation disorder for compounds in this case, in conjunction with first-principles total energy calculations, we have quantified the cation disorder parameter for each concentration. Our results have explored the intimate relationships between the degree of cation disorder, the crystal fields associated with different atoms and their charge states, the structural and the magnetic properties. We have demonstrated that the non-regular behaviour of the magnetic moments and the structural properties can be traced back to the features in their electronic structures. Our results show that the occupancies at the octahedral sites and the associated crystal fields can explain the variations in the properties with varying composition and degree of cation disorder. By calculating the variations in the electronic band gap with variations in composition and degree of cation disorder, we have shown that the functionalities of this material can be enhanced by engineering the band gap through careful manipulation of the composition and the degree of disorder.
Overall, this work has paved a way to compute the thermodynamics of cation disorder in a magnetic spinel and perform subsequent analysis to understand the microscopic details of such systems. In the context of the specific system considered in this work, our results have provided a robust theoretical background for interpretation of the experimental results.
V Acknowledgments
The computation facilities from C-DAC, Pune, India and from Department of Physics, IIT Guwahati funded under the FIST programme of DST, India are acknowledged.
References
- (1) C.J.Kriessman and S.E.Harrison, Phys. Rev.103, 857 (1956).
- (2) F.C.Romeijn, Phillips Res. Rep. 8, 304 (1953).
- (3) S.Miyahara and H.Ohnishi, J. Phys. Soc. Jpn. 12, 1296(1956).
- (4) G.E.Bacon and F.F.Roberts, Acta Crystallogr.6, 51(1953).
- (5) L.M.Corliss,J.M.Hastings and F.G.Brockmann, Phys. Rev. 90, 1073 (1953).
- (6) J.E.Weindenborner, Acta Crystallogr.20, 761 (1966).
- (7) S.Asbrink, Acta. Chem. Scand. 19, 1706 (1965).
- (8) B.Boucher,R.Buhl and M. Perrin, J. Appl. Phys., 40, 1126 (1969).
- (9) R.Buhl, J. Phys. Chem. Solids, J. Phys. Chem. Solids, 30, 805 (1969).
- (10) R.J.Hill,J.R.Craig, and G.V.Gibbs, Phys. Chem. Miner., 4, 317 (1979).
- (11) B.Boucher, R.Bull and M. Perrin, J. Appl. Phys., 39, 632 (1968).
- (12) N.V.Minh and I-S. Yang, Vib. Spectr., 35, 93 (2004).
- (13) H.S.C.O’Neill,M.James,W.A.Dollase and S.A.T.Redfern, Eur. J. Mineral., 17, 581 (2005).
- (14) G. H. Jonker, J. Phys. Chem. Solids 9,165(1985).
- (15) P.F.Ndione, Y.Shi, V.Stevanovic, S.Lany, A.Zakutayev, P.A.Parilla, J.D.Perkins, J.J.Berry,vD.S.Ginley, and M.F.Toney, Adv. Func. Mat., 24, 610 (2014).
- (16) B.P.Urubega, D.Barcorisen, R.Smith, J.A.Ball, R.W.Grimes, A.F.Voter, and K.E.Sickafus, Phys. Rev. B75, 104116 (2007).
- (17) K.E.Sickafus, A.C.Larson, N.Yu, et al., J.Nucl.Mater., 219, 128 (1995).
- (18) L.Schwarz,Z.Galazka,T.M.Gesing and D.Klimm, Cryst. Res. Technol., 50, 961 (2015).
- (19) S.H.Lee, C.Broholsm, T.H.Kim, W.Ratcliff and S.W.Cheong, Phys. Rev. Lett. 84, 3718 (2000)
- (20) J.H.Chung, M.Matsuda, S.H.Lee, K.Kakurai, H.Ueda, T.J.Sato, H.Takagi, K.P.Hong and S.P.Park, Phys. Rev. Lett. 95, 247204 (2005)
- (21) Y. Yamasaki, S. Miyasaka, Y. Kaneko, J.-P. He, T. Arima and Y. Tokura Phys. Rev. Lett. 96 207204 (2006)
- (22) K.Dey, S. Majumdar, and S.Giri, Phys. Rev. B90, 184424 (2014).
- (23) S.Weber, P.Lunkenheimer, R.Fichtl, J.Hemberger, V.Tsurkan, and Y. Tokura, Phys. Rev. Lett. 96, 207204 (2006)
- (24) K.Tomiyasu, J.Fukunaga, and H.Suzuki, Phys. Rev. B70, 214434 (2004).
- (25) G.Lawes,B.Melot,K.Page,C.Ederer,M.A.Hayward,T.Proffen, and R.Seshadri, Phys. Rev. B 74, 024413 (2006).
- (26) Y.J.Choi, J.Okamoto, D.J.Huang, K.S.Chao, H.J.Lin, C.T.Chen, M.van Veenendaal, T.A.Kaplan, and S.-W.Cheong, Phys. Rev. Lett. 102, 067601 (2009).
- (27) V.Tsurkan, S.Zherlitsyn, S.Yasin, V.Felea, Y. Skourski, J. Deisenhofer, H.-A. Krug von Nidda, J. Wosnitza, and A. Loidl, Phys. Rev. Lett. 110, 115502 (2013).
- (28) R. Padam Phd Thesis (IIT Guwahati) (2014).
- (29) R. Padam, S. Pandya, S. Ravi, A. K. Grover, and D. Pal Appl. Phys. Lett. 102,112412 (2013).
- (30) R. Padam, S.Pandya, S. Ravi, A. K. Grover, and D. Pal AIP Conf. Proc. 1512,1112 (2013).
- (31) H-G. Zhang, W-H. Wang, E-K. Liu, X-D. Tang, G-J. Li, H-W. Zhang, and G-H. Wu, Phys. Stats. Solidi B250, 1287 (2013).
- (32) G.A. Sawatzky, F. Van Der Woude, and A.H. Morrish, Phys. Rev. 187, 747 (1969)
- (33) R.D.Shannon, Acta Crystallogr. A32, 751 (1976).
- (34) H. G. Zhang, Z. Wang, E. K. Liu, W. H. Wang,M. Yue and G. H. Wu, J. Appl. Phys. 117, 17B735 (2015)
- (35) J.Habjanic, M. Juric, J. Popovic, K. Molcanov, and D. Pajik, Inorg. Chem. 53, 9633 (2014).
- (36) A. Navrotsky and O.J. Kleppa, J. Inorg. Nucl. Chem. 29, 2701 (1967)
- (37) Y. Seminovski, P.Palacios, P.Wahnon and R. Grau-Crespo, Appl. Phys. Lett. 100, 102112 (2012).
- (38) A. Seko, F. Oba, and I. Tanaka, Phys. Rev. B 81, 054114 (2010)
- (39) E.J.Palin, A.M.Walker, and R.J.Harrison, Am. Mineral. 93, 1363 (2008)
- (40) F. Tielens, M. Calatayud, R. Franco, J.M. Recio, J. Perez-Ramirez, and C. Minot, J. Phys. Chem. B 110, 988 (2006)
- (41) C. Jiang, K.E. Sickafus, C.R. Stanek, S.P. Rudin, and B.P. Uberuga, Phys. Rev. B 86, 024203 (2012).
- (42) D. Santos-Carballal, A. Roldan, R. Grau-Crespo, and N. H. de Leew, Phys. Rev.B 91, 195106 (2015).
- (43) D.S.Mclure, J. Phys. Chem. Solids, 3, 311 (1957).
- (44) H.S.C. O’ Neill and A. Navrotsky Am. Mineral. 68,181-194 (1983).
- (45) C.J.Kriessman and S.E. Harrison, Phys. Rev. 103, 857 (1956).
- (46) P. Soven, Phys. Rev. 156, 809 (1967).
- (47) L. Vitos, Phys. Rev. B 64 014107(2001).
- (48) H. Ebert, D. Kodderitzsch, and J. Minar, Rep. Prog. Phys., 74, 096501.
- (49) S. Ganguly, R. Chimata, and B. Sanyal, Phys. Rev. B 92, 224417 (2015).
- (50) D.Das, and S. Ghosh, J. Phys. D: Appl. Phys. 48, 425001 (2015)
- (51) D.Das, R. Biswas, and S. Ghosh, arXiv:1606.03176 (2016).
- (52) L. Neel, Ann. Phys.(N.Y.) 3, 137 (1948).
- (53) V.I.Anisimov, F.Aryasetiawan and A.I. Liechtenstein, J. Phys. Condens. Matt. 9, 767 (1997).
- (54) P.E.Blochl, Phys. Rev. B50, 17953 (1994).
- (55) G.Kresse and J. Furthmuller, Comput. Mater. Sci. 6, 15 (1996).
- (56) S.L.Dudarev,G.A.Botton,S.Y.Savrasov,C.J.Humphreys and A.P.Sutton, Phys. Rev.B57, 1505 (1998).
- (57) K.E.Sickafus, J.M.Wills, and N.W. Grimes, J. Am. Ceram. Soc. 82, 3279 (1999).
- (58) J.P. Perdew, K. Burke, and M. Ernzerhorf, Phys. Rev. Lett. 77, 3865 (1996).
- (59) B.N. Figgis, and M.A. Hitchman, Ligand Field Theory and it’s Applications, Wiley VCH (1999)
- (60) J.D. Dunitz and L.E. Orgel, J. Phys. Chem. Solids, 3, 20 (1957).