Caught in the Act: Direct Detection of Galactic Bars in the Buckling Phase
Abstract
The majority of massive disk galaxies, including our own, have stellar bars with vertically thick inner regions – so-called “boxy/peanut-shaped” (B/P) bulges. The most commonly suggested mechanism for the formation of B/P bulges is a violent vertical “buckling” instability in the bar, something that has been seen in -body simulations for over twenty years, but never identified in real galaxies. Here, we present the first direct observational evidence for ongoing buckling in two nearby galaxies (NGC 3227 and NGC 4569), including characteristic asymmetric isophotes and (in NGC 4569) stellar-kinematic asymmetries that match buckling in simulations. This confirms that the buckling instability takes place and produces B/P bulges in real galaxies. A toy model of bar evolution yields a local fraction of buckling bars consistent with observations if the buckling phase lasts 0.5–1 Gyr, in agreement with simulations.
1 Introduction
Approximately 60–70% of disk galaxies in the local universe have stellar bars (e.g., Eskridge et al., 2000; Menéndez-Delmestre et al., 2007). A wide variety of observational evidence indicates that many bars are vertically thickened in their inner regions, appearing as “boxy” or “peanut-shaped” (B/P) bulges when seen edge-on; this includes our own Galaxy, whose bulge is mostly if not entirely part of its bar (e.g., Shen et al., 2010; Di Matteo et al., 2014). Edge-on galaxies with B/P bulges show gas and stellar kinematics consistent with a rotating bar in the disk plane (Kuijken & Merrifield, 1995; Bureau & Freeman, 1999; Merrifield & Kuijken, 1999; Veilleux et al., 1999; Chung & Bureau, 2004); moderately inclined barred galaxies show isophotes consistent with the projection of B/P bulges within the bars (Bettoni & Galletta, 1994; Quillen et al., 1997; Athanassoula & Beaton, 2006; Erwin & Debattista, 2013); and face-on barred galaxies show kinematic and morphological signatures of B/P bulges as well (Méndez-Abreu et al., 2008; Laurikainen et al., 2014).
Recent studies suggest that failing to account for the presence of B/P bulges can lead to significantly overestimating the luminosities and masses of “classical” (spheroidal) bulges in disk galaxies (Laurikainen et al., 2014; Athanassoula et al., 2015). This can potentially bias our understanding of how bulges are related to other galaxy properties, including the key correlations between supermassive black holes and bulges (e.g., Kormendy & Ho, 2013). Understanding the formation of B/P bulges is thus an important part of understanding and constraining models of galaxy (and black hole) evolution.
The most frequently invoked mechanism for forming these structures is the buckling instability of the bar, a brief but violent vertical instability which occurs (in simulations) not long after the bar forms. In simulations, the formation of the bar increases the radial velocity dispersion of stars in the disk; this leads to a highly anisotropic velocity dispersion tensor and the vertical destabilization of the bar (Raha et al., 1991; Merritt & Sellwood, 1994). Following a phase of asymmetric vertical buckling, the inner part of the bar settles into the more vertically symmetric form of a B/P bulge.
Despite over twenty years of simulations which show buckling, no observed buckling has (yet) been reported for real galaxies, a situation called “puzzling” in the review of Shen & Li (2016). An alternative model proposes that B/P bulges form by the trapping of single orbits into vertical resonances, leading to more gradual, vertically symmetric growth (Combes et al., 1990; Quillen, 2002; Debattista et al., 2006; Berentzen et al., 2007; Quillen et al., 2014). In some simulations, the presence of gas weakens or prevents buckling, while still allowing symmetric bar thickening (Berentzen et al., 1998; Debattista et al., 2006; Berentzen et al., 2007; Wozniak & Michel-Dansac, 2009). Thus, it is not clear that real galaxies must suffer the buckling instability. There are also no clear, strong differences due to the different formation mechanisms in the resulting end-stage B/P bulges, making it difficult to determine from observations of existing B/P bulges how they were formed.
In this Letter, we present evidence for ongoing buckling in the bars of two local spiral galaxies (NGC 3227 and NGC 4569), thus demonstrating that buckling of bars definitely occurs in real galaxies. We also argue that the observed fraction of buckling bars at is at least broadly consistent with most (or even all) B/P bulges being the result of buckling, if the buckling phase lasts –1 Gyr – as is predicted by -body simulations.
2 Buckling and Morphology
2.1 -body Simulations
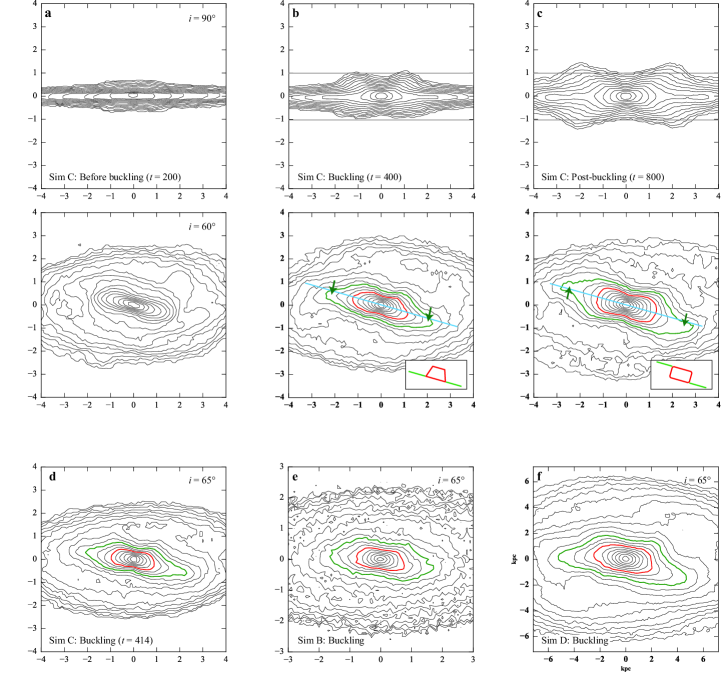
-body simulations have long predicted that bars should buckle some time after they form. In this Letter, we use four such simulations, three of which were previously analyzed in Erwin & Debattista (2013). For consistency, we use a similar naming scheme: “Simulation A–C” in this paper correspond to “runs A–C” in Erwin & Debattista. These three simulations are described in more detail in Erwin & Debattista and (for simulations B and C) in Sellwood & Debattista (2009); they included 300,000–500,000 stellar particles in the disk and softening lengths of 60 pc (Simulation A) or 0.05 natural units (B and C). Simulation D is almost identical to model T2 of Debattista et al. (2016). It is comprised of thin+thick disks inside a dark matter halo, with 3 million stellar particles and a softening length of 50 pc. The two disks have roughly the same radial velocity dispersion profile, but the thin disk has half the height of the thick disk (versus a height ratio of one-fourth for model T2); see Debattista et al. for further details.
2.2 Projected Morphology
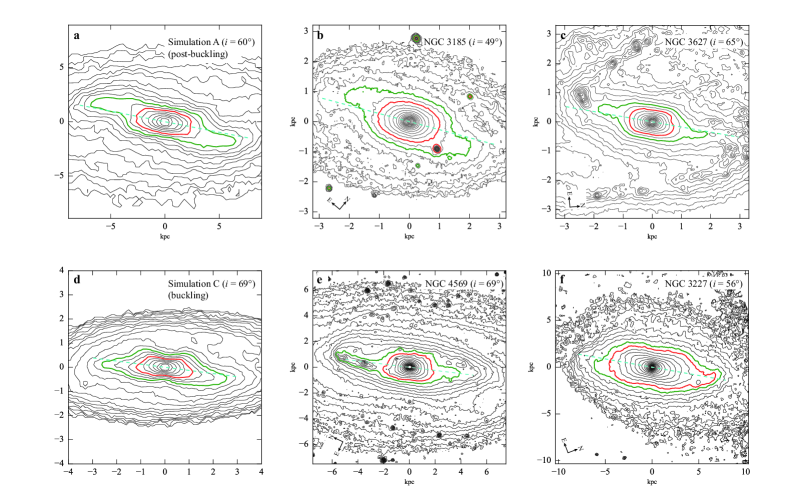
Erwin & Debattista (2013) compared -body simulations and real barred galaxies to show that it was possible to identify B/P bulges in bars even at inclinations as low as . (The advantage of intermediate inclinations – e.g., – over more edge-on orientations is that the bar as a whole is readily identifiable and measurable, regardless of whether its interior is vertically thick or not.) The key isophotal signatures are a broad, often boxy inner zone (corresponding to the vertically thick, B/P part of the bar) and thinner “spurs” extending beyond (corresponding to the vertically thin outer parts of the bar); the spurs are usually offset from the major axis of the inner zone, so that the projected bar has 180° rotational symmetry on the sky (Fig. 1c, 2a).
When simulations in the buckling phase are viewed at the same intermediate inclinations, however, the projected bar shows trapezoidal inner isophotes (corresponding to the main buckling region) and outer spurs which are offset in the same direction relative to the bar’s observed major axis, forming a continuation of the trapezoid’s long side (Fig. 1b, d–f, 2d). This morphology clearly differs from the symmetric-box plus counter-offset spurs seen in post-buckling bars with their symmetric B/P bulges.
3 Detection of Buckling Bars in NGC 3227 and NGC 4569
3.1 Morphology
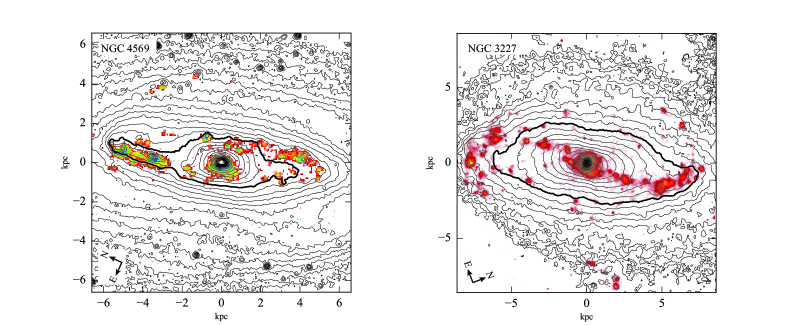
As part of a survey of local barred galaxies with favorable orientations for detecting and measuring projected B/P bulges (Erwin & Debattista, in prep), we have found two examples of bars with morphologies indicating that they are currently in the buckling phase: NGC 3227 and NGC 4569 (M90). In both galaxies, the inner or middle region of the bar shows quasi-trapezoidal isophotes (most clearly in NGC 4569), while the outer-bar spurs are offset in the same direction and connect to the long side of the trapezoid (Fig. 2e,f). This morphology is a good match to the general appearance of projected -body bars in the buckling phase. Although both galaxies are currently experiencing star formation within their bars, comparison of their near-infrared morphologies with published H images allows us to rule out the possibility that recent star formation is responsible for the overall morphology (Fig. 3).
The best case is probably NGC 4569, which shows a symmetric inner trapezoid and clear offset spurs; it differs from the simulations (Figure 1) in having a relatively compact buckling region, with a half-length 1.9 kpc (measured along its long axis), quite small relative to the bar as a whole (, where half-length of the bar). The trapezoidal region in NGC 3227 is much larger ( kpc, ), with some resemblance to Simulation B (Figure 1e); the interior of the trapezoid appears less symmetric, which may be partly due to emission from recent star formation (Figure 3). Nonetheless, the outer isophotes show the characteristic offset-spurs pattern. The relative sizes of the buckling regions in these two galaxies fall near the lower and upper limits for the range of symmetric B/P bulge sizes seen in local barred galaxies: –0.58, with a mean of 0.38 (Erwin & Debattista, 2013).
3.2 Stellar Kinematics
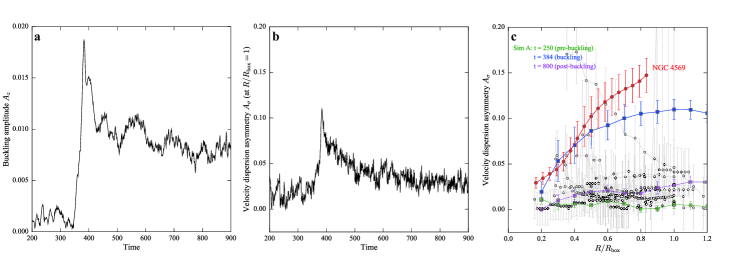
The buckling phase in our simulations is also accompanied by asymmetries in the stellar velocity dispersion , measured along the major axis of the bar. For simulated bars before and after the buckling phase, the dispersion is roughly symmetric about the center: , where is measured along the bar major axis. During the buckling phase, however, the dispersion becomes strongly asymmetric. To quantify this, we computed a mean asymmetry measure:
| (1) |
where the dispersion is measured in radial bins on either side of the galaxy center, out to a maximum distance . Symmetric dispersion profiles have values of close to 0, while more asymmetric profiles have larger values.
To determine for a simulation, we first matched the orientation of NGC 4569 (the only one of the two galaxies with sufficiently extended stellar kinematics) by rotating the simulation so that the bar was PA = 26° away from the line of nodes, and then inclining it by about the line of nodes. We measured velocity dispersions as the square root of the variance of particle line-of-sight velocities, using a slit width of 0.2 and evenly spaced bins of radial size 0.05 (simulation units) along the major axis of the projected simulation. For observational comparison, we used published velocity dispersion data for NGC 4569 and ten barred galaxies with known (symmetric) B/P bulges which had inclinations and bar orientations similar to the two buckling-bar galaxies; these galaxies and the sources of kinematic data are listed in Table 1. For all but two of the symmetric-B/P galaxies, we use long-slit data, if the position angle of the slit was within 30° of the bar major axis. For NGC 3627 and NGC 4293, we extracted pseudo-long-slit measurements along the bar major axes from published integral-field-unit (IFU) velocity-dispersion data (Falcón-Barroso et al., 2006; Dumas et al., 2007). Finally, we derived velocity-dispersion measurements for NGC 4569 from the IFU data of Cortés et al. (2015).
Fig. 4b shows the time evolution of in simulation C, with equal to the size of the boxy/trapezoidal region once it has formed ( in simulation units). The onset of buckling at (Fig. 4a) is accompanied by rapid growth in the dispersion asymmetry (Fig. 4b), which gradually returns to near symmetry () as the inner part of the post-buckled bar settles into a mature B/P bulge. Fig. 4c shows radial trends in for NGC 4569 and the ten symmetric-B/P galaxies, and also for representative times from simulation C. Galaxies with symmetric B/P bulges (gray symbols) show minimal asymmetry (in almost all cases ), especially for larger , as do the pre- and post-buckling simulation profiles. For NGC 4569 (red symbols), however, the asymmetry increases as approaches the size of the buckling region – just as in the simulation during the buckling phase (blue symbols).
4 The Evolution of Barred Galaxies and the Frequency of Buckling
We are currently studying a sample of local barred galaxies in order to identify and measure B/P bulges (Erwin & Debattista, in prep). This sample is diameter- and distance-limited ( and Mpc, to ensure adequate resolution of bar interiors) and includes a total of 84 barred S0–Sd galaxies which have inclinations and orientations that maximize the detectability of B/P bulges (–70°, deprojected PA between bar and disk major axis ). All galaxies were examined (using near-IR images) for the morphology of B/P bulges (Erwin & Debattista, 2013). We find B/P bulges to be extremely common in high-stellar-mass galaxies: they are present in % of the 44 barred disks with .
The two buckling-bar galaxies were identified as part of this sample, and are in the high-stellar-mass () subsample. The frequency of observed buckling in local, high-mass barred galaxies is thus %. Is this frequency high or low? Put another way, is it consistent with the possibility that many – or even all – B/P bulges are the result of the buckling instability?
To test this hypothesis, we adopted a toy galaxy-evolution model in which the fraction of disk galaxies with visible bars is a linear function of redshift, equal to at and decreasing to 0 at redshift ; we based this on the observed evolution of bar fraction with redshift in spiral galaxies (e.g., Sheth et al., 2008; Cameron et al., 2010; Melvin et al., 2014) and recent cosmologically-motivated simulations of bar formation and growth (Kraljic et al., 2012). (We note that the simulated galaxies in Kraljic et al. all have , consistent with the local high-mass subsample we are considering, and that the high-redshift observational studies have similar lower limits on .) Following the pattern observed in -body simulations, we assumed that there is a delay between bar formation and buckling, equal to Gyr, followed by a visible buckling phase lasting Gyr, and ending with a permanently B/P-hosting bar.
We performed a Markov Chain Monte Carlo analysis of this model, computing the likelihood as the product of individual binomial likelihoods for the fraction of galaxies with bars , the fraction of bars with B/P bulges , and the fraction of bars currently buckling , compared with the observed counts in our local high-mass subsample (Erwin & Debattista, in prep.); we assumed a flat prior for and flat priors for values for the other parameters. We used the emcee ensemble sampler code of Foreman-Mackey et al. (2013), with 50 separate chains and 500 steps per chain, discarding the first 150 steps in each chain. After marginalizing over and as nuisance parameters, we find Gyr and Gyr (medians and 68% confidence intervals). These are in good agreement with values from -body simulations, which typically find –2 Gyr and –1 Gyr (Martinez-Valpuesta & Shlosman, 2004; Martinez-Valpuesta et al., 2006; Saha et al., 2013).
We conclude that the observed frequency of buckling bars at is consistent with the predictions of -body simulations, and that the buckling instability could plausibly account for most if not all instances of B/P bulges in massive disk galaxies in the local universe. (We note, however, that given the small numbers involved, our observations do not rule out the possibility that some of B/P bulges could be the result of alternate, symmetric growth mechanisms.) Direct confirmation of this would involve imaging of bars in the buckling phase at higher redshifts. Our simple model predicts a maximum buckling fraction of at ; near-IR detection of buckling in large bars ( kpc) at this redshift is feasible with the upcoming James Webb Space Telescope.
References
- Athanassoula & Beaton (2006) Athanassoula, E. & Beaton, R. L. 2006, Mon. Not. R. Astron. Soc., 370, 1499
- Athanassoula et al. (2015) Athanassoula, E., Laurikainen, E., Salo, H., & Bosma, A. 2015, Mon. Not. R. Astron. Soc., 454, 3843
- Berentzen et al. (1998) Berentzen, I., Heller, C. H., Shlosman, I., & Fricke, K. J. 1998, Mon. Not. R. Astron. Soc., 300, 49
- Berentzen et al. (2007) Berentzen, I., Shlosman, I., Martinez-Valpuesta, I., & Heller, C. H. 2007, Astrophys. J., 666, 189
- Bettoni & Galletta (1994) Bettoni, D. & Galletta, G. 1994, Astron. Astrophys., 281, 1
- Bettoni & Galletta (1997) Bettoni, D. & Galletta, G. 1997, Astron. Astrophys. Supp., 124, 61
- Bureau & Freeman (1999) Bureau, M. & Freeman, K. C. 1999, Astron. J., 118, 126
- Cameron et al. (2010) Cameron, E., Carollo, C. M., Oesch, P., Aller, M. C., Bschorr, T., Cerulo, P., Aussel, H., Capak, P., Le Floc’h, E., Ilbert, O., Kneib, J., Koekemoer, A., Leauthaud, A., Lilly, S. J., Massey, R., McCracken, H. J., Rhodes, J., Salvato, M., Sanders, D. B., Scoville, N., Sheth, K., Taniguchi, Y., & Thompson, D. 2010, Mon. Not. R. Astron. Soc., 409, 346
- Chung & Bureau (2004) Chung, A. & Bureau, M. 2004, Astron. J., 127, 3192
- Combes et al. (1990) Combes, F., Debbasch, F., Friedli, D., & Pfenniger, D. 1990, Astron. Astrophys., 233, 82
- Cortés et al. (2015) Cortés, J. R., Kenney, J. D. P., & Hardy, E. 2015, Astrophys. J.s, 216, 9
- Debattista et al. (2006) Debattista, V. P., Mayer, L., Carollo, C. M., Moore, B., Wadsley, J., & Quinn, T. 2006, Astrophys. J., 645, 209
- Debattista et al. (2016) Debattista, V. P., Ness, M., González, O. A., Freeman, K., Zoccali, M., & Minniti, D. 2016, MNRAS, submitted
- Di Matteo et al. (2014) Di Matteo, P., Haywood, M., Gómez, A., van Damme, L., Combes, F., Hallé, A., Semelin, B., Lehnert, M. D., & Katz, D. 2014, Astron. Astrophys., 567, A122
- Dumas et al. (2007) Dumas, G., Mundell, C. G., Emsellem, E., & Nagar, N. M. 2007, Mon. Not. R. Astron. Soc., 379, 1249
- Erwin & Debattista (2013) Erwin, P. & Debattista, V. P. 2013, Mon. Not. R. Astron. Soc., 431, 3060
- Eskridge et al. (2000) Eskridge, P. B., Frogel, J. A., Pogge, R. W., Quillen, A. C., Davies, R. L., DePoy, D. L., Houdashelt, M. L., Kuchinski, L. E., Ramírez, S. V., Sellgren, K., Terndrup, D. M., & Tiede, G. P. 2000, Astron. J., 119, 536
- Fabricius et al. (2012) Fabricius, M. H., Saglia, R. P., Fisher, D. B., Drory, N., Bender, R., & Hopp, U. 2012, Astrophys. J., 754, 67
- Falcón-Barroso et al. (2006) Falcón-Barroso, J., Bacon, R., Bureau, M., Cappellari, M., Davies, R. L., de Zeeuw, P. T., Emsellem, E., Fathi, K., Krajnović, D., Kuntschner, H., McDermid, R. M., Peletier, R. F., & Sarzi, M. 2006, Mon. Not. R. Astron. Soc., 369, 529
- Foreman-Mackey et al. (2013) Foreman-Mackey, D., Hogg, D. W., Lang, D., & Goodman, J. 2013, PASP, 125, 306
- Héraudeau et al. (1999) Héraudeau, P., Simien, F., Maubon, G., & Prugniel, P. 1999, Astron. Astrophys. Supp., 136, 509
- Kennicutt et al. (2003) Kennicutt, Jr., R. C., Armus, L., Bendo, G., Calzetti, D., Dale, D. A., Draine, B. T., Engelbracht, C. W., Gordon, K. D., Grauer, A. D., Helou, G., Hollenbach, D. J., Jarrett, T. H., Kewley, L. J., Leitherer, C., Li, A., Malhotra, S., Regan, M. W., Rieke, G. H., Rieke, M. J., Roussel, H., Smith, J.-D. T., Thornley, M. D., & Walter, F. 2003, PASP, 115, 928
- Knapen et al. (2004) Knapen, J. H., Stedman, S., Bramich, D. M., Folkes, S. L., & Bradley, T. R. 2004, Astron. Astrophys., 426, 1135
- Koopmann et al. (2001) Koopmann, R. A., Kenney, J. D. P., & Young, J. 2001, Astrophys. J.s, 135, 125
- Kormendy & Ho (2013) Kormendy, J. & Ho, L. C. 2013, Ann. Rev. Astron. & Astrophys., 51, 511
- Kraljic et al. (2012) Kraljic, K., Bournaud, F., & Martig, M. 2012, Astrophys. J., 757, 60
- Kuijken & Merrifield (1995) Kuijken, K. & Merrifield, M. R. 1995, Astrophys. J., 443, L13
- Laurikainen et al. (2014) Laurikainen, E., Salo, H., Athanassoula, E., Bosma, A., & Herrera-Endoqui, M. 2014, Mon. Not. R. Astron. Soc., 444, L80
- Martinez-Valpuesta & Shlosman (2004) Martinez-Valpuesta, I. & Shlosman, I. 2004, Astrophys. J., 613, L29
- Martinez-Valpuesta et al. (2006) Martinez-Valpuesta, I., Shlosman, I., & Heller, C. 2006, Astrophys. J., 637, 214
- Melvin et al. (2014) Melvin, T., Masters, K., Lintott, C., Nichol, R. C., Simmons, B., Bamford, S. P., Casteels, K. R. V., Cheung, E., Edmondson, E. M., Fortson, L., Schawinski, K., Skibba, R. A., Smith, A. M., & Willett, K. W. 2014, Mon. Not. R. Astron. Soc., 438, 2882
- Méndez-Abreu et al. (2008) Méndez-Abreu, J., Corsini, E. M., Debattista, V. P., De Rijcke, S., Aguerri, J. A. L., & Pizzella, A. 2008, ApJL, 679, L73
- Menéndez-Delmestre et al. (2007) Menéndez-Delmestre, K., Sheth, K., Schinnerer, E., Jarrett, T. H., & Scoville, N. Z. 2007, Astrophys. J., 657, 790
- Merrifield & Kuijken (1999) Merrifield, M. R. & Kuijken, K. 1999, Astron. Astrophys., 345, L47
- Merritt & Sellwood (1994) Merritt, D. & Sellwood, J. A. 1994, Astrophys. J., 425, 551
- Mulchaey et al. (1997) Mulchaey, J. S., Regan, M. W., & Kundu, A. 1997, Astrophys. J.s, 110, 299
- Pizzella et al. (2004) Pizzella, A., Corsini, E. M., Vega Beltrán, J. C., & Bertola, F. 2004, Astron. Astrophys., 424, 447
- Quillen (2002) Quillen, A. C. 2002, Astron. J., 124, 722
- Quillen et al. (1997) Quillen, A. C., Kuchinski, L. E., Frogel, J. A., & Depoy, D. L. 1997, Astrophys. J., 481, 179
- Quillen et al. (2014) Quillen, A. C., Minchev, I., Sharma, S., Qin, Y.-J., & Di Matteo, P. 2014, Mon. Not. R. Astron. Soc., 437, 1284
- Raha et al. (1991) Raha, N., Sellwood, J. A., James, R. A., & Kahn, F. D. 1991, Nature, 352, 411
- Saha et al. (2013) Saha, K., Pfenniger, D., & Taam, R. E. 2013, Astrophys. J., 764, 123
- Sellwood & Debattista (2009) Sellwood, J. A. & Debattista, V. P. 2009, Mon. Not. R. Astron. Soc., 398, 1279
- Shen & Li (2016) Shen, J. & Li, Z.-Y. 2016, Galactic Bulges, 418, 233
- Shen et al. (2010) Shen, J., Rich, R. M., Kormendy, J., Howard, C. D., De Propris, R., & Kunder, A. 2010, Astrophys. J., 720, L72
- Sheth et al. (2008) Sheth, K., Elmegreen, D. M., Elmegreen, B. G., Capak, P., Abraham, R. G., Athanassoula, E., Ellis, R. S., Mobasher, B., Salvato, M., Schinnerer, E., Scoville, N. Z., Spalsbury, L., Strubbe, L., Carollo, M., Rich, M., & West, A. A. 2008, Astrophys. J., 675, 1141
- Simien & Prugniel (1997) Simien, F. & Prugniel, P. 1997, Astron. Astrophys. Supp., 126, 15
- Simien & Prugniel (2000) —. 2000, Astron. Astrophys. Supp., 145, 263
- Veilleux et al. (1999) Veilleux, S., Bland-Hawthorn, J., & Cecil, G. 1999, Astron. J., 118, 2108
- Wozniak & Michel-Dansac (2009) Wozniak, H. & Michel-Dansac, L. 2009, Astron. Astrophys., 494, 11
| Galaxy | PA | Bar PA | PA | Slit PA | Source | ||
|---|---|---|---|---|---|---|---|
| NGC 615 | 69 | 158 | 162 | 11 | 155 | 11 | 1 |
| NGC 1023 | 66 | 69 | 58 | 26 | 87 | 35 | 2 |
| NGC 2962 | 53 | 7 | 168 | 30 | 175 | 17 | 3 |
| NGC 3031 | 58 | 150 | 160 | 18 | 137 | 97 | 2 |
| NGC 3627 | 65 | 175 | 161 | 31 | 161 | 18 | 4 |
| NGC 4293 | 63 | 65 | 77 | 25 | 75 | 17 | 5 |
| NGC 4429 | 63 | 90 | 106 | 32 | 93 | 45 | 6 |
| NGC 4569 | 69 | 25 | 15 | 26 | 15 | 24 | 7 |
| NGC 4725 | 42 | 40 | 50 | 13 | 35 | 63 | 8 |
| NGC 6744 | 52 | 21 | 177 | 36 | 0 | 29 | 9 |
| NGC 7531 | 59 | 22 | 7 | 27 | 15 | 14 | 1 |
Note. — For each galaxy we list its name, inclination, position angle (on the sky) of the disk, position angle of the bar, deprojected angle between the bar and disk major axis, position angle of the slit (or pseudo-slit for IFU data), radius of the B/P bulge within the bar, and sources of kinematic data used for Figure 4. References for kinematic data: 1 = Pizzella et al. (2004); 2 = Fabricius et al. (2012); 3 = Simien & Prugniel (2000); 4 = Dumas et al. (2007); 5 = Falcón-Barroso et al. (2006); 6 = Simien & Prugniel (1997); 7 = Cortés et al. (2015); 8 = Héraudeau et al. (1999); 9 = Bettoni & Galletta (1997).