Quantum Coherence as a Witness of Vibronically Hot Energy Transfer in Bacterial Reaction Centre
Abstract
Photosynthetic proteins have evolved over billions of years so as to undergo optimal energy transfer to the sites of charge separation. Based on spectroscopically detected quantum coherences, it has been suggested that this energy transfer is partially wavelike. This conclusion critically depends on assignment of the coherences to the evolution of excitonic superpositions. Here we demonstrate for a bacterial reaction centre protein that long-lived coherent spectroscopic oscillations, which bear canonical signatures of excitonic superpositions, are essentially vibrational excited state coherences shifted to the ground state of the chromophores . We show that appearance of these coherences is brought about by release of electronic energy during the energy transfer. Our results establish how energy migrates on vibrationally hot chromophores in the reaction centre and they call for a re-examination of claims of quantum energy transfer in photosynthesis.
For efficient photosynthesis, energy migrates through large chromophore assemblies to the active site of charge generation. This transfer is generally downhill in energy, but every energy transfer step must obey the law of energy conservation. This means that vibrational or environmental modes take up the excess energy of each transfer step. However, the identification of these critical modes and their coupling to electronic transitions is difficult, because they are not readily observable in conjunction with energy transfer using current spectroscopic methods.
Following absorption of a short laser pulse, the electron cloud and atoms oscillate coherently across the molecules; electronic and vibrational coherences are established. Coupling to the environment, for example to solvent molecules or a protein binding pocket, leads to dephasing of these coherences across the molecules. Vibrational wave packets have been observed in photosynthetic proteins using femtosecond transient absorption experiments in the visible and near infrared spectral regions (Vos1994, ; Savikhin1994, ). In addition, polarisation-resolved experiments provided early evidence for electronic coherences in photosynthetic proteins (Arnett1999, ; Savikhin1997, ). The advent of two-dimensional electronic spectroscopy (2DES) opened a new avenue for studying electronic and vibrational coherences (Jonas2003, ; Engel2007, ; Nemeth2008, ). The higher dimensionality of the data in these experiments leads to less spectral congestion, thereby enabling more detailed insight (Brixner2005, ; Zigmantas2006PNAS, ; Thyrhaug2016, ).
In the 2DES experiment a sequence of three ultrashort laser pulses (with time delays and between them) excites the sample. A third order polarisation is induced in the sample and the emitted signal field is detected with a fourth pulse at after the last excitation pulse. The evolution of the excited states is then resolved in the two-dimensional spectra relating excitation () and detection frequencies (), which are Fourier transform conjugates of the and time delays, respectively (Jonas2003, ). Coherences between states are detected as oscillatory signals along . It is very challenging to distinguish between electronic or vibrational origin of the coherences, but polarisation resolved 2DES (Hochstrasser2001, ; Schlau-Cohen2012, ; Westenhoff2012, ; Lim2015, ), an additional Fourier transform over population time (Li2013, ; Milota2013, ), and theoretical analyses (Butkus2012, ; Seibt2013, ) have been developed to this end.
The first reports on 2D electronic spectra of light-harvesting proteins created excitement, because it was concluded that electronic coherences live for more than a picosecond (Engel2007, ; Collini2010, ; Schlau-Cohen2012, ). This would suggest that energy could migrate wave-like through the photosynthetic proteins. This far-reaching conclusion relies on the assignment of the observed oscillations to electronic coherences. From the outset, electronic coherences surviving in proteins for picoseconds seem questionable, because the environment as well as intramolecular vibrations readily induce fluctuation of electronic transitions on a femtosecond time scale. Thus electronic coherences should decay much faster than vibrational coherences, which typically dephase within a couple of picoseconds.
The issue of mismatching timescales comes to a head in the reaction centre protein (Fig. 1a). There, a particular set of oscillations exist, which are candidates for excitonic coherences with the lifetime of picoseconds (Lee2007, ; Westenhoff2012, ). However, excitations in the reaction centre transfer away from the participating states within (Jonas1996, ). Since coherences cannot “outlive” populations, an unsettling mismatch between the experimental observation and this fundamental quantum mechanical principle arises (Ryu2014, ).
2DES spectroscopy of .
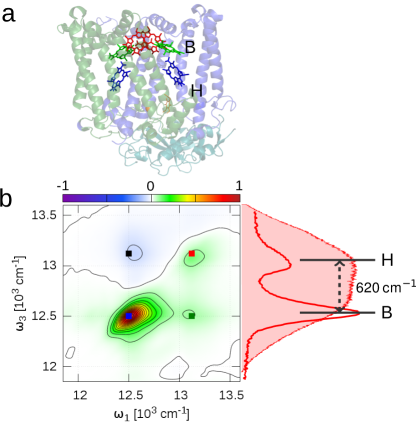
We performed 2DES experiments on Rhodobacter sphaeroides reaction centres grown from the carotenoid deficient R-26 strain (). The protein comprises two strongly coupled bacteriochlorophyll molecules, forming a special pair, two accessory bacteriochlorophylls , and two bacteriopheophytins (Fig. 1a). To enable the use of 2DES at a high laser repetition rate () and to avoid complication of the spectra from charge transfer signals, we used with a chemically oxidised special pair () at . This shortens the photocycle considerably by preventing charge separation, without altering the rate of energy transfer to the special pair (Jackson1997, ).
The linear absorption spectrum of the reaction centre at (Fig. 1b) shows two distinct peaks. The peaks are separated by and are associated with the excitonic bands B and H, which have dominant bacteriochlorophyll and bacteriopheophytin contributions respectively (Fig. 1b). The diagonal peaks in the 2D absorption spectra measured at match the absorption bands (Fig. 1b). The positive cross-peak below the diagonal indicates coupling and excitation energy transfer between H and B. The negative-valued region above the diagonal arises from the excited state absorption of B. This absorption also masks the upper H-B cross-peak. We did not observe any distinct features of the two branches of in the 2DES data.
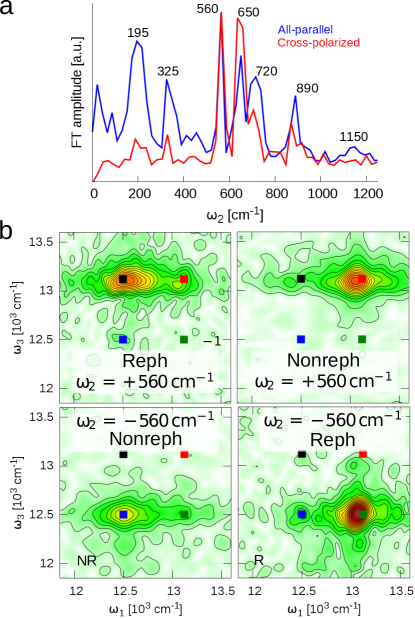
Features in the 2D spectrum decay or rise monotonously along and have oscillatory components (Westenhoff2012, ). The former reports on the populations of excited states and the latter indicates coherences. To extract the coherent oscillations we subtracted multiexponential fits in each point of the 2D spectrum. The amplitude of these oscillatory residuals, integrated across the 2D spectra, reveal frequencies of 195, 325, 560, 650, 725, 890, (blue line, “all-parallel” measurement, Fig. 2a). All of these frequencies can be identified as peaks in the resonance Raman spectra of B (Cherepy1997b, ; Czarnecki1997, ).
Picosecond oscillations in bear all signatures of electronic coherences.
The assignment of the origin of these coherences was achieved in two steps. Firstly, we used a cross-polarisation scheme (relative polarisations of for laser pulses 1 to 4), which strongly suppresses signals of purely vibrational coherences (produced by Franck-Condon excitation of vibrational wavepackets) (Westenhoff2012, ; Schlau-Cohen2012, ). Indeed, the measurement shows that the amplitudes of the frequencies at 195, 325, 725, 890 and are decreased relative to the frequencies at (Fig. 2A, red line, “cross-polarised”). The sustained frequencies are close to the energy gap between B and H (, see Fig. 1b). This has previously been considered as an indication for an electronic contribution to the coherences (Schlau-Cohen2012, ; Westenhoff2012, ). Secondly, we Fourier transformed the complex-valued 2DES data along . This yields oscillation maps of and (2D slices of the 3D spectrum), with the positive and negative frequencies separating the system response evolving as or during the population time , which is very useful in separating different contributions (Seibt2013, ; Li2013, ). When measured with the cross-polarised pulse sequence, the amplitude maps at and show peaks on the off-diagonal (rephasing pulse order) and diagonal (non-rephasing pulse order) (Fig. 2b). A similar pattern is observed for the coherence at (Supplementary information Fig. S2). This pattern is as expected for electronic coherence between the two excitonic states (Butkus2012, ).
Thus, the coherences at 560 and for , if interpreted according to the current understanding of the molecular electronic response, would be concluded to be electronic. However, we determined that the lifetime of the two coherences is longer than (see Supplementary information Fig. S5), which is by an order of magnitude longer than the lifetime of the underlying B and H states. This paradox prompted us to search for an alternative photophysical explanation.

ETICS offers a comprehensive interpretation for the observed coherences.
To resolve this mismatch we inspect the oscillation maps at , measured with the all-parallel pulse sequence. The general pattern of the map computed from the complex-valued data is consistent with a combination of coherences in the excited state (stimulated emission, SE) and ground state (ground state bleach, GSB) pathways (Fig. 3b, Supplementary information, section 2). We do not consider excited state absorption (ESA) here, because of its small contribution (see 1b). When computing the oscillation map from real-valued data, a cancellation of the signal on the B peak diagonal appears (Fig. 3a). This is inconsistent with the simple sum of the SE and GSB pathways, as these pathways should interfere constructively. However, since the data with was omitted in our computation of oscillation maps the SE signal are expected to be negligible in the oscillation maps. This is because the energy transfer to is essentially complete at this time.
We therefore propose that all coherences observed in the maps (Fig. 3ab) are in the ground state. For the SE-like pathways, the first two laser pulses create a coherence which is either purely vibrational in the B excited state or it has mixed vibronic origin (Christensson2012, ). Then, the coherence is shifted to the ground state. Here, vibrational wavepacket can live for several picoseconds, independent of the excited state lifetime. The shift of coherence is the key component of our proposal. We consider that it is induced by the energy transfer from B to (Mancal2014, ) and we therefore term this process Energy Transfer Induced Coherence Shift (ETICS) (Fig. 4c).
ETICS response pathways presented in Fig. 3 show that they should produce signals, which have an opposite sign (-phase shift) compared to the corresponding signals from SE pathways (Mancal2014, ) (Supplementary information Fig. S3). The zero signal node in the B diagonal (Fig. 3a) is then readily explained, because the ground state bleach pathways and ETICS pathways overlap and cancel out 111The lack of total cancellation is accounted for by the opposite phase sweep across the oscillation peaks in the GSB and ETICS signals (see Supplementary information section 2).. The inclusion of the ETICS pathways also agrees with the observed relative amplitudes of the peaks in the oscillation maps in Fig. 3 (see Supplementary information section 2). Notably, we find the nodal line in other oscillation frequency maps as well, which is consistent with the ETICS process, which should occur for all vibrational wavepackets (Supplementary information Fig. S1 and S2).
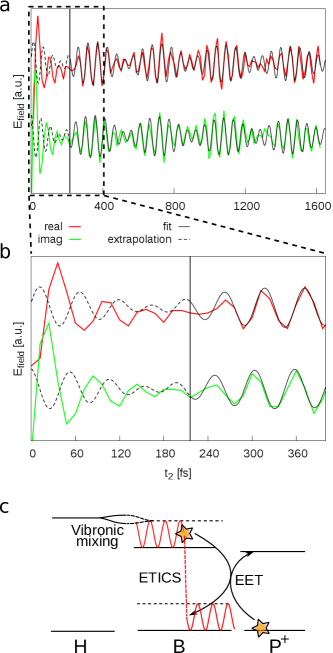
In ETICS, the SE coherence shifts to the ground state within , which should result in a -phase shift in the oscillatory signal. This behaviour is observable at a spectral position, which is clear of the GSB oscillation signals from impulsive Raman scattering (Tiwari2013, ). Therefore, we search for the phase flip in the kinetic trace of the upper cross-peak in the cross-polarisation measurement (Fig. 4ab), where only one ETICS pathway is expected. The real and imaginary oscillating residuals are fitted simultaneously in the time window to a sum of two complex exponentials, which account for the two frequencies at and . The fits are then extrapolated to . Indeed, a -phase shift is observed in the absorptive (real) and refractive (imaginary) part of the signal during the characteristic time of the energy transfer from B to (see Fig. 4). The agreement with the expected behaviour for ETICS is excellent, especially when considering that the initial oscillating signal up to can contain different contributions, including an electronic H-B coherence, purely vibrational coherences, or coherences of the mixed vibronic origin (Christensson2012, ).
Generality of ETICS.
How general is the ETICS phenomenon? One strict requirement is that energy transfer occurs while vibrations cool. Another requirement is that the vibrational modes on the ground and excited electronic states are similar. Both requirements are often fulfilled in photosynthetic proteins, including reaction centres and light-harvesting complexes. Thus ETICS can be expected to be general.
Importantly, ETICS retains exactly the same beating patterns as the corresponding SE pathways. Therefore, its spectral signatures can be easily misinterpreted as long-lived coherences with electronic character (Westenhoff2012, ). For example, the oscillation maps of a plant reaction centre protein by Fuller et al. (Fuller2014, ) show that the signal on the diagonal line cancels, which is not reproduced by the model proposed in their study, but could be explained by the ETICS process.
Moreover, the hypothesis that energy transport in photosynthetic proteins is wave-like rests on the assignment of coherences to the superposition of excitonic states (Engel2007, ; Collini2010, ; Schlau-Cohen2012, ). ETICS provides an alternative coherence assignment and therefore calls for reconsideration of wave-like energy transfer. Clearly, a careful analysis of beatings in other photosynthetic proteins is needed for accurate designation of contributing photophysical phenomena.
Vibronic mixing in .
Finally, we clarify why long-lived coherences with certain frequencies (i. e. and ) are observed in the cross-polarised measurement, even though this pulse sequence excludes all vibrational coherences generated by the Franck-Condon excitations (Schlau-Cohen2012, ; Westenhoff2012, ). This is revealed by the signals in the oscillation maps for (Fig. 2b, for , see Supplementary information Fig. S2). We find that the observed oscillation patterns for the cross-polarised pulse sequence (Fig. 2b) match well with only two ETICS pathways in the rephasing signal (see Supplementary information for detailed pathway analysis). These pathways can only contribute to the signal if the two transitions and (see Feynman diagrams in Fig. 3a) have non-parallel transition dipole moments. Thus the initially excited states in the aggregate must be vibronically coupled, i.e. state consists of the non-adiabatic mixture of the vibronically excited state of accessory bacteriochlorophyll and the electronically excited state of bacteriopheophytin. This implies that vibrations are at least partly delocalized between accessory bacteriochlorophyll and bacteriopheophytin. Thus, we find that vibronic mixing occurs in and that is is essential for the observation of ETICS pathways in the cross-polarised measurement. However, it is not necessary for ETICS to occur.
Vibronic mixing has recently been suggested for natural (Womick2011, ; Christensson2012, ; Chin2013, ; Tiwari2013, ) and synthetic (Lim2015, ) light-harvesting complexes. It has been proposed to facilitate energy transfer (Womick2011, ; Tiwari2013, ; Perlik2015, ), and it has also been used to explain long-lived quantum coherences (Christensson2012, ; Tiwari2013, ; Ferretti2013, ; Fuller2014, ; Romero2014, ; Ryu2014, ). In particular, Christenson et al. predicted that mixing of atomic and electronic degrees of freedom leads to the slow dephasing of mixed vibronic coherences in the excited state(Christensson2012, ). However, because the lifetime of the excited states is shorter than 200 fs, we do not consider this hypothesis a viable explanation for the long-lived beatings in .
Tiwari et al. proposed that vibronic coupling opens up a new response pathway by which direct excitation of mixed ground state coherences is facilitated (Tiwari2013, ). This model was used to interpret the long-lived oscillating signals observed in the two-colour photon echo experiments of (Ryu2014, ). However, we do not find the predicted strong asymmetry of oscillation amplitudes in the cross-peaks above and and below the diagonal in the 2D spectra (see Fig. 2b and Supplementary information section 4 for details). Moreover, the pathways suggested in Ref. (Tiwari2013, ) are inconsistent with the phase shift which we observe on the 200-fs time scale (Fig. 4) leading to cancellation of the oscillating signals appearing on the diagonal (Fig. 3a). Thus, we conclude that direct excitation of ground state vibrational coherence as proposed by Tiwari et al. is not dominant in .
Hot energy transfer in facilitated by vibrational dissipation in the ground state.
Although we identify ETICS as a shift of vibrational coherences between electronic states, equivalent shifts of populations are equally possible. This indicates energy transfer from hot B to the special pair, while a vibrational quantum is left on the accessory bacteriochlorophyll. Thus, the vibrational modes on the accessory bacteriochlorophylls work as a sink by taking up the excess energy from energy transfer between B and the special pair. In this study we show that many vibrational modes on accessory bacteriochlorophylls can acts as an energy sink for the energy transfer step (Schulze2016, ). Energy conversion demands the existence of such modes, but it has not been possible to detect them spectroscopically. Consequently, these modes have usually been approximated as spectral densities in theory of energy transfer. Our finding opens a new possibility to directly follow the dissipation of excess energy in excitation transfer into vibrations of the molecules.
We identified the special modes which have frequencies close to the B-H resonance. They have a twofold effect on energy transfer. Firstly, vibronic mixing increases the rate of energy transfer between B and H (Womick2011, ; Tiwari2013, ), leading to the efficient population of hot B. Secondly, these modes accelerate energy transfer further from hot B to the special pair, before vibrational relaxation on B takes place on a picosecond time scale. As seen from a molecular perspective, the atoms of the chromophore are already set to oscillate within an appropriate mode in the excited state, priming the molecules for energy transfer. Thus certain modes appear to be an integral part of downhill energy transfer, increasing its overall efficiency. The availability of these special modes of chromophores may explain the extraordinarily fast energy transfer rates in reaction centre proteins. Also, the possibility that the protein uses these modes to control the directionality of the flow of energy should not be disregarded.
Materials and Methods
were isolated from , R-26 following standard procedures described elsewhere (Farhoosh1997, ) with modifications described in Supporting Information. To oxidise , potassium ferricyanide () was added to a final concentration of 150 mM. Samples were mixed with glycerol at 35:65 (v/v) and cooled down to in a cell made of fused silica. The samples typically had an optical density of 0.2 to 0.3 at .
Spectroscopy setup: The data acquisition protocol and the analysis were described previously (Brixner2004, ; Augulis2011, ; Augulis2013, ). Briefly, a noncolinear optical amplifier was pumped by the fundamental of a Pharos laser system (Light Conversion Ltd). The resulting laser pulses were split into four beams using a beamsplitter and a transmissive diffraction grating. Spherical optics were used to focus all beams to on the sample spot. The forth beam was attenuated by and OD=2 filter. The first two beams were simultaneously chopped by mechanical choppers and a double frequency lock-in detection scheme was used. Interferograms were continuously detected by the CCD camera (PIXIS, Princeton Instruments).
A repetition rate of with excitation energies of and per pulse were used for all-paralell and cross-polarised measurements, respectively. This translates to excitation density of photons per pulse per for the pulse energy. The population time step was , which defines the high frequency cut-off of frequency to . The coherence time was scanned between – (–) with the step for all-parallel (cross-polarised) measurements, respectively. In both axis, the resolution was typically () for the all-parallel (cross-polarised) experiments (Supplementary information, section 6).
The sequences of 2D spectra in were Fourier transformed to generate three-dimensional FT spectra. To reduce the complexity of the third order response signals and avoid multiple resonant and nonresonant contributions during the pulse overlap, we analysed the oscillating signals in a following way. We extracted the oscillatory components in by subtracting multi-exponential fits with complex amplitude prefactors from each () data point. The Fourier transforms of the remaining oscillating residuals in yields the three-dimensional FT spectra. By slicing these spectra in we extracted the () coherence amplitude and/or phase maps of oscillations with frequency. The resolution along is determined by the length of the scan, and for all-paralell and cross-polarised, respectively and was and for all-paralell and cross-polarised, respectively.
Acknowledgements
We would like to thank Darius Abramavicius, Vytautas Butkus, Leonas Valkunas, Tõnu Pullerits and Tomáš Mančal for helpful discussions. The work in Lund was supported by the Swedish Research Council and Knut and Alice Wallenberg foundations. S.W. and P. E. acknowledge funding from the Foundation of Swedish Research Sweden, the Olle Engkvist Byggmästare Foundation and the Swedish Research Council.
Author contributions
D.P., S. W. and D.Z. conceived and designed the experiments. D.P. performed the experiments. D.P. analysed the data. P.E. grew and purified the sample. D.P., D.Z., SW and E.P. wrote the paper. All authors discussed the results and commented on the manuscript.
Additional information
The authors declare no competing financial interests.
References
- (1) Vos, M. et al. Coherent dynamics during the primary electron-transfer reaction in membrane-bound reaction centers of Rhodobacter sphaeroides. Biochemistry 33, 6750–6757 (1994).
- (2) Savikhin, S., Zhu, Y., Lin, S., Blankenship, R. E. & Struve, W. S. Femtosecond Spectroscopy of Chlorosome Antennas from the Green Photosynthetic Bacterium Chloroflexus aurantiacus. J. Phys. Chem. 98, 10322–10334 (1994).
- (3) Arnett, D. C., Moser, C. C., Dutton, P. L. & Scherer, N. F. The First Events in Photosynthesis: Electronic Coupling and Energy Transfer Dynamics in the Photosynthetic Reaction Center from Rhodobacter sphaeroides. J. Phys. Chem. B 103, 2014–2032 (1999).
- (4) Savikhin, S., Buck, D. R. & Struve, W. S. Oscillating anisotropies in a bacteriochlorophyll protein: Evidence for quantum beating between exciton levels. Chem. Phys. 223, 303–312 (1997).
- (5) Jonas, D. M. Two-dimensional femtosecond spectroscopy. Annu. Rev. Phys. Chem. 54, 425–463 (2003).
- (6) Engel, G. S. et al. Evidence for wavelike energy transfer through quantum coherence in photosynthetic systems. Nature 446, 782–786 (2007).
- (7) Nemeth, A. et al. Vibronic modulation of lineshapes in two-dimensional electronic spectra. Chem. Phys. Lett. 459, 94 – 99 (2008).
- (8) Brixner, T. et al. Two-dimensional spectroscopy of electronic couplings in photosynthesis. Nature 434, 625–8 (2005).
- (9) Zigmantas, D. et al. Two-dimensional electronic spectroscopy of the b800–b820 light-harvesting complex. Proc. Natl. Acad. Sci. USA 103, 12672–12677 (2006).
- (10) Thyrhaug, E., Žídek, K., Dostál, J., Bína, D. & Zigmantas, D. Exciton structure and energy transfer in the fenna–matthews–olson complex. J. Phys. Chem. Lett. 7, 1653–1660 (2016).
- (11) Hochstrasser, R. Two-dimensional IR-spectroscopy: polarization anisotropy effects. Chem. Phys. 266, 273–284 (2001).
- (12) Schlau-Cohen, G. S. et al. Elucidation of the timescales and origins of quantum electronic coherence in LHCII. Nat. Chem. 4, 389–395 (2012).
- (13) Westenhoff, S., Paleček, D., Edlund, P., Smith, P. & Zigmantas, D. Coherent picosecond exciton dynamics in a photosynthetic reaction center. J. Am. Chem. Soc. 134, 16484–16487 (2012).
- (14) Lim, J. et al. Vibronic origin of long-lived coherence in an artificial molecular light harvester. Nat. Commun. 6 (2015).
- (15) Li, H., Bristow, A. D., Siemens, M. E., Moody, G. & Cundiff, S. T. Unraveling quantum pathways using optical 3D Fourier-transform spectroscopy. Nat Commun. 4 (2013).
- (16) Milota, F. et al. Vibronic and vibrational coherences in two-dimensional electronic spectra of supramolecular J-aggregates. J. Phys. Chem. A 117, 6007–14 (2013).
- (17) Butkus, V., Zigmantas, D., Valkunas, L. & Abramavicius, D. Vibrational vs. electronic coherences in 2D spectrum of molecular systems. Chem. Phys. Lett. 545, 40–43 (2012).
- (18) Seibt, J., Hansen, T. & Pullerits, T. o. 3D Spectroscopy of Vibrational Coherences in Quantum Dots: Theory. J. Phys. Chem. B 117, 11124–11133 (2013).
- (19) Collini, E. et al. Coherently wired light-harvesting in photosynthetic marine algae at ambient temperature. Nature 463, 644–647 (2010).
- (20) Lee, H., Cheng, Y. & Fleming, G. Coherence dynamics in photosynthesis: protein protection of excitonic coherence. Science 1462 (2007).
- (21) Jonas, D., Lang, M. & Nagasawa, Y. Pump-probe polarization anisotropy study of femtosecond energy transfer within the photosynthetic reaction center of Rhodobacter sphaeroides R26. J. Phys. Chem. 3654, 12660–12673 (1996).
- (22) Ryu, I. S., Dong, H. & Fleming, G. R. Role of electronic-vibrational mixing in enhancing vibrational coherences in the ground electronic States of photosynthetic bacterial reaction center. J. Phys. Chem. B 118, 1381–1388 (2014).
- (23) Jackson, J. et al. Energy Transfer in Rhodobacter Sphaeroides Reaction Centers With the Initial Electron Donor Oxidized or Missing. J. Phys. Chem. B 101, 5747–5754 (1997).
- (24) Cherepy, N. J., Shreve, A. P., Moore, L. J., Boxer, S. G. & Mathies, R. A. Temperature dependence of the Qy resonance Raman spectra of bacteriochlorophylls, the primary electron donor, and bacteriopheophytins in the bacterial photosynthetic reaction center. Biochemistry 36, 8559–8566 (1997).
- (25) Czarnecki, K. et al. Characterization of the strongly coupled, low-frequency vibrational modes of the special pair of photosynthetic reaction centers via isotopic labeling of the cofactors. J. Am. Chem. Soc. 119, 415–426 (1997).
- (26) Christensson, N., Kauffmann, H. F., Pullerits, T. & Mančal, T. Origin of Long-Lived Coherences in Light-Harvesting Complexes. J. Phys. Chem. B 116, 7449–7454 (2012).
- (27) Mančal, T., Dostál, J., Pšenčík, J. & Zigmantas, D. Transfer of vibrational coherence through incoherent energy transfer process in Förster limit. Can. J. Chem. 92, 135–143 (2014).
- (28) The lack of total cancellation is accounted for by the opposite phase sweep across the oscillation peaks in the GSB and ETICS signals (see Supplementary information section 2).
- (29) Tiwari, V., Peters, W. K. & Jonas, D. M. Electronic resonance with anticorrelated pigment vibrations drives photosynthetic energy transfer outside the adiabatic framework. Proc. Natl. Acad. Sci. 110, 1203–1208 (2013).
- (30) Fuller, F. D. et al. Vibronic coherence in oxygenic photosynthesis. Nat. Chem. 6, 706–711 (2014).
- (31) Womick, J. M. & Moran, A. M. Vibronic enhancement of exciton sizes and energy transport in photosynthetic complexes. J. Phys. Chem. B 115, 1347–1356 (2011).
- (32) Chin, a. W. et al. The role of non-equilibrium vibrational structures in electronic coherence and recoherence in pigment–protein complexes. Nat. Phys. 9, 113–118 (2013).
- (33) Perlík, V. et al. Vibronic coupling explains the ultrafast carotenoid-to-bacteriochlorophyll energy transfer in natural and artificial light harvesters. J. Chem. Phys. 142 (2015).
- (34) Ferretti, M. et al. The nature of coherences in the b820 bacteriochlorophyll dimer revealed by two-dimensional electronic spectroscopy. Phys. Chem. Chem. Phys. 16, 9930–9939 (2014).
- (35) Romero, E. et al. Quantum coherence in photosynthesis for efficient solar-energy conversion. Nat. Phys. 10 (2014).
- (36) Schulze, J., Shibl, M. F., Al-Marri, M. J. & Kühn, O. Multi-layer multi-configuration time-dependent hartree (ml-mctdh) approach to the correlated exciton-vibrational dynamics in the fmo complex. J. Chem. Phys. 144 (2016).
- (37) Farhoosh, R., Chynwat, V., Gebhard, R., Lugtenburg, J. & Frank, H. A. Triplet energy transfer between the primary donor and carotenoids in rhodobacter sphaeroides r-26.1 reaction centers incorporated with spheroidene analogs having different extents of -electron conjugation. Photochem. Photobiol. 66, 97–104 (1997).
- (38) Brixner, T., Mančal, T., Stiopkin, I. V. & Fleming, G. R. Phase-stabilized two-dimensional electronic spectroscopy. J. Chem. Phys. 121, 4221–4236 (2004).
- (39) Augulis, R. & Zigmantas, D. Two-dimensional electronic spectroscopy with double modulation lock-in detection: enhancement of sensitivity and noise resistance. Opt. express 19, 13126–13133 (2011).
- (40) Augulis, R. & Zigmantas, D. Detector and dispersive delay calibration issues in broadband 2D electronic spectroscopy. J. Opt. Soc. Am. B 30, 1770–1774 (2013).