11email: carlo.ferrigno@unige.ch 22institutetext: Institut für Astronomie und Astrophysik, Kepler Center for Astro and Particle Physics, Eberhard Karls Universität, Sand 1, 72076 Tübingen, Germany 33institutetext: European Space Astronomy Center (ESA/ESAC), Science Operations Department, Villanueva de la Cañada, 28691 Madrid, Spain 44institutetext: D Karl Remeis-Sternwarte and Erlangen Center for Astroparticle Physics, Sternwartstr. 7, 96049 Bamberg, Germany 55institutetext: CRESST, Department of Physics, and Center for Space Science and Technology, UMBC, Baltimore, MD 21250, USA 66institutetext: NASA Goddard Space Flight Center, Greenbelt, MD 20771, USA 77institutetext: François Arago Center APC - Astroparticule et Cosmologie Université Paris Diderot, CNRS/IN2P3, CEA/Irfu, Observatoire De Paris, Sorbonne Paris Cité Paris, France
Two giant outbursts of V0332+53 observed with INTEGRAL
Abstract
Context. In July 2015, the high-mass X-ray binary V0332+53 underwent a giant outburst, a decade after the previous one. V0332+53 hosts a strongly magnetized neutron star. During the 2004–2005 outburst, an anti-correlation between the centroid energy of its fundamental cyclotron resonance scattering features (CRSFs) and the X-ray luminosity was observed.
Aims. The long ( d) and bright ( erg s-1) 2015 outburst offered the opportunity to study during another outburst the unique properties of the fundamental CRSF and its dependence on the X-ray luminosity.
Methods. The source was observed by the INTEGRAL satellite for ks. We exploit the spectral resolution at high energies of the SPectrometer on INTEGRAL (SPI) and the Joint European X-ray Monitors to characterize its spectral properties, focusing in particular on the CRSF-luminosity dependence. We complement the data of the 2015 outburst with those collected by SPI in 2004–2005 and left unpublished so far.
Results. We find a highly significant anti-correlation of the centroid energy of the fundamental CRSF and the keV luminosity of keV. This trend is observed for both outbursts. We confirm the correlation between the width of the fundamental CRSF and the X-ray luminosity previously found in the JEM-X and IBIS dataset of the 2004–2005 outburst. By exploiting the RXTE/ASM and Swift/BAT monitoring data we also report on the detection of a d modulation superimposed on the mean profiles and roughly consistent with the orbital period of the pulsar. We discuss possible interpretations of such variability.
Key Words.:
X-rays: binaries, pulsars: individual: V0332+531 Introduction
V0332+53 is a transient X-ray pulsar orbiting around a Be star. It spends most of the time in a low luminosity state (), sporadically interrupted either by normal type I outbursts, () associated with the passage of the neutron star (NS) at the periastron, or by giant type II outbursts, which last several orbital periods. During these episodes, V0332+53 becomes one of the most luminous X-ray sources of the Galaxy, achieving X-ray luminosities up to erg s-1. V0332+53 was first detected during a long ( days) giant outburst caught by Vela 5B in 1973, when it reached a peak intensity of 1.4 Crab in keV ( erg cm-2 s-1; Terrell & Priedhorsky 1984). A spin period of 4.37 s and an orbital period of 34 days (eccentricity ) were discovered (Stella et al. 1985; Zhang et al. 2005) during three small outbursts observed by EXOSAT and Tenma (Tanaka 1983). Owing to the precise source localization obtained with EXOSAT, the companion was identified as an O8-9Ve star, BQ Cam (Honeycutt & Schlegel 1985; Negueruela et al. 1999), and its distance estimated to be 2.2–5.8 kpc (Corbet et al. 1986). This value was later increased to 7 kpc (Negueruela et al. 1999). V0332+53 was detected again in X-rays by Ginga in 1989, leading to the discovery of an absorption line feature at 28.5 keV and quasi periodic oscillations at 0.051 Hz (Makishima et al. 1990; Takeshima et al. 1994). A particularly bright giant outburst occurred in 2004 November, and was followed by INTEGRAL and RXTE through dedicated target of opportunity observations (TOOs). The X-ray spectrum could be fitted using a power law with high-energy cut-off, a model which is typically adopted to describe the X-ray emission of accreting pulsars in Be X-ray binary systems. Interestingly, the X-ray spectrum shows three absorption-like features at energies keV, keV and keV (Coburn et al. 2005; Pottschmidt et al. 2005; Kreykenbohm et al. 2005). These are produced by the resonant scattering of photons on electrons in the accretion column of X-ray pulsars and are called cyclotron resonance scattering features (CRSFs; see, e.g., Isenberg et al. 1998; Schönherr et al. 2007 and references therein). If detected, CRSFs provide a direct measurement of the magnetic field of a neutron star through the relation keV, where is the centroid energy of the fundamental CRSF, is the magnetic field strength in units of G, and is the gravitational redshift of the line-forming region. The higher harmonics have a centroid energy approximately -times that of the fundamental line. The equation above can be used to derive a neutron star magnetic field strength of G in V0332+53. An anti-correlation between the centroid energy of the fundamental CRSF and the X-ray luminosity during the outbursts has been reported by several authors using different data sets (Mihara et al. 1998; Mowlavi et al. 2006; Tsygankov et al. 2006, 2010). So far, this is the only X-ray pulsar for which an anti-correlation is firmly established, as the presence of this phenomenon in 4U 011563 is still debated (see Müller et al. 2013, and references therein). For several other systems, a positive correlation between X-ray luminosity and CRSF centroid energy has been reported (Her X-1, Staubert et al. 2007; GX 3041, Klochkov et al. 2012; Vela X-1, Fürst et al. 2013; A 053526, Sartore et al. 2015). The anti-correlation observed in V0332+53 has been interpreted as due to an increase of the height of the accretion column, which induces either the upward migration of the line forming region in a region where the magnetic field weakens (Becker et al. 2012, and references therein), or the progressive illumination of a larger portion of the neutron star surface, where cyclotron scattering is assumed to take place in regions progressively further from the magnetic poles (Poutanen et al. 2013).
In June 2015, V0332+53 underwent a new giant outburst (Nakajima et al. 2015; Doroshenko et al. 2015), anticipated by a brightening in the optical band, probably associated with the donor star disc (Camero-Arranz et al. 2015). During this outburst, INTEGRAL carried out four observations between July 17 and October 9, covering both the rise and the decay of the outburst. In this work, we present the spectral results on the cyclotron line luminosity dependence, obtained using the SPectrometer on Integral (SPI) collected during both the source outbursts in 2004–2005 and 2015. We complemented the analysis using JEM-X and IBIS data collected during the same periods, when possible (see the next section).
The observation and data analysis are described in Sect. 2. In Sect. 3, we present and discuss the results from the spectral analysis. In Sect. 4, we report the identification of a d modulation superimposed on the profiles of the 2004–2005 and 2015 outbursts. Finally, in Sect. 5, we summarize our findings.
2 Observations and data analysis
The European Space Agency’s International Gamma-Ray Astronomy Laboratory (INTEGRAL), launched in October 2002, carries three co-aligned coded mask telescopes sensitive in the X- and gamma-ray bands. We analyze the data from the SPectrometer on Integral (SPI; Vedrenne et al. 2003; Roques et al. 2003), the Joint European X-ray Monitor (JEM-X; Lund et al. 2003), and the Imager on Board the INTEGRAL Satellite (IBIS; Ubertini et al. 2003). The former operates in the 20 keV8 MeV energy range, with a 28 keV energy resolution, the second is made of two independent units, JEM-X1 and JEM-X2, sensitive from 3 keV to 34 keV, with an energy resolution of 10–15%, and the latter operates in the energy range from 15 keV to 600 keV with energy resolution of 6–7%.
For SPI, we performed the analysis using the SPI Data Analysis Interface (spidai) software provided by the SPI team at the IRAP Toulouse111The software is available at http://sigma-2.cesr.fr/integral/spidai and the SPI iterative Removal Of Sources (spiros) task within the Off-line Science Analysis (OSA) 10.2 software provided by the ISDC Data Center for Astrophysics (Skinner & Connell 2003; Courvoisier et al. 2003). The results obtained with the two softwares have been compared and found to be in good agreement. However, owing to a better response characterization below keV, spidai is better suited for the specific case of V0332+53, where a broad CRSF at keV is present. Therefore, only spectra obtained with spidai are considered in the following analysis. Spectra are obtained from a sky model fitting procedure and a background based on empty field observations (see Jourdain & Roques 2009 for a description of the method). V0332+53 was the only bright X-ray source in the field of view, hence the contribution of any other source can be safely neglected in the sky model. Nonetheless, pointings with unusually high background activity were excluded.
We used OSA 10.2 to obtain the JEM-X spectra in the standard 8 energy bins. By inspecting the time-dependent gain parameter file, provided by the instrument team, we discarded the first science windows of the revolutions in the 2015 data, because of the unstable gain evolution after the passage of the spacecraft in the Earth radiation belts. This was not necessary at early times of the mission, when the calibration sources were strong enough to guarantee a reliable energy reconstruction throughout the full satellite revolution. We limited the analysis to the 3–20 keV energy range, for which the JEM-X team ensures a reliable calibration222All the information regarding the software and the standard calibration can be found on the ISDC web-site at http://isdc.unige.ch/. In 2004–2005, only the unit JEM-X1 was active, while in 2015, both units were in data-taking mode.
We reanalyzed the data of the imager IBIS, which appeared already in literature (Mowlavi et al. 2006; Tsygankov et al. 2006) to apply the same model and definition of flux as in the rest of the present paper (see below). For the 2015 data, the current version of the software produces IBIS spectra with significant differences from the SPI ones, preventing their utilization for the present work. This is due to the aging of the instrument, which is not optimally accounted for in the software and calibration files, yet.
We analyzed the public data of the TOO observations of the last two outbursts of V0332+53, corresponding to the INTEGRAL revolutions 272, 273, 274, 278, 284–288, 1565, 1570, 1596 (no data were available for SPI during revolutions 278 and 1586 because the instrument was undergoing an annealing cycle, while in revolution 272 the staring pointing mode prevents spectral extraction with SPI). The observations were performed with hexagonal dithering pattern of the individual 3-ks-long pointings, therefore all of them fell within the INTEGRAL instrument optimal field of view. The log of observations is reported in Table 3. During the spectral fitting, for the JEM-X and IBIS spectra, we considered 1% systematic errors; we ignored SPI and IBIS data below keV because of uncertainties in the energy response (Jourdain & Roques 2009); no systematic uncertainties are added to the SPI spectra. We used XSPEC version 12.9g (Arnaud 1996) for the analysis. Uncertainties are reported at 90% confidence level, unless stated otherwise.
| Rev | Start time [UTC] | Stop time [UTC] | Exposures [ks] | ||
|---|---|---|---|---|---|
| JEM-X | SPI | IBIS | |||
| 272a𝑎aa𝑎aDue to visibility constraints, this observation was performed in “staring” mode, for which it is not possible to extract SPI products. | 2005-01-06 05:43:29 | 2005-01-06 18:13:58 | 15.2 | 20.1 | |
| 273 | 2005-01-08 22:18:05 | 2005-01-09 15:45:43 | 35.4 | 44.7 | 38.0 |
| 274 | 2005-01-10 03:20:24 | 2005-01-10 09:22:09 | 13.9 | 18.7 | 14.4 |
| 278b𝑏bb𝑏bSPI was in its periodic annealing phase and was not taking data. | 2005-01-23 15:19:46 | 2005-01-24 15:58:07 | 62.4 | 35.3 | |
| 284 | 2005-02-09 01:14:58 | 2005-02-10 20:43:54 | 127.6 | 124.2 | 100.6 |
| 285 | 2005-02-12 01:02:19 | 2005-02-12 05:32:38 | 12.5 | 13.8 | 10.2 |
| 286 | 2005-02-15 10:01:35 | 2005-02-15 15:09:16 | 15.0 | 20.6 | 10.2 |
| 287 | 2005-02-18 00:36:32 | 2005-02-18 05:31:14 | 13.7 | 15.0 | 11.0 |
| 288 | 2005-02-21 00:25:08 | 2005-02-21 05:15:44 | 13.5 | 17.7 | 11.0 |
| 1565 | 2015-07-17 05:10:49 | 2015-07-18 03:11:44 | 64.9 | 67.9 | |
| 1570 | 2015-07-30 14:19:15 | 2015-08-01 12:49:39 | 133.8 | 141.2 | |
| 1596 | 2015-10-07 14:13:47 | 2015-10-09 16:53:07 | 145.1 | 120.8 | |
3 Spectral analysis
We have modelled the JEM-X+SPI and JEM-X+IBIS spectra using a power law modified by an high-energy cutoff and Gaussian shaped absorption profiles for the two observable CRSFs. The spectral model is:
| (1) |
where the functions () are the components (gabs model in XSPEC):
| (2) |
JEM-X data, available only above 3 keV do not require to include a photoelectric absorption component in the model.
In revolutions 286 and 287 (decline of the outburst) the CRSF harmonic was not clearly detected in the SPI spectra due to the source faintness and the corresponding low statistics of the data. Therefore, we fixed the centroid energy to 54 keV in these spectra. Since the source flux declines exponentially with energy, we had to fix the width of the harmonic to keV in all the JEM-X plus SPI spectral fits, to obtain meaningful results. Due to a degeneracy between the continuum shape and the presence of an absorption features at 50 keV in low statistic spectra, we fitted the JEM-X+IBIS spectra of revolutions 286, 287, 288 with fixed cutoff energy ( keV) and second harmonic’s width (5 keV). Inter-calibration constants were included to account for residual uncertainties in the absolute flux determination, different exposure times and source variability. We always found values in the expected intervals around unity.
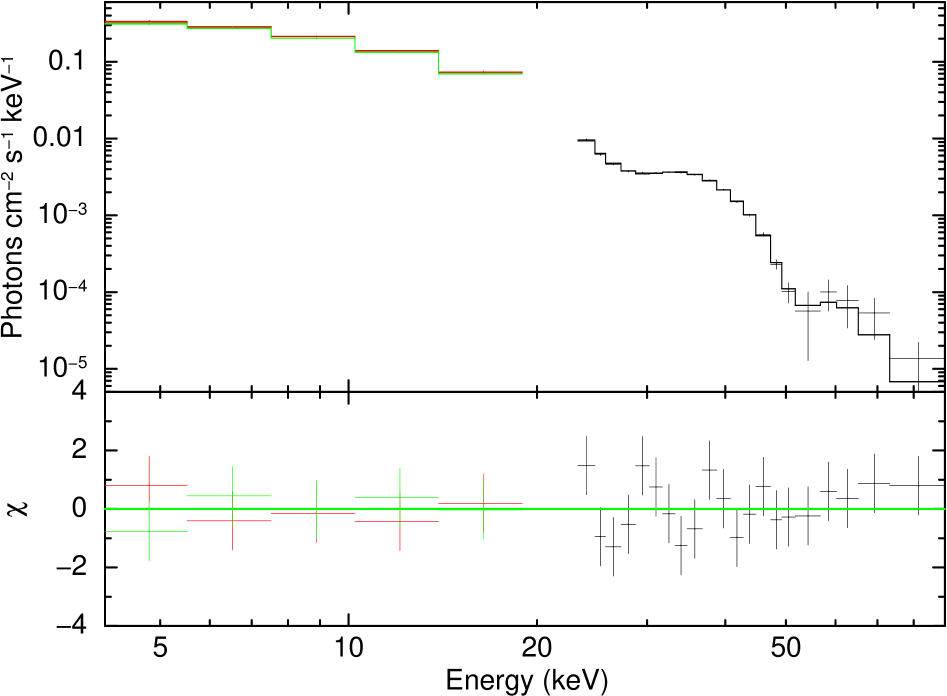
The best fit parameters are reported in Table 2, while an example of the spectrum during revolution 1570 is shown in Fig. 1. The 3–100 keV luminosity has been calculated using the flux derived from the best fit spectral continuum model (unaffected by the absorption-like effect of the CRSFs), assuming a distance of 7 kpc (Negueruela et al. 1999) and isotropic emission. We note that the slope of the power law and the cutoff energy of revolutions 278, 1565, and 1570 are significantly different from the values obtained from the other data sets. In general, there is a strong mathematical degeneracy between these two parameters for our datasets, but we have verified using confidence contour representations that in all cases, the statistical improvement is significant. This is suggestive of a subtle difference in the spectra, which would be anyhow difficult to interpret using phenomenological models. On the other hand, the limited statistics of these datasets prevents us from using more complex, physically motivated models, which have more free parameters. The parameters describing the continuum are consistent with previous results (Mowlavi et al. 2006; Tsygankov et al. 2006; Tsygankov et al. 2010). The centroid energy of the fundamental CRSF decreases by % when the luminosity increases by a factor of 30, while the width of the fundamental CRSF correspondingly increases from keV up to keV. We show these trends in Fig. 2. We fitted as function of and obtained at 68% confidence level for a reduced and 17 degrees of freedom ( erg s-1). Fitting the trend vs. results in at 68% confidence level for a reduced and 17 degrees of freedom. Uncertainties are obtained using a bootstrap technique with 10 000 realizations.
| Rev. | a𝑎aa𝑎aThe width of the first harmonic of the CRSFs is fixed to keV unless indicated otherwise. | (3–100 keV) | (d.o.f.) | ||||||||||||||||||
|---|---|---|---|---|---|---|---|---|---|---|---|---|---|---|---|---|---|---|---|---|---|
| keV | keV | keV | keV | keV | keV | erg s-1 | |||||||||||||||
| 272 Ib𝑏bb𝑏bRows with the label “S” refer to the simultaneous JEM-X and SPI data; rows with the label “I” to the JEM-X and IBIS data. | 1.073 (36) | ||||||||||||||||||||
| 273 Sb𝑏bb𝑏bRows with the label “S” refer to the simultaneous JEM-X and SPI data; rows with the label “I” to the JEM-X and IBIS data. | 0.742 (17) | ||||||||||||||||||||
| 273 I | 0.497 (18) | ||||||||||||||||||||
| 274 S | 1.449 (17) | ||||||||||||||||||||
| 274 I | 1.228 (18) | ||||||||||||||||||||
| 278 I | 0.687 (37) | ||||||||||||||||||||
| 284 S | 1.763 (12) | ||||||||||||||||||||
| 284 I | 1.176 (18) | ||||||||||||||||||||
| 285 S | 1.202 (13) | ||||||||||||||||||||
| 285 I | 1.067 (18) | ||||||||||||||||||||
| 286 S | (fix) | 1.304 (18) | |||||||||||||||||||
| 286 I | 14 | (fix) | 56 | 44 | 1.180 (20) | ||||||||||||||||
| 287 S | (fix) | 1.461 (18) | |||||||||||||||||||
| 287 I | 14 | (fix) | 56 | 30 | 1.389 (20) | ||||||||||||||||
| 288 S | 1.198 (17) | ||||||||||||||||||||
| 288 I | 14 | (fix) | 51 | 15 | 1.358 (13) | ||||||||||||||||
| 1565 S | 1.339 (21) | ||||||||||||||||||||
| 1570 S | 1.166 (20) | ||||||||||||||||||||
| 1596 S | 1.261 (21) | ||||||||||||||||||||
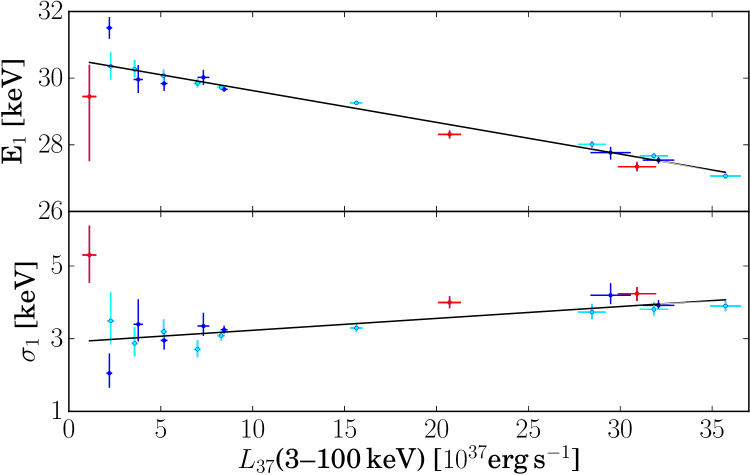
The three new measurements of during the 2015 outburst (red points in Fig. 2) nicely follow the trend of the previous outburst, although they lie below the best-fit linear correlation at a 2 level. Combined with the similarity in the spectral continuum, this confirms also for this source similar accretion properties over different outbursts. This is rather typical of Be/X-ray binary systems, see the cases of 4U 0115+63 (Müller et al. 2013, , and references therein), EXO 2030+375 (Naik et al. 2013; Wilson et al. 2008), XTE J1946+274 (Müller et al. 2012), and GRO J100857 (Kühnel et al. 2013). The anti-correlation of with obtained from the full data set and separately from the 2004–2005 and 2015 data subsets confirms the trend previously reported for this source. Tsygankov et al. (2006) fitted the CRSFs with the cyclotron absorption line model of Mihara et al. (1990); Makishima et al. (1990) (cyclabs in XSPEC). It is known that the centroid energies obtained with this model differ from that obtained with the gabs model (see, e.g., Suchy 2011). Therefore, a comparison between the slope of vs. obtained in this work with that of Tsygankov et al. (2006) cannot be carried out. Cusumano et al. (2016) studied the evolution of the fundamental CRSF during the 2015 outburst of V0332+53 using Swift data. Our measurements of are consistent with those of Cusumano et al. (2016) if the latter are shifted in energy by keV. Such discrepancy is most likely due to calibration systematics between the two instruments.
Moreover, Cusumano et al. (2016) found that the vs. slopes in the rise and decay phases of the outburst are significantly different, causing an increase of keV of the cyclotron energy from the onset to the end of the outburst. This would correspond to a drop of about G of the magnetic field in the photon emitting region. In our dataset, we have only three points, therefore our sensitivity to different trends is limited. By assuming that the point extracted in the satellite revolution 1570 corresponds to the peak of the outburst, we have computed slopes in the ascending and descending branches (revolutions 1565-1570 and 1570-1596, respectively). Both values are compatible with our average value within an uncertainty of 0.03 keV/ (68% confidence level). In Cusumano et al. (2016), the slopes are 0.008 and keV/ for the ascending and descending branches, respectively. Our measurement, dominated by the 2004–2005 data, lies between them, while our determinations based on SPI data of the 2015 outburst are consistent with both values at a 2 level, showing that these data are not sufficient for an independent measurement. The inclusion of IBIS for the 2015 outburst when a refined energy calibration will be available, could possibly allow us to make a better comparison.
We confirm the trend of the absorption line width versus luminosity found by Mowlavi et al. (2006) in the JEM-X and IBIS data collected during the 2004–2005 outburst. This is expected if the emission region broadens with luminosity due to the growth of the accretion column, bringing a larger and larger range of magnetic field intensities into the emission region. However, Tsygankov et al. (2010) do not detect a significant correlation of the absorption line width versus luminosity. By inspecting their Fig. 5, we notice that significant trends could be obtained by isolating some subsets of data; this might suggest that the smaller INTEGRAL sample could be biased. However, by using the Gaussian absorption model on the Swift/BAT data covering both outburst, a positive correlation of line width versus luminosity is unambiguously detected (Cusumano, private communication). We conclude that the use of different spectral models is the most likely cause of this apparent contradiction with Tsygankov et al. (2010).
In the model of Poutanen et al. (2013), an increase of the line width is expected alongside the variation of the centroid energy due to the enlarged region of X-ray reflection (panels a and b of their Fig. 4), while Nishimura (2014) argue that the lines are formed on the column’s side walls in relatively small portions with nearly constant size. He infers that the height on the NS surface is so high in V0332+53 that the effects of bulk motion become weak in focusing emission towards the NS surface, leading to a negligible reflection. This could also explain the general constancy of hard X-ray continuum parameters (Table 2), which are expected to track the temperature and geometrical configuration of the emitting plasma. These should not dramatically vary with luminosity, when the emitting region is far away from the radiation shock. Unfortunately, the details of why these features are so widely variable between sources are largely unknown; they rely on long-sought theoretical developments.
4 Outburst profiles
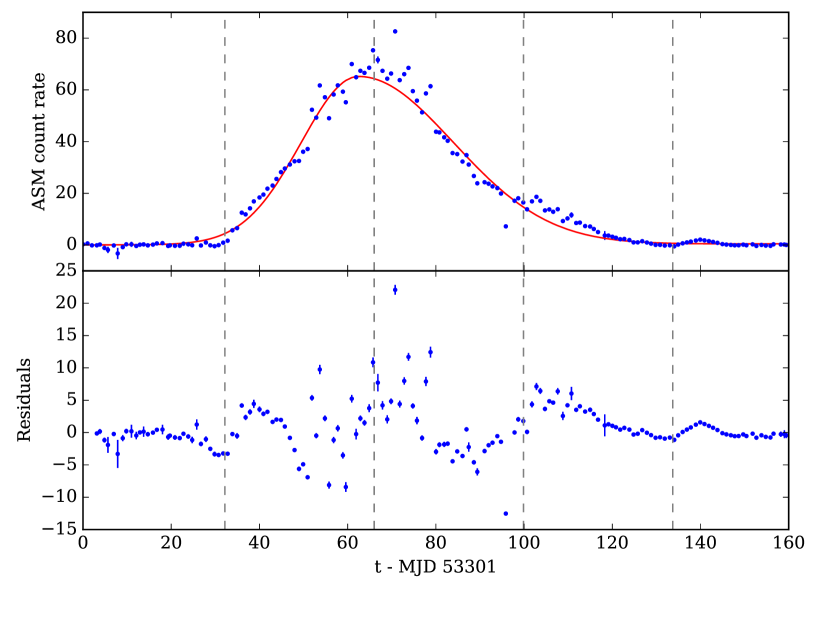
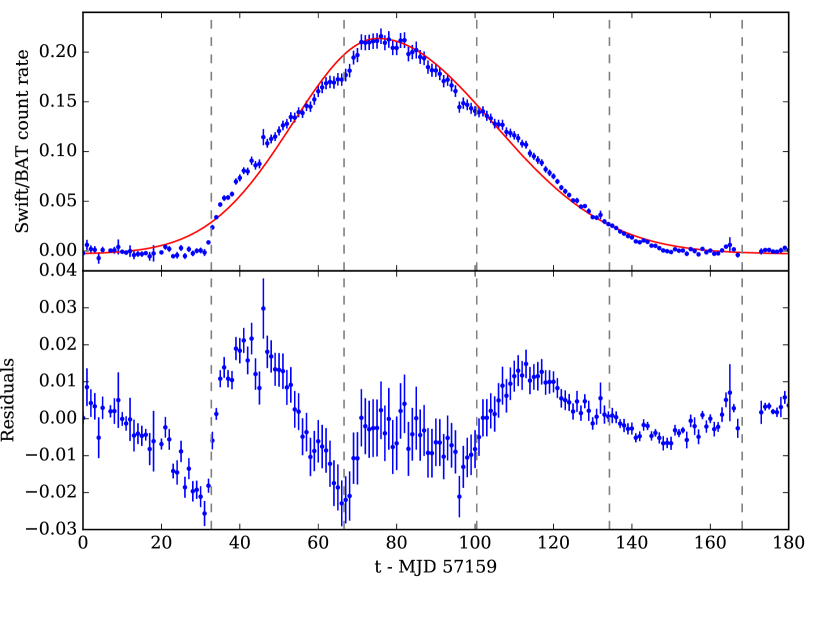
The giant outburst of V0332+53 in 1973 June-September showed a modulation at days, which allowed Whitlock (1989) to refine the measurement of the orbital period reported by Stella et al. (1985). To our knowledge, this is the only report of an orbital modulation superimposed on a giant outburst of a Be/X-ray binary (see Okazaki et al. 2013). Also the Be/XRB SAX J2103.54545 showed a correlation of the X-ray luminosity with the orbital period ( d) during the bright states of 2010 and 2012 (Camero et al. 2014). However, the outbursts of SAX J2103.54545 were fainter ( erg s-1) compared to V0332+53 and their properties are reminiscent of type I outbursts. To explore whether such a behavior is recurrent in V0332+53, we retrieved the daily-averaged lightcurves obtained by the All Sky Monitor (ASM, 210 keV) on board Rossi X-ray Timing Explorer (RXTE) satellite and the Burst Alert Telescope on board Swift (BAT, 1550 keV Krimm et al. 2013)555Provided by the ASM/RXTE (https://heasarc.gsfc.nasa.gov/docs/xte/asm_products.html) and Swift/BAT teams (http://swift.gsfc.nasa.gov/results/transients/index.html).. The profiles of the 2004–2005 and 2015 giant outbursts of V0332+53 are shown in the upper panels of Fig. 3. The 2015 episode lasted 110 days, slightly longer than the 2004–2005 outburst ( days) and both reached an X-ray luminosity of few erg s-1. Both the curves seem to show a modulation of days superimposed on the rising and decaying phases. To highlight such variability, we fitted the outbursts with an asymmetric Gaussian function and a constant (red lines in top panels of Fig. 3; see Kühnel et al. 2015, for details about the asymmetric Gaussian model). Then, we subtracted the fitting functions from the outburst profiles and we plotted the resulting detrended lightcurves (bottom panels of Fig. 3). Dashed vertical lines show the times of periastron passages, obtained from the ephemeris of Doroshenko et al. (2016). We found that during the two outbursts, the sine-like modulation has maxima 10–15 days after the periastron passages. An enhancement of the X-ray luminosity that repeats periodically at intervals of in wind-fed systems with high eccentricity can be explained with the higher accretion rate at the periastron passage of the pulsar, where the circumstellar wind is denser and slower (e.g., Waters et al. 1989; Raguzova & Lipunov 1998). An accretion disk around the NS of V0332+53 is expected to form during giant outbursts as indicated by the strong spin-up of the NS (Doroshenko et al. 2016). The timescale needed for the gravitationally captured material to spiral-in and fall onto the NS is of the order of days, and depends on the dimensions of the disk and its viscosity properties (Shakura & Sunyaev 1973). Waters et al. (1989) pointed out that if this timescale is not too large, the X-ray modulation caused by the accretion rate variability along the eccentric orbit of the neutron star is not completely flattened and could produce a modulation, which is variable on the orbital timescale. Since the accretion disk behaves like a reservoir of matter, the enhanced amount of matter gravitationally captured at periastron is not immediately accreted on the surface of the neutron star, hence a phase shift between the periastron passage and the maximum of the X-ray luminosity as that observed in Fig. 3 is expected. While this qualitative explanation is plausible, more detailed calculations are required for a quantitative estimate, which is outside the scope of the present work.
5 Summary
We have reported results of the spectral properties of V0332+53 during the 2004–2005 and 2015 giant outbursts, based on SPI, JEM-X, and IBIS observations. We showed that the spectral parameters describing the continuum are consistent with previous results. The correlation of the centroid of the fundamental CRSF and the 3100 keV luminosity is keV. The value of the slope lies between the slopes determined by Cusumano et al. (2016) for the ascending and descending phases of the 2015 outburst, while a direct comparison with the results by Tsygankov et al. (2006) is hampered by the different spectral model adopted by these authors. Using SPI data of the 2004–2005 outburst and left unpublished so far together with JEM-X and IBIS data, we confirmed a significant correlation between the absorption line width of the fundamental CRSF and the 3–100 keV luminosity previously found by Mowlavi et al. (2006) in the JEM-X+ISGRI dataset of the same outburst. We found a modulation at days superimposed on the 2004–2005 and 2015 outburst profiles in RXTE ASM and Swift/BAT lightcurves, with maxima shifted of 1015 days after the periastron passage. Such modulation in the lightcurve of a neutron star powered by an accretion disk can be explained with an enhanced amount of matter gravitationally captured at periastron and spiraling inwards (on a timescale that depends on the dimension of the disk and its viscosity properties) until it is accreted on the surface of the neutron star.
Acknowledgements.
CF thanks G. Cusumano for his constructive comments on our manuscript and for discussing Swift/BAT results. LD acknowledges Jean-Pierre Roques, Elisabeth Jourdain, and James Rodi for their precious help on the use of SPIDAI. LD and MK acknowledge support by the Bundesministerium für Wirtschaft und Technologie and the Deutsches Zentrum für Luft und Raumfahrt through the grants FKZ 50 OG 1602 and 50 OR 1207, respectively. This paper is based on data from observations with INTEGRAL, an ESA project with instruments and science data centre funded by ESA member states (especially the PI countries: Denmark, France, Germany, Italy, Spain, and Switzerland), Czech Republic and Poland, and with the participation of Russia and the USA.References
- Arnaud (1996) Arnaud, K. A. 1996, Astronomical Data Analysis Software and Systems V, 101, 17
- Becker et al. (2012) Becker, P. A., Klochkov, D., Schönherr, G., et al. 2012, A&A, 544, 123
- Camero et al. (2014) Camero, A., Zurita, C., Gutiérrez-Soto, J., et al. 2014, A&A, 568, A115
- Camero-Arranz et al. (2015) Camero-Arranz, A., Caballero-Garcia, M., Ozbey-Arabaci, M., & Zurita, C. 2015, ATEL, 7682
- Coburn et al. (2005) Coburn, W., Kretschmar, P., Kreykenbohm, I., et al. 2005, ATEL, 381
- Corbet et al. (1986) Corbet, R. H. D., Charles, P. A., & van der Klis, M. 1986, A&A, 162, 117
- Courvoisier et al. (2003) Courvoisier, T. J.-L., Walter, R., Beckmann, V., et al. 2003, A&A, 411, L53
- Cusumano et al. (2016) Cusumano, G., La Parola, V., D’Ai, A., et al. 2016, A&Ain press [arXiv:1604.07831]
- Doroshenko et al. (2015) Doroshenko, V., Tsygankov, S., Ferrigno, C., et al. 2015, ATEL, 7822
- Doroshenko et al. (2016) Doroshenko, V., Tsygankov, S., & Santangelo, A. 2016, A&A, 589, A72
- Fürst et al. (2013) Fürst, F., Pottschmidt, K., Wilms, J., et al. 2013, ApJ, 780, 133
- Honeycutt & Schlegel (1985) Honeycutt, R. K. & Schlegel, E. M. 1985, PASP, 97, 300
- Isenberg et al. (1998) Isenberg, M., Lamb, D. Q., & Wang, J. C. L. 1998, ApJ, 505, 688
- Jourdain & Roques (2009) Jourdain, E. & Roques, J. P. 2009, ApJ, 704, 17
- Klochkov et al. (2012) Klochkov, D., Doroshenko, V., Santangelo, A., et al. 2012, A&A, 542, L28
- Kreykenbohm et al. (2005) Kreykenbohm, I., Mowlavi, N., Produit, N., et al. 2005, A&A, 433, L45
- Krimm et al. (2013) Krimm, H. A., Holland, S. T., Corbet, R. H. D., et al. 2013, ApJS, 209, 14
- Kühnel et al. (2015) Kühnel, M., Kretschmar, P., Nespoli, E., et al. 2015, in Proceedings of ”A Synergistic View of the High Energy Sky” - 10th INTEGRAL Workshop (INTEGRAL 2014). 15-19 September 2014. Annapolis, MD, USA., 78
- Kühnel et al. (2013) Kühnel, M., Müller, S., Kreykenbohm, I., et al. 2013, A&A, 555, A95
- Lund et al. (2003) Lund, N., Budtz-Jørgensen, C., Westergaard, N. J., et al. 2003, A&A, 411, L231
- Makishima et al. (1990) Makishima, K., Mihara, T., Ishida, M., et al. 1990, ApJ, 365, L59
- Mihara et al. (1998) Mihara, T., Makishima, K., & Nagase, F. 1998, Advances in Space Research, 22, 987
- Mihara et al. (1990) Mihara, T., Makishima, K., Ohashi, T., Sakao, T., & Tashiro, M. 1990, Nature, 346, 250
- Mowlavi et al. (2006) Mowlavi, N., Kreykenbohm, I., Shaw, S. E., et al. 2006, A&A, 451, 187
- Müller et al. (2013) Müller, S., Ferrigno, C., Kühnel, M., et al. 2013, A&A, 551, 6
- Müller et al. (2012) Müller, S., Kühnel, M., Caballero, I., et al. 2012, A&A, 546, A125
- Naik et al. (2013) Naik, S., Maitra, C., Jaisawal, G. K., & Paul, B. 2013, ApJ, 764, 158
- Nakajima et al. (2015) Nakajima, M., Mihara, T., Negoro, H., et al. 2015, ATEL, 7685
- Negueruela et al. (1999) Negueruela, I., Roche, P., Fabregat, J., & Coe, M. J. 1999, MNRAS, 307, 695
- Nishimura (2014) Nishimura, O. 2014, ApJ, 781, 30
- Okazaki et al. (2013) Okazaki, A. T., Hayasaki, K., & Moritani, Y. 2013, PASJ, 65 [arXiv:1211.5225]
- Pottschmidt et al. (2005) Pottschmidt, K., Kreykenbohm, I., Wilms, J., et al. 2005, ApJ, 634, L97
- Poutanen et al. (2013) Poutanen, J., Mushtukov, A. A., Suleimanov, V. F., et al. 2013, ApJ, 777, 115
- Raguzova & Lipunov (1998) Raguzova, N. V. & Lipunov, V. M. 1998, A&A, 340, 85
- Roques et al. (2003) Roques, J. P., Schanne, S., von Kienlin, A., et al. 2003, A&A, 411, L91
- Sartore et al. (2015) Sartore, N., Jourdain, E., & Roques, J. P. 2015, ApJ, 806, 193
- Schönherr et al. (2007) Schönherr, G., Wilms, J., Kretschmar, P., et al. 2007, A&A, 472, 353
- Shakura & Sunyaev (1973) Shakura, N. I. & Sunyaev, R. A. 1973, A&A, 24, 337
- Skinner & Connell (2003) Skinner, G. & Connell, P. 2003, A&A, 411, L123
- Staubert et al. (2007) Staubert, R., Shakura, N. I., Postnov, K., et al. 2007, A&A, 465, L25
- Stella et al. (1985) Stella, L., White, N. E., Davelaar, J., et al. 1985, ApJ, 288, L45
- Suchy (2011) Suchy, S. 2011, PhD thesis, University of California, San Diego
- Takeshima et al. (1994) Takeshima, T., Dotani, T., Mitsuda, K., & Nagase, F. 1994, ApJ, 436, 871
- Tanaka (1983) Tanaka, Y. 1983, IAU Circ., 3891
- Terrell & Priedhorsky (1984) Terrell, J. & Priedhorsky, W. C. 1984, ApJ, 285, L15
- Tsygankov et al. (2006) Tsygankov, S. S., Lutovinov, A. A., Churazov, E. M., & Sunyaev, R. A. 2006, MNRAS, 371, 19
- Tsygankov et al. (2010) Tsygankov, S. S., Lutovinov, A. A., & Serber, A. V. 2010, MNRAS, 401, 1628
- Ubertini et al. (2003) Ubertini, P., Lebrun, F., di Cocco, G., et al. 2003, A&A, 411, L131
- Vedrenne et al. (2003) Vedrenne, G., Roques, J.-P., Schönfelder, V., et al. 2003, A&A, 411, L63
- Waters et al. (1989) Waters, L. B. F. M., de Martino, D., Habets, G. M. H. J., & Taylor, A. R. 1989, A&A, 223, 207
- Whitlock (1989) Whitlock, L. 1989, ApJ, 344, 371
- Wilson et al. (2008) Wilson, C. A., Finger, M. H., & Camero-Arranz, A. 2008, ApJ, 678, 1263
- Zhang et al. (2005) Zhang, S., Qu, J., Song, L., & Torres, D. F. 2005, ApJ, 630, L65