Statistical power and prediction accuracy in multisite resting-state fMRI connectivity
Abstract
Connectivity studies using resting-state functional magnetic resonance imaging are increasingly pooling data acquired at multiple sites. While this may allow investigators to speed up recruitment or increase sample size, multisite studies also potentially introduce systematic biases in connectivity measures across sites. In this work, we measure the inter-site effect in connectivity and its impact on our ability to detect individual and group differences. Our study was based on real, as opposed to simulated, multisite fMRI datasets collected in young, healthy subjects across 8 scanning sites with 3T scanners and heterogeneous scanning protocols, drawn from the 1000 functional connectome project. We first empirically show that typical functional networks were reliably found at the group level in all sites, and that the amplitude of the inter-site effects was small to moderate, with a Cohen’s effect size below 0.5 on average across brain connections. We then implemented a series of Monte-Carlo simulations, based on real data, to evaluate the impact of the multisite effects on detection power in statistical tests comparing two groups (with and without the effect) using a general linear model, as well as on the prediction of group labels with a support-vector machine. As a reference, we also implemented the same simulations with fMRI data collected at a single site using an identical sample size. Simulations revealed that using data from heterogeneous sites only slightly decreased our ability to detect changes compared to a monosite study with the GLM, and had a greater impact on prediction accuracy. However, the deleterious effect of multisite data pooling tended to decrease as the total sample size increased, to a point where differences between monosite and multisite simulations were small with subjects. Taken together, our results support the feasibility of multisite studies in rs-fMRI provided the sample size is large enough.
keywords:
multisite , statistical power , prediction accuracy , Monte-Carlo simulation , sample size , resting-state , fMRI connectivity , SVMHighlights
-
1.
Small to moderate systematic site effects in fMRI connectivity.
-
2.
Small impact of site effects on the detection of group differences for sample size .
-
3.
Linear regression of the sites prior to multivariate prediction do not improve prediction accuracy.
1 Introduction
Main objective
Multisite studies are becoming increasingly common in resting-state functional magnetic resonance imaging (rs-fMRI). In particular, some consortia have retrospectively pooled rs-fMRI data from multiple independent studies comparing clinical cohorts with control groups, e.g. normal controls in the 1000 functional connectome project (FCP) (Biswal et al., 2010), children and adolescents suffering from attention deficit hyperactivity disorder from the ADHD200 (Milham et al., 2012; Fair et al., 2012), individuals diagnosed with autism spectrum disorder in ABIDE (Nielsen et al., 2013), individuals suffering from schizophrenia (Cheng et al., 2015), or elderly subjects suffering from mild cognitive impairment (Tam et al., 2015). The rationale behind such initiatives is to dramatically increase the sample size at the cost of decreased sample homogeneity. The systematic variations of connectivity measures derived using different scanners, called site effects, may decrease the statistical power of group comparisons, and somewhat mitigate the benefits of having a large sample size (Brown et al., 2011; Jovicich et al., 2016). In this work, our main objective was to quantitatively assess the impact of site effects on group comparisons in rs-fMRI connectivity.
Group comparison in rs-fMRI connectivity
In this work, we focused on the most common measure of individual functional connectivity, which is the Pearson’s correlation coefficient between the average rs-fMRI time series of two brain regions. To compare two groups, a general linear model (GLM) is typically used to establish the statistical significance of the difference in average connectivity between the groups. Finally a -value is generated for each connection to quantify the probability that the difference in average connectivity is significantly different from zero (Worsley and Friston, 1995; Yan et al., 2013). If the estimated -value is smaller than a prescribed tolerable level of false-positive findings (see for more detail Table 1), generally adjusted for the number of tests performed across connections, say , then the difference in connectivity is deemed significant.
|
Actual
value |
Detected value | ||
|---|---|---|---|
| patho | no patho | ||
|
patho |
True Positive | False Negative | |
|
no patho |
False
Positive |
True Negative | |
Statistical power in group comparisons at multiple sites
The statistical power of a group comparison study is the probability of finding a significant difference, when there is indeed a true difference. A careful study design involves the selection of a sample size that is large enough to reach a set level of statistical power, e.g. . In the GLM, the statistical power actually depends on a series of parameters (Desmond and Glover, 2002; Durnez et al., 2014): (1) the sample size (the larger the better); (2) the absolute size of the group difference (the larger the better), and, (3) the intrinsic variability of measurements (the smaller the better) (4) the rejection threshold for the null hypothesis.
Sources of variability: factors inherent to the scanning protocol
In a multisite (or multi-protocol) setting, differences in imaging or study parameters may add variance to rs-fMRI measures, e.g. the scanner make and model (Friedman et al., 2006, 2008), repetition time, flip angle, voxel resolution or acquisition volume (Friedman and Glover, 2006), experimental design such as eyes-open/eyes-closed (Yan et al., 2009), experiment duration (Van Dijk et al., 2010), and scanning environment such as sound attenuation measures (Elliott et al., 1999), or head-motion restraint techniques (Edward et al., 2000; Van Dijk et al., 2012), amongst others. These parameters can be harmonized to some extent, but differences are unavoidable in large multisite studies. The recent work of Yan et al. (2013) has indeed demonstrated the presence of significant site effects in rs-fMRI measures in the 1000 FCP. Site effects will increase the variability of measures, and thus decrease statistical power. To the best of our knowledge, it is not yet known how important this decrease in statistical power may be.
Sources of variability: within-subject
The relative importance of site effects in rs-fMRI connectivity depends on the amplitude of the many other sources of variance. First, rs-fMRI connectivity only has moderate-to-good test-retest reliability using standard 10-minute imaging protocols (Shehzad et al., 2009), even when using a single scanner and imaging session. Differences in functional connectivity across subjects are also known to correlate with a myriad of behavioural and demographic subject characteristics (Anand et al., 2007; Sheline et al., 2010; Kilpatrick et al., 2006). Taken together, these sources of variance reflect a fundamental volatility of human physiological signals.
Sources of variability: factors inherent to the site
In addition to physiology, some imaging artefacts will vary systematically from session to session, even at a single site. For example, intensity non-uniformities across the brain depend on the positioning of subjects (Caramanos et al., 2010). Room temperature has also been shown to impact MRI measures (Vanhoutte et al., 2006). Given the good consistency of key findings in resting-state connectivity across sites, such as the organization of distributed brain networks (Biswal et al., 2010), it is reasonable to hypothesize that site effects will be small compared to the combination of physiological and within-site imaging variance.
Multivariate analysis
Another important consideration regarding the impact of site effects on group comparison in rs-fMRI connectivity is the type of method used to identify differences. The concept of statistical power is very well established in the GLM framework, which tests one brain connection at a time (mass univariate testing). However, multivariate methods that combine several or all connectivity values in a single prediction are also widely used and likely affected by the site effects. A popular multivariate technique in rs-fMRI is support-vector machine (SVM) (Cortes and Vapnik, 1995). In this approach, the group sample is split into a training set and a test set. The SVM is trained to predict group labels on the training set, and the accuracy of the prediction is evaluated independently on the test set. The accuracy level of the SVM captures the quality of the prediction of clinical labels from resting-state connectivity, but does not explicitly tell which brain connection is critical for the prediction. The accuracy score can thus be seen as a “separability index” between the individuals of two groups in high dimensional space. Altogether, the objectives and measures of statistical risk for SVM and GLM are quite different. Because SVM has the ability to combine measures across connections, unlike univariate GLM tests, we hypothesized that the GLM and SVM will be impacted differently by site effects. Even though the accuracy is expected to be lower for the multisite than the monosite configuration, it as been shown that the generalizability of a predictive model to unseen sites is greater for models trained on multisite than monosite datasets as shown by Abraham et al. (2016).
Specific objectives
Our first objective was to characterize, using real data, the amplitude of systematic site effects in rs-fMRI connectivity measures across sites, as a function of within-site variance. We based our evaluation on images generated from independent groups at 8 sites equipped with 3T scanners, in a subset () of the 1000 FCP. Our second objective was to evaluate the impact of site effects on the detection power of group differences in rs-fMRI connectivity. To answer this question directly, one would need to scan two different cohorts of participants at least twice, once in a multisite setting and once in a monosite setting. Such an experiment may be too costly to implement for addressing a purely technical objective. As a more feasible alternative, we implemented a series of Monte Carlo simulations, adding synthetic “pathological” effects in the 1000 FCP sample. One interesting feature of the ”1000 FCP” dataset is the presence of one large site of subjects and 7 small sites of subjects per site. We were therefore able to implement realistic scenarios following either a monosite or a multisite design (with 7 sites), with the same total sample size. Our simulations gave us full control on critical aspects for the detection of group differences, such as the amplitude of the group difference, sample size, and the balancing of groups across sites. We evaluated the ability of detecting group differences both in terms of sensitivity for a GLM and in terms of accuracy for a SVM model.
2 Method
2.1 Imaging sample characteristics
The full 1000 FCP sample includes 1082 subjects, with images acquired over 33 sites spread across North America, Europe, Australia and China. As the 1000 FCP is a retrospective study, no effort was made to harmonize population characteristics or imaging acquisition parameters (Biswal et al., 2010). A subset of sites was selected based on the following criteria: (1) 3T scanner field strength, (2) full brain coverage for the rs-fMRI scan, and, (3) a minimum of 15 young or middle aged adult participants, with a mixture of males and females (4) samples drawn from a population with a predominant Caucasian ethnicity. In addition, only young and middle aged participants (18-46 years old) were included in the study, and we further excluded subjects with excessive motion (see next Section). The final sample for our study thus included 345 cognitively normal young adults (150 males, age range: 18-46 years, meanstd: 23.8 5.14) with images acquired across 8 sites located in Germany, the United Kingdom, Australia and the United States of America. The total time of available rs-fMRI data for these subjects ranged between 6 and 7.5 min and only one run was available per subject. See Table 2 for more details on the demographics and imaging parameters at each site selected in the study. The experimental protocols for all datasets as well as data sharing in the 1000 FCP were approved by the respective ethics committees of each site. This secondary analysis of the 1000 FCP sample was approved by the local ethics committee at CRIUGM, University of Montreal, QC, Canada.
| Site | Magnet | Scanner | Channels | N | Nfinal | Sex | Age | TR | #Slices | #Frames |
|---|---|---|---|---|---|---|---|---|---|---|
| Baltimore, USA | 3T | Philips Achieva | 8 | 23 | 21 | 8M/15F | 20-40 | 2.5 | 47 | 123 |
| Berlin, DE | 3T | Siemens Tim Trio | 12 | 26 | 26 | 13M/13F | 23-44 | 2.3 | 34 | 195 |
| Cambridge, USA | 3T | Siemens Tim Trio | 12 | 198 | 195 | 75M/123F | 18-30 | 3 | 47 | 119 |
| Newark, USA | 3T | Siemens Allegra | 12 | 19 | 17 | 9M/10F | 21-39 | 2 | 32 | 135 |
| NewYork_b, USA | 3T | Siemens Allegra | 1 | 20 | 18 | 8M/12F | 18-46 | 2 | 33 | 175 |
| Oxford, UK | 3T | Siemens Tim Trio | 12 | 22 | 20 | 12M/10F | 20-35 | 2 | 34 | 175 |
| Queensland, AU | 3T | Bruker | 1 | 19 | 17 | 11M/8F | 20-34 | 2.1 | 36 | 190 |
| SaintLouis, USA | 3T | Siemens Tim Trio | 12 | 31 | 31 | 14M/17F | 21-29 | 2.5 | 32 | 127 |
2.2 Computational environment
All experiments were performed using the NeuroImaging Analysis Kit, NIAK111http://simexp.github.io/niak/ (Bellec et al., 2011) version 0.12.18, under CentOS version 6.3 with Octave222http://gnu.octave.org/ version 3.8.1 and the Minc toolkit333http://www.bic.mni.mcgill.ca/ServicesSoftware/ServicesSoftwareMincToolKit version 0.3.18. Analyses were executed in parallel on the ”Mammouth” supercomputer444http://www.calculquebec.ca/index.php/en/resources/compute-servers/mammouth-serie-ii , using the pipeline system for Octave and Matlab, PSOM (Bellec et al., 2012) version 1.0.2. The scripts used for processing can be found on Github555https://github.com/SIMEXP/Projects/tree/master/multisite. Prediction was performed using the LibSVM library (Chang and Lin, 2011). Visualization was implemented using Python 2.7.9 from the Anaconda 2.2.0666http://docs.continuum.io/anaconda/index distribution, along with Matplotlib777http://matplotlib.org/ (Hunter, 2007), Seaborn888http://stanford.edu/~mwaskom/software/seaborn/index.html and Nilearn999http://nilearn.github.io/ for brain map visualizations.
2.3 Preprocessing
Each fMRI dataset was corrected for slice timing; a rigid-body motion was then estimated for each time frame, both within and between runs, as well as between one fMRI run and the T1 scan for each subject (Collins et al., 1994). The T1 scan was itself non-linearly co-registered to the Montreal Neurological Institute (MNI) ICBM152 stereotaxic symmetric template (Fonov et al., 2011), using the CIVET pipeline (Ad-Dab’bagh et al., 2006). The rigid-body, fMRI-to-T1 and T1-to-stereotaxic transformations were all combined to re-sample the fMRI in MNI space at a 3 mm isotropic resolution. To minimize artifacts due to excessive motion, all time frames showing a frame displacement, as defined in Power et al. (2012), greater than 0.5 mm were removed and a residual motion estimated after scrubbing. A minimum of 50 unscrubbed volumes per run was required for further analysis (13 subjects were rejected). The following nuisance covariates were regressed out from fMRI time series: slow time drifts (basis of discrete cosines with a 0.01 Hz highpass cut-off), average signals in conservative masks of the white matter and the lateral ventricles (average Pearson correlation across all subjects is 0.242 between gray matter and white matter signals, and 0.031 between gray matter and ventricles signals) as well as the first principal components (accounting for 95% variance) of the six rigid-body motion parameters and their squares (Giove et al., 2009; Lund et al., 2006). The fMRI volumes were finally spatially smoothed with a 6 mm isotropic Gaussian blurring kernel. A more detailed description of the pipeline can be found on the NIAK website101010http://niak.simexp-lab.org/pipe_preprocessing.html and Github111111https://github.com/SIMEXP/.
2.4 Inter-site bias in resting-state connectivity
Functional connectomes
We compared the functional connectivity measures derived from different sites of the 1000 FCP. A functional brain parcellation with regions was first generated using a bootstrap analysis of stable clusters (Bellec et al., 2010b), on the Cambridge cohort of the 1000 FCP (), as described in Orban et al. (2015). For a given pair of regions, the connectivity measure was defined by the Fisher transformation of the Pearson’s correlation coefficient between the average temporal rs-fMRI fluctuations of the two regions. For each subject, a functional connectome matrix was thus generated, featuring the connections for every possible pair of brain regions.
Inter-site effects
The inter-site effects at a particular connection were defined as the absolute difference in average connectivity between two sites. In order to formally test the significance of the inter-site effects, we used a GLM including age, sex and residual motion as covariates (corrected to have a zero mean across subjects), as well as dummy variables coding for the average connectivity at each site. For each site, a “contrast” vector was coded to measure the difference in average connectivity between this site and the grand average of functional connectivity combining all other sites. A -value was generated for each connection to quantify the probability that the observed effect using this contrast was significantly different from zero (Worsley and Friston, 1995). The number of false discovery was also controlled () using a Benjamini-Hochberg false discovery rate (FDR) procedure (Benjamini and Hochberg, 1995). To quantify the severity of inter-site effects, we derived Cohen’s effect size measure for each connection: , with being the weight associated with the contrast. The standard deviation from the noise was calculated as , being the residuals from the GLM, the sample size and the number of covariates in the model. As secondary analyses, -tests were also implemented in the GLM to validate that age, sex as well as residual motion made significant contributions to the model.
2.5 Simulations
Data generation process
We implemented Monte-Carlo simulations to assess the detection sensitivity of group differences in rs-fMRI connectivity. The simulations were based on the 1000 FCP sample, with 8 sites totaling subjects. The multisite simulations were sampled from subjects, available across sites. The monosite simulations were sampled from subjects available at site (Cambridge). For each simulation, a subset of subjects of a given size was selected randomly and stratified by site. For each site, a ratio of the selected subjects was randomly assigned to a so-called “patient” group. We focus our analysis on connections showing a fair-to-good test-retest reliability based on a previous study reporting 11 connections likely impacted by Alzheimer’s disease, see Orban et al. (2015) for details. For each connection, a “pathology” effect was added to the connectivity measures of the subjects belonging to the “patient” group. This additive shift in connectivity for “patients” was selected as to achieve a specified effect size, defined below.
Effect size (Cohen’s )
The Cohen’s was used to quantify the effect size. For a group comparison, Cohen’s is defined as the difference between the means of the two groups, divided by the standard deviation of the measures within each group, here assumed to be equal. For a given connection between brain regions and , let be the functional connectivity measure for a particular subject of the 1000 FCP sample. If the subject was assigned to the “patient” group in a particular simulation, an effect was added to generate a simulated connectivity measure equal to . For a specified effect size , the parameter was set to , where is the standard deviation of connectivity between region and . The parameter was estimated as the standard deviation of connectivity measures across subjects in the mono-site sample (Cambridge), without any “pathological” effect simulated.
GLM tests
In order to detect changes between the simulated groups at each connection, a GLM was estimated from the simulated data, using age, sex and frame displacement as confounds (corrected to have a zero mean across subjects). To account for site-specific effects, dummy variables (binary vectors coding for each site) were added to the model, with being the total number of sites used in the study, in addition to an intercept accounting for the global average. Finally, one dummy variable coded for the “patient” group. The regression coefficients of the linear model were estimated with ordinary least squares, and a -test, with associated -value, was calculated for the coefficient of the “patient” variable. A significant pathology effect was detected if the value was smaller than a prescribed level. The level needs to be adjusted for multiple comparisons (in our case 11 connections, but this would depend on the number of connections selected in a particular study), which can be done in an adaptive manner using FDR. When connections are pre-specified, such as in e.g. Wang et al. (2012), a more liberal threshold can be applied. In our case, since we wanted to have a constant behavior independent of the effect size, we tested different typical values for in . For each simulation sample and each connection, we derived a -value , and the effect was deemed detected if was less than . The sensitivity of the test for a particular connection was evaluated by the frequency of positive detections over all simulation samples.
Prediction accuracy
In addition to mass univariate GLM tests, we also investigated a linear SVM (Cortes and Vapnik, 1995) using a Monte-Carlo simulation of the prediction of clinical labels based on cross-validation. For SVM simulations, all possible connections between the 100 brain regions were used simultaneously to predict the presence of the simulated pathology in a given subject. For a participant assigned to the “patient” group, a “pathology” effect was only simulated in a set percentage of connections, which were randomly selected. The proportion of connections with a non-null effect was denoted as . For a given simulation at sample size , the SVM model was trained on subjects selected randomly and stratified by site. The accuracy of the model was evaluated on a separate sample consisting of the remaining subjects, unused during training. For example, for a multisite simulation with subjects for training, the model accuracy was tested on the remaining subjects: (available subjects) minus (subjects in the training set). During training, a 10-fold cross-validation was used to optimize the hyper-parameters of the SVM independently for each simulation. The mean and standard deviation of accuracy scores across all samples were derived for each simulation scenario.
Simulation experiments
All the simulation parameters have been summarized below:
-
1.
Sample size .
-
2.
Patient allocation ratio .
-
3.
Number of sites .
-
4.
The type of detection method, either GLM or SVM.
-
5.
For GLM tests, the false-positive rate .
-
6.
For SVM tests, the proportion of “pathological” connections .
-
7.
The effect size .
For a given set of simulation parameters, we generated Monte-Carlo samples to estimate either the sensitivity (for GLM test) or the accuracy (for SVM prediction) of the method. For all experiments, we investigated effect sizes with a step of and . The number of site(s) was for the monosite analysis and for the multisite analysis. We implemented the following experiments:
-
1.
Test the impact of the sample size on GLM , with a fixed allocation ratio .
-
2.
Test the impact of the allocation ratio on GLM for a fixed sample size .
-
3.
Test the impact of multisite correction (regressing out the site effects using dummy variables coding for each site) and affected connection volume () on the prediction accuracy. For the prediction scenario, we used a range of , and two sample sizes subjects for training, with model accuracy estimated on and , respectively.
3 Results
3.1 Inter-site effects in fMRI connectivity
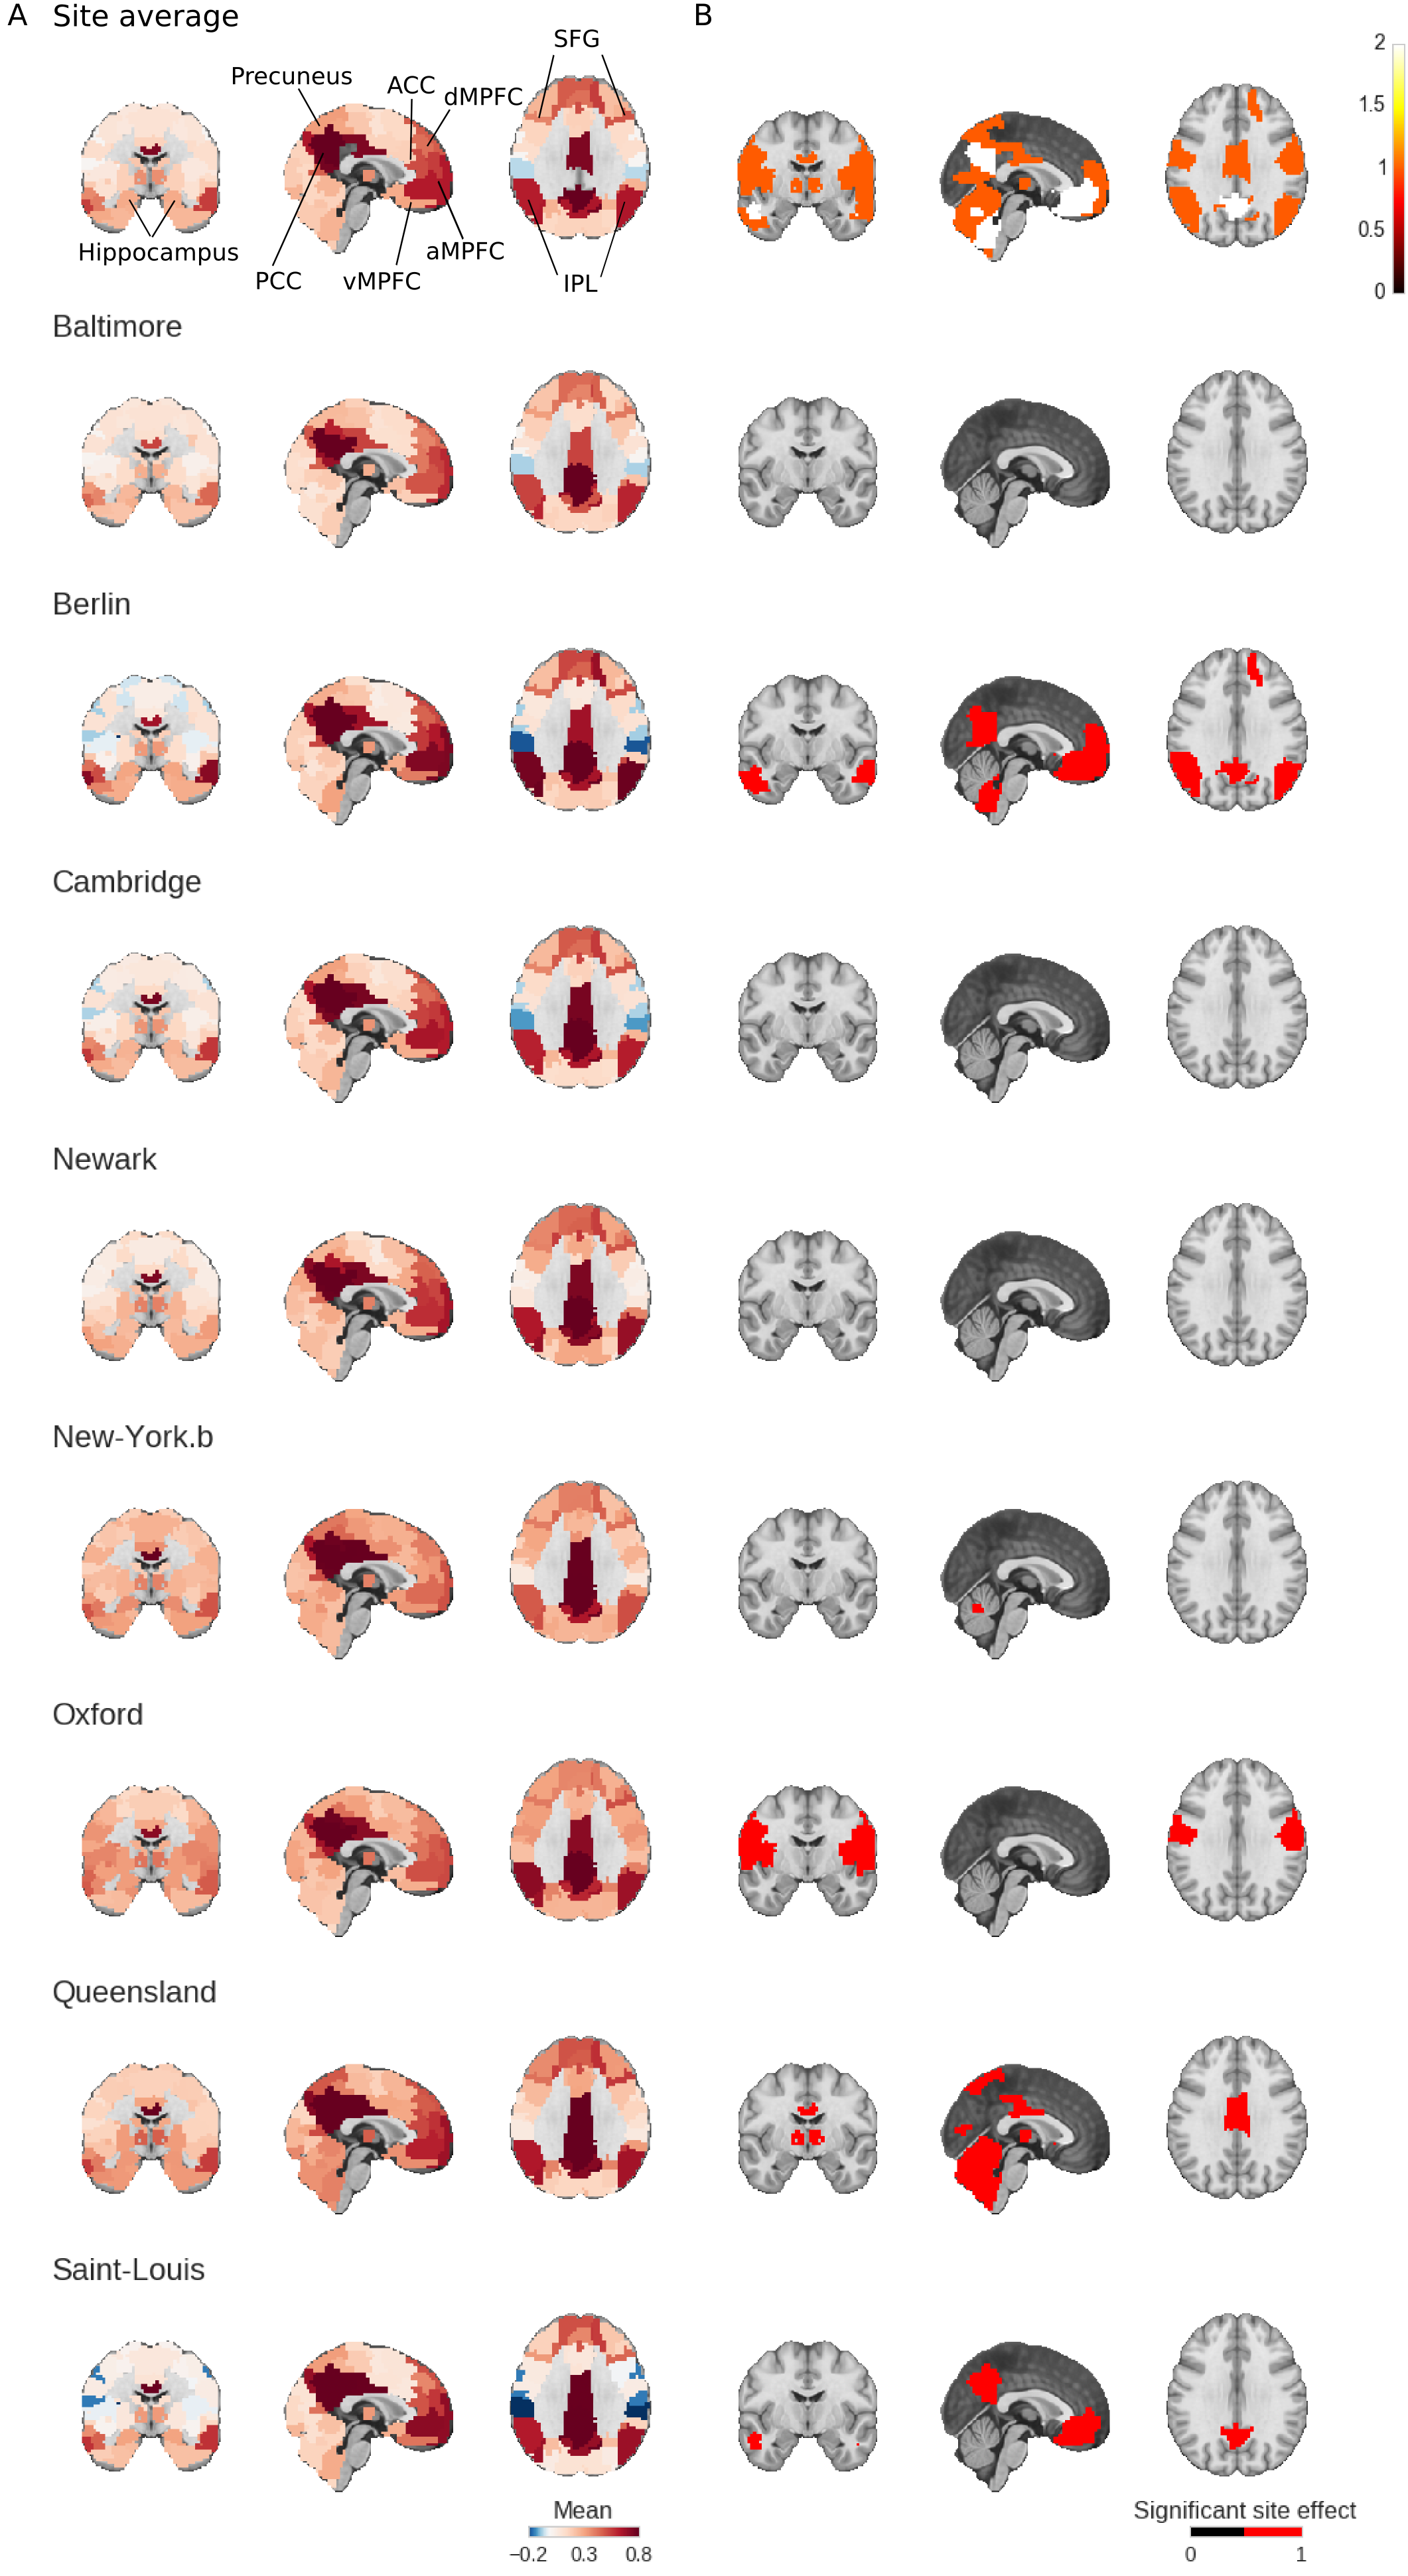
Site effects in the default-mode network
We first focused on the connections associated with a seed region located in the posterior cingulate cortex, a key node of the default-mode network (DMN), which is one of the most widely studied resting-state networks (Greicius et al., 2004). The connections were based on the Cambridge parcellation, and were represented as a connectivity map, (Figure 1). Figure 1A shows the posterior cingulate cortex connectivity map, averaged across all subjects and all sites. The key regions of the DMN are easily identifiable, and include the posterior cingulate cortex, precuneus, inferior parietal lobule, anterior cingulate cortex, medial pre-frontal cortex (dorsal, anterior and ventral), superior frontal gyri and the medial temporal lobe (Damoiseaux et al., 2006; Dansereau et al., 2014; Yan et al., 2013). The average connectivity map of the DMN was then extracted for each site, Figure 1A. Qualitatively, the DMN maps were consistent across sites, as expected based on the literature. We then tested for the significance of the site effects (Figure 1B), i.e. the difference in average connectivity at a given site and the average connectivity at all remaining sites. The statistical maps were corrected for multiple comparisons across the brain with FDR at (Benjamini and Hochberg, 1995). A significant site effect for at least one connection could be identified for every site, without exception, Figure 1B. Figure 1C shows how reproducible the significant site effects were in connectivity across the brain and sites. The identified significant connections were quite variable across sites, most of them being identified at less than three sites.
Site effects across the connectome
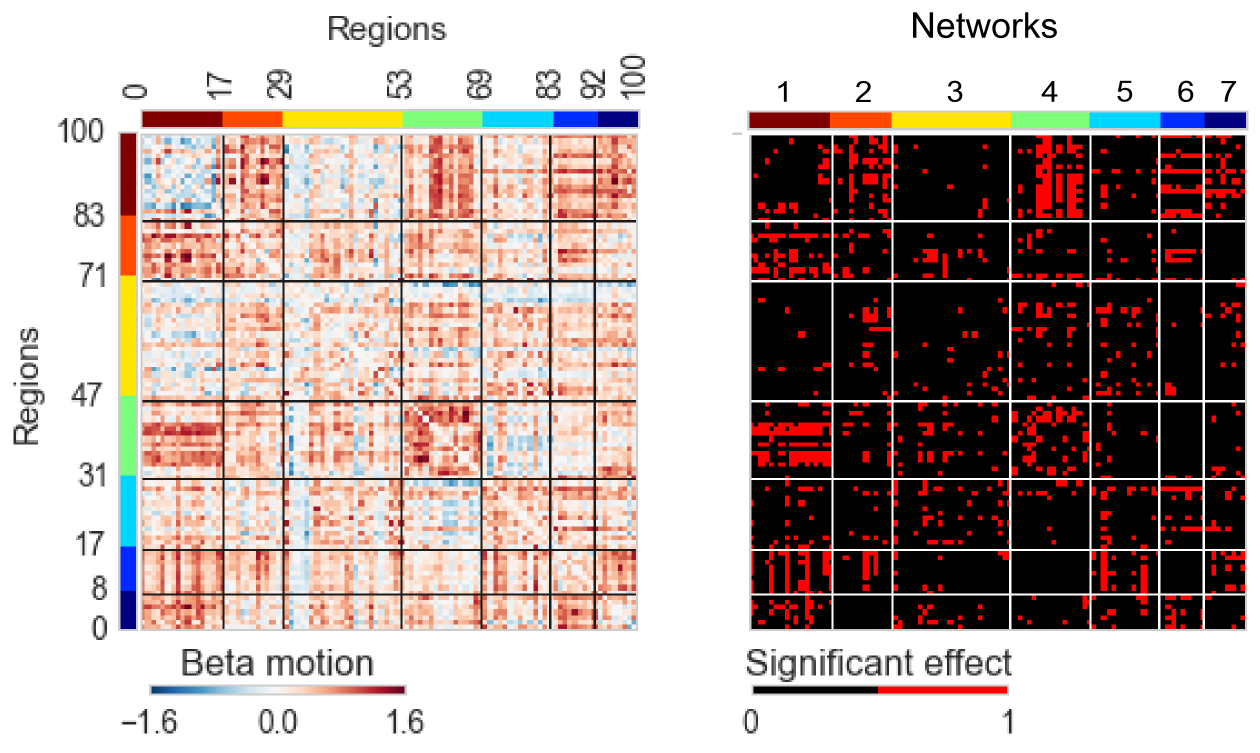
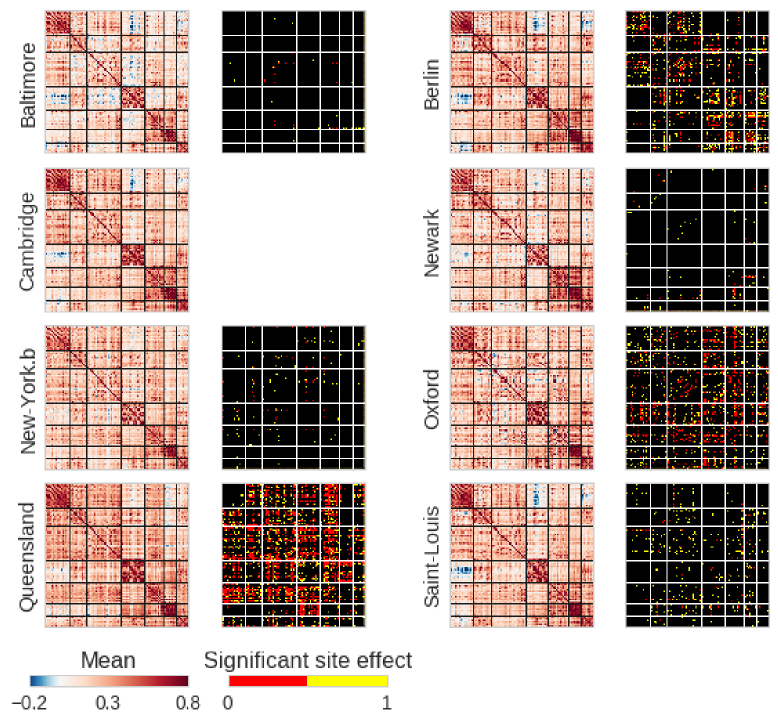
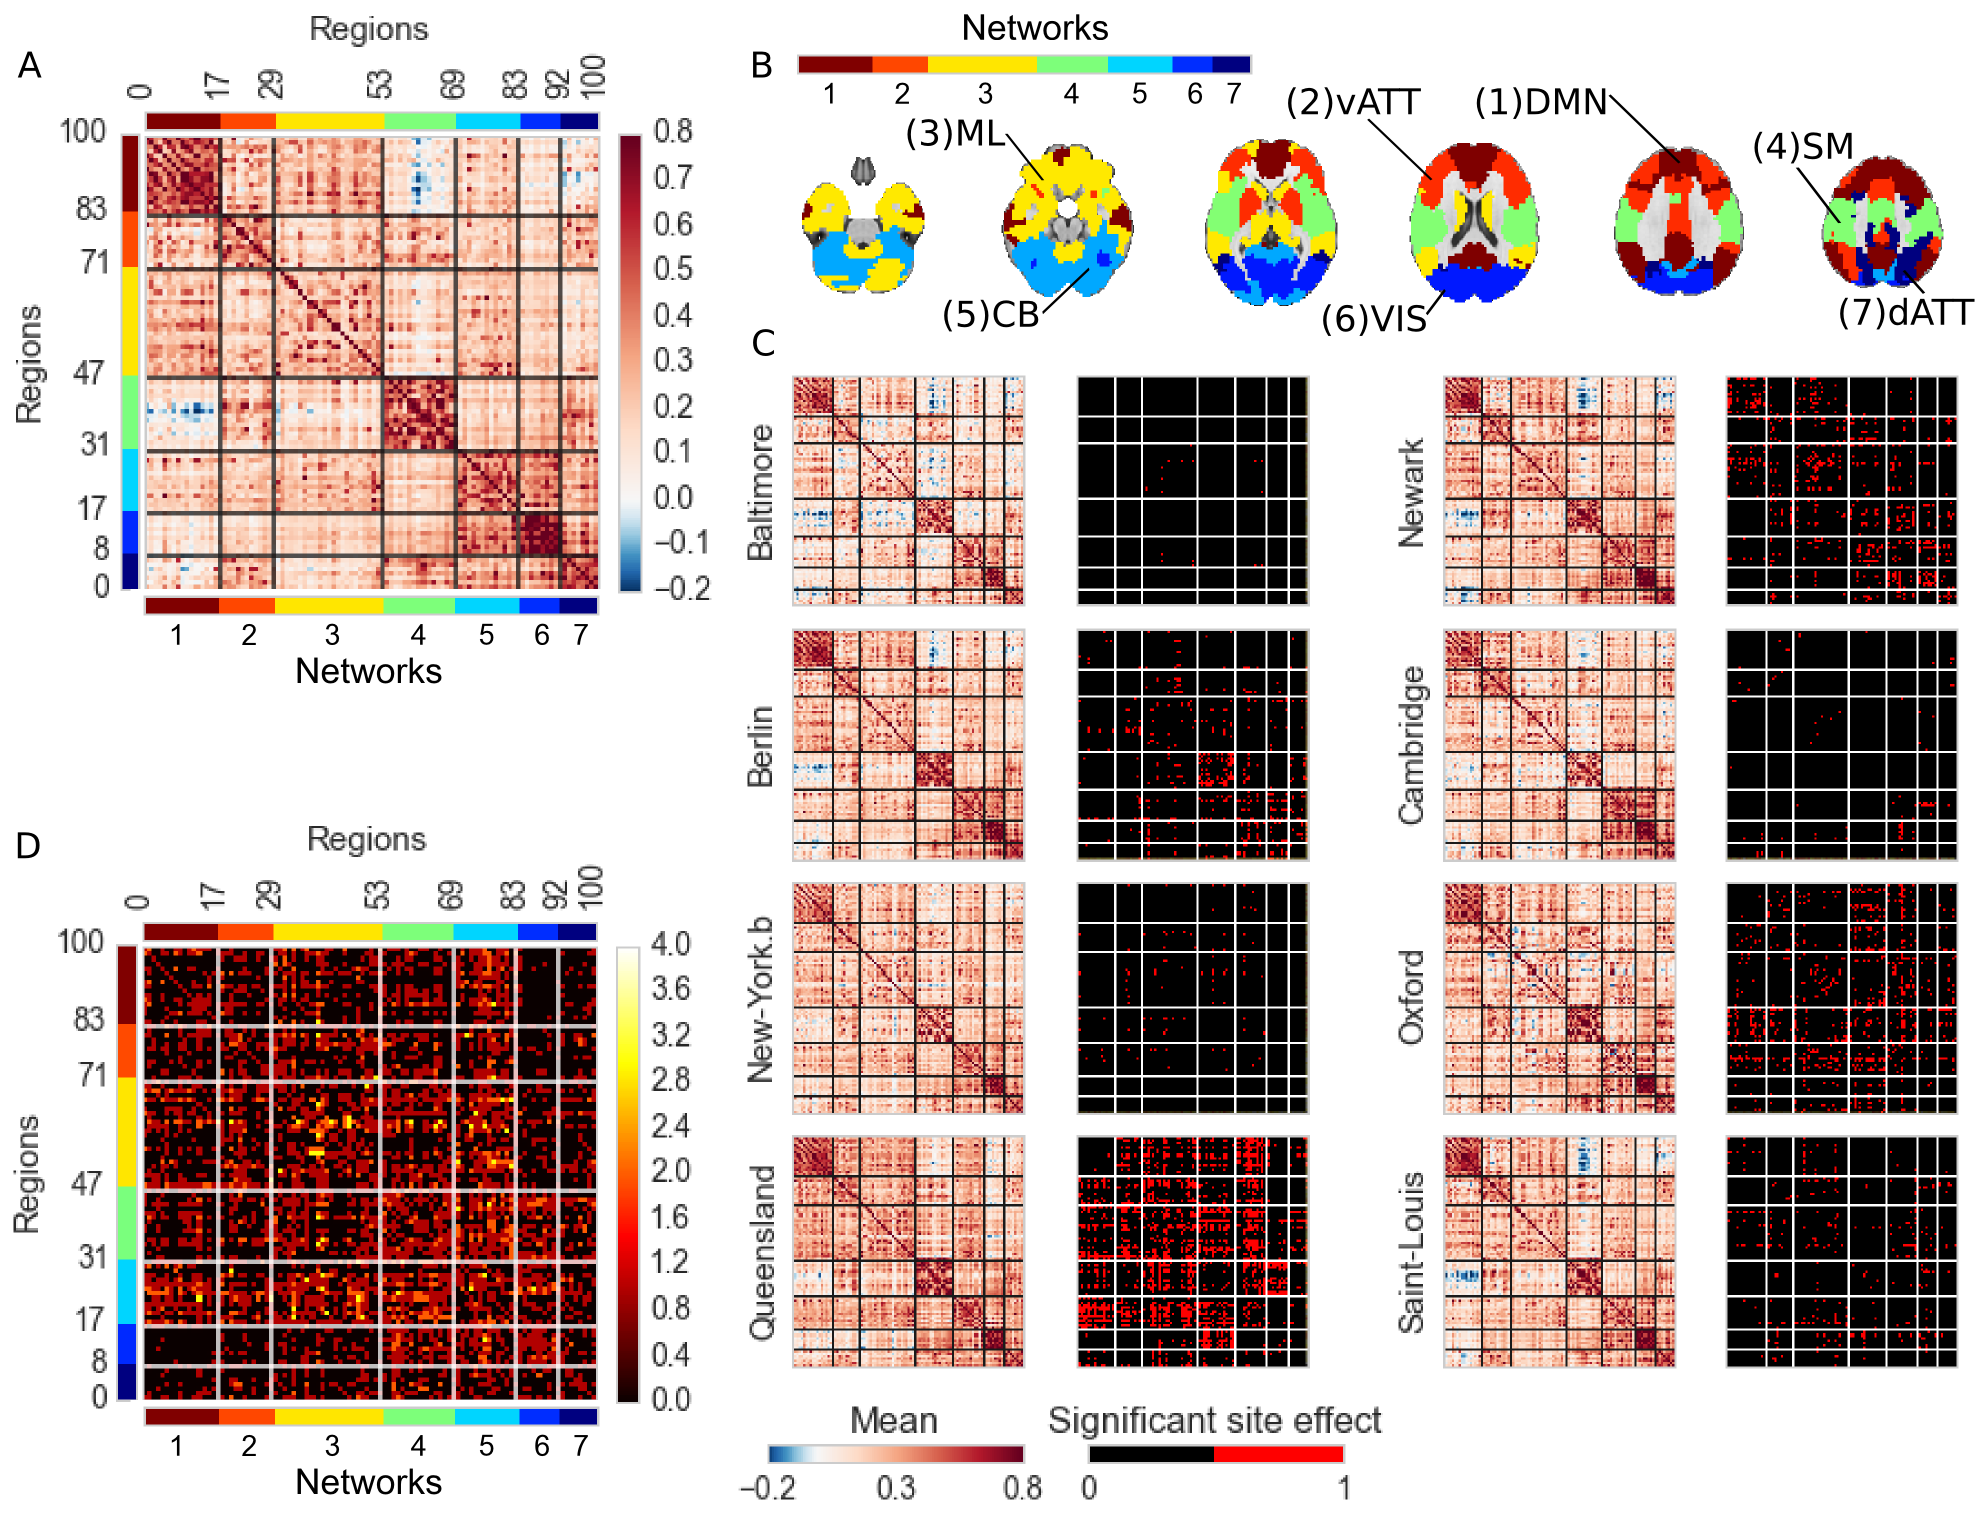
In order to extend these observations outside of the DMN, we derived the entire connectome using the Cambridge 100 parcellation. Figure 2A shows the average connectome, pooling all subjects and sites together. The regions have been re-ordered based on a hierarchical clustering with Ward criterion. A network structure is clearly visible as squares of high connectivity on the diagonal of the connectome (as outlined by black lines). Each diagonal square corresponds to the intra-network connectivity for a partition into 7 networks (Figure 2A). These 7 networks121212http://neurovault.org/images/39184/ were consistent with the major resting-state networks reported using a cluster analysis in previous works (e.g. van den Heuvel et al., 2008; Bellec et al., 2010a; Yeo et al., 2011; Power et al., 2011): the DMN, visual, sensorimotor, dorsal and ventral attentional networks, mesolimbic and cerebellar networks were identified (Figure 2B). Figure 2C shows how this large-scale connectome organization varied from site to site. The average connectivity per site as well as significant differences with the average of the remaining sites () is shown in Figure 2C. Visually, consistent with our previous observations in the DMN, the organization of the average connectome into large-scale resting-state networks was preserved across all sites.
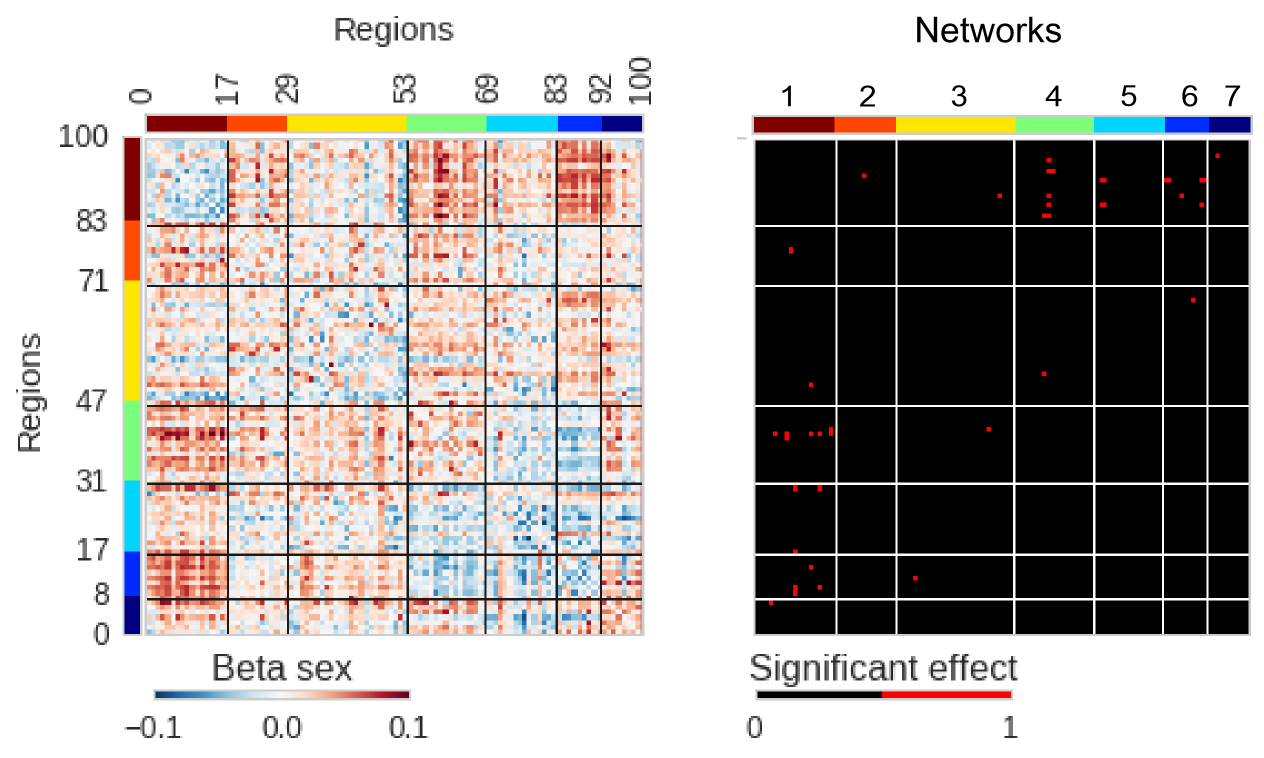
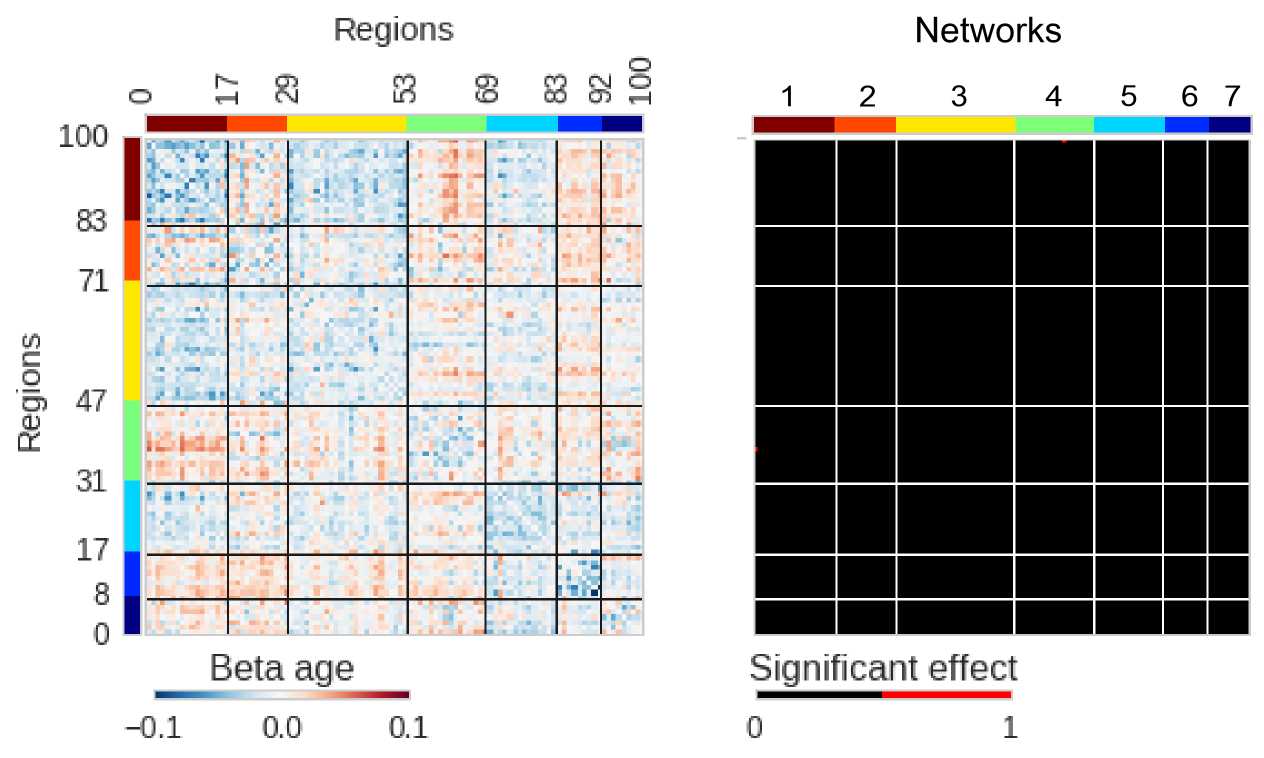
Some significant site effects were still detected in the connectivity both within each network, as well as between networks. By counting the number of sites showing a significant effect for each pair of regions, it was apparent that significant site effects were quite variable in their localization and spread across the full connectome (Figure 2D). Concerning the association with the other confounding variables in the model (sex, age and motion) many connections were found to be significantly associated with motion, see Supplementary Material Figure S5, although very few connections were found to be significantly associated with the sex and age, see Supplementary Material Figure S6 and S7. We also checked that the analysis was not predominantly driven by the larger Cambridge site. We thus ran the same analysis excluding that site (see Supplementary Material Figure S8). The number of significant pairs remained very similar, although the spatial location of half of the significant connectivity pairs changed when the large Cambridge site was removed from the analysis. Those findings do not qualitatively change our conclusion, but they influence the location of the significant connections. These differences may be due to the intrinsic variability in the statistical test, and not just the size of the Cambridge site. In summary, those findings support the inclusion of age, sex and motion parameters in a GLM in order to remove their confounding effects in addition to site effects.
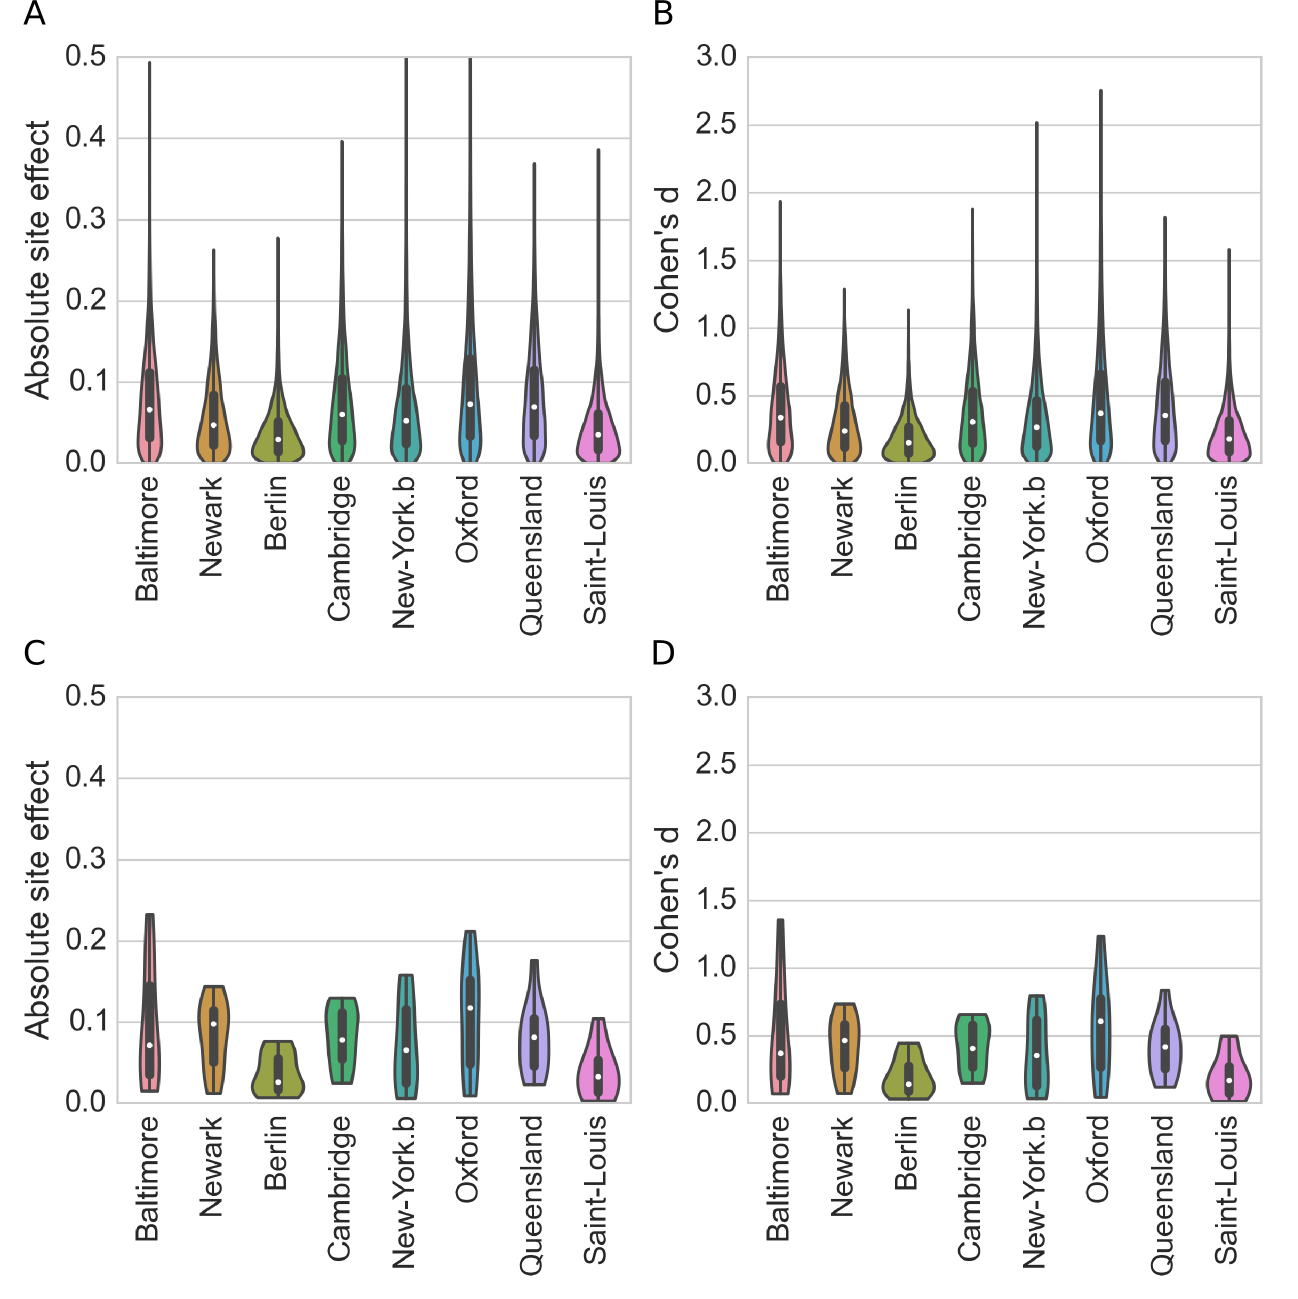
Site effects vs. within-site variations across subjects
We measured the amplitude of inter-site effects, represented as violin plots across connections using either the absolute difference in average connectivity (Figure 3A,C) or Cohen’s effect size measures (Figure 3B,D). The violin plots include either every connection from the BASC Cambridge parcellation (Figure 3A,B), or only the 11 connections selected for Monte-Carlo simulations (Figure 3C,D). For absolute differences, the distributions were mostly consistent across sites, with a median around 0.06, percentile near 0 and percentiles in the 0.08- 0.1 range. For Cohen’s , the distributions were also consistent across sites, with a median around 0.33, percentile near 0 and percentiles in the 0.4- 0.6 range. These effect sizes are typically deemed small-to-moderate (Cohen, 1992), although such a qualitative assessment needs to be refined based on each application. This result thus suggests that the impact of additive inter-site effects on statistical tests will be limited. Similar findings were observed across all possible connections, or across the 11 pairs of connections selected in the simulation study.
Differences in standard deviation across sites
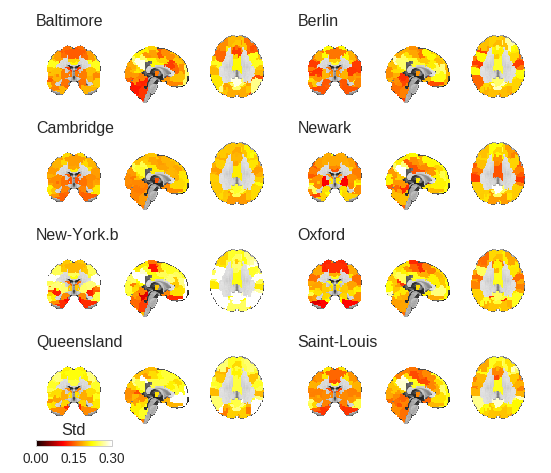
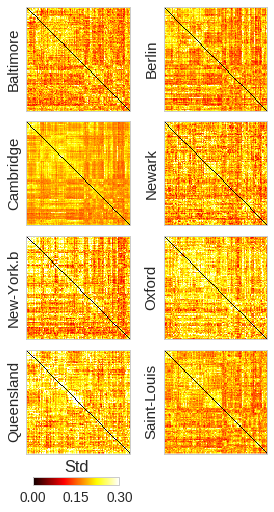
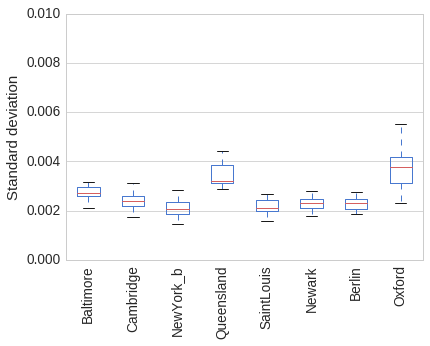
We also investigated the site differences in standard deviation of connectivity across subjects, see Supplementary Figure S1 for the DMN, Supplementary Material S2 for the connectomes. The standard group GLM assumes equal variance of resting-state connectivity across all subjects, or “homoscedasticity”. Significant differences in across-subject standard deviation between sites violates the homoscedastic assumption, and may jeopardize the validity of the false-positive rates of the model. Qualitatively, we first observed that the sites showing the larger number of differences were the one with the most temporal variance among connections see Supplementary Figure S3. We then ran a White’s test aimed at rejecting homoscedasticity at each connection, independently. The White’s tests resulted in a family of p-values, which was corrected for multiple comparisons using FDR (). The homoscedastic hypothesis was rejected in a large portion of connections. This was expected due to the large overall number of subjects and consequently large statistical power of White’s procedure. However, despite reaching significance, the absolute difference in the average standard deviation between two sites was 19% of the grand average standard deviation, on average across pairs of sites. Such a small departure from homoscedasticity likely has only a mild impact on the GLM, which we formally investigated using Monte-Carlo simulations.
3.2 Multisite Monte-Carlo simulations
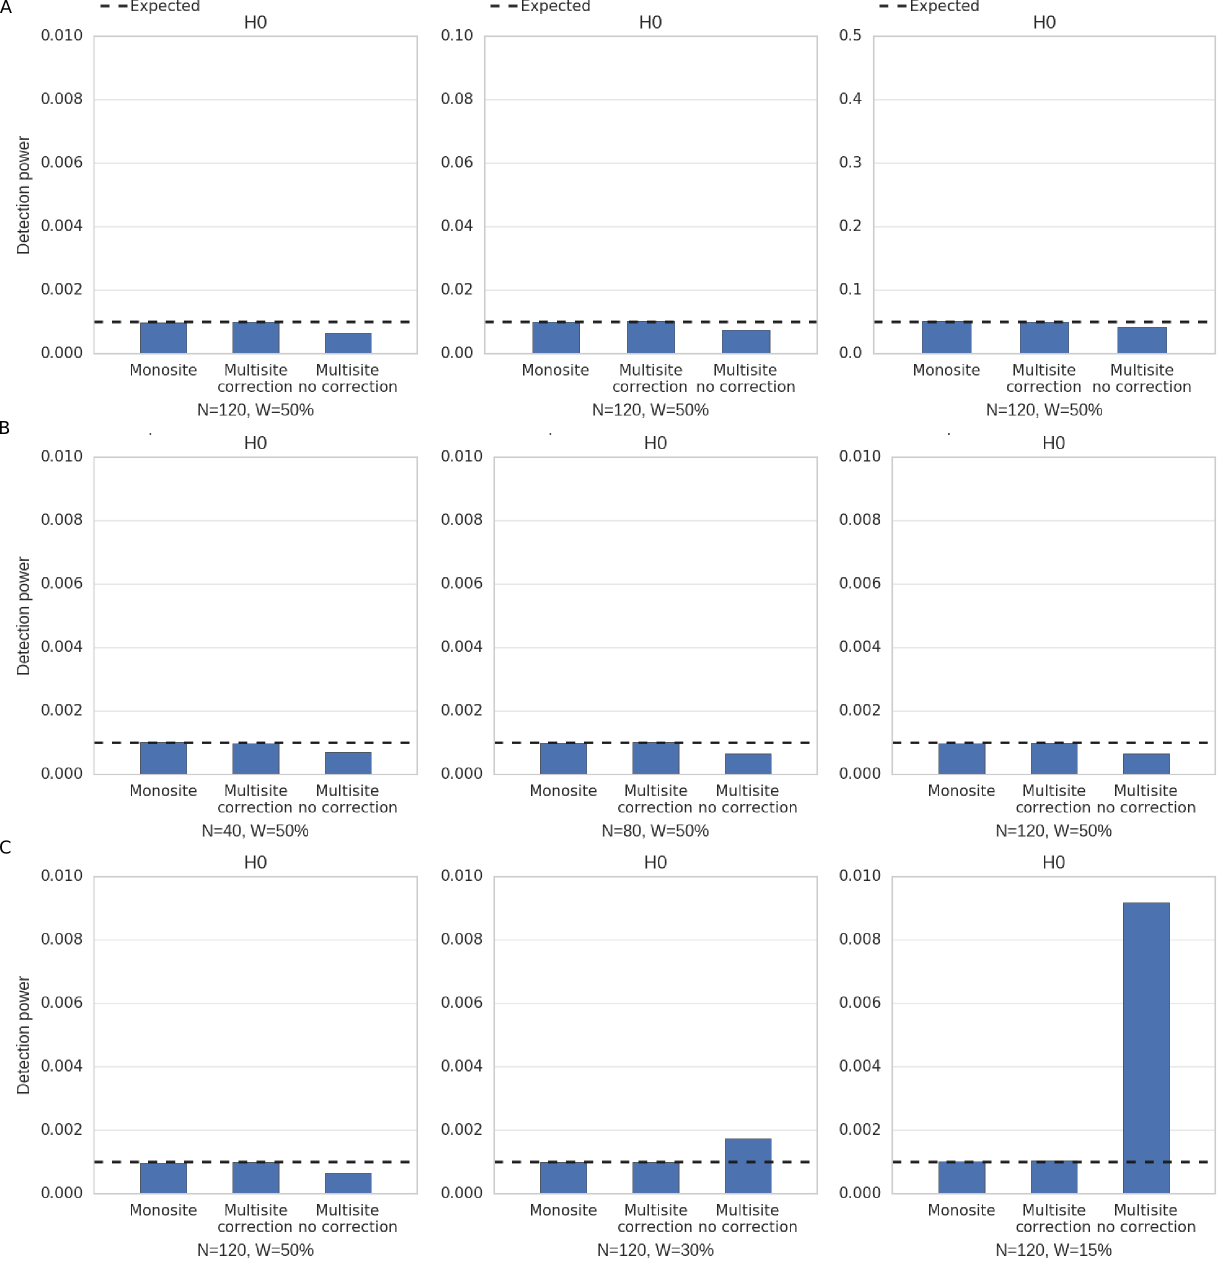
Validity of the control of false positives in the GLM
An excellent control of the false positive rate was observed at all nominal levels , both in monosite simulations or in multisite simulations, when site covariates were included in the GLM, see Figure 4. This means that the nominal, user-specified, false positive rate matched precisely with the effective false positive rate measured in the simulations. This observation held for any combination of allocation ratio, }, and sample size, . By contrast, when no site covariates were included in the GLM, the false positive rate was not controlled appropriately, sometimes by a wide margin. In the absence of site covariates, the procedure was sometimes too conservative, e.g. , and sometimes very liberal, e.g. . This experiment showed that, despite the mild departure from homoscedasticity reported above, the GLM does control for false-positive rate at each connection very precisely, if and only if site covariates are included in the model.
Statistical power and effect size
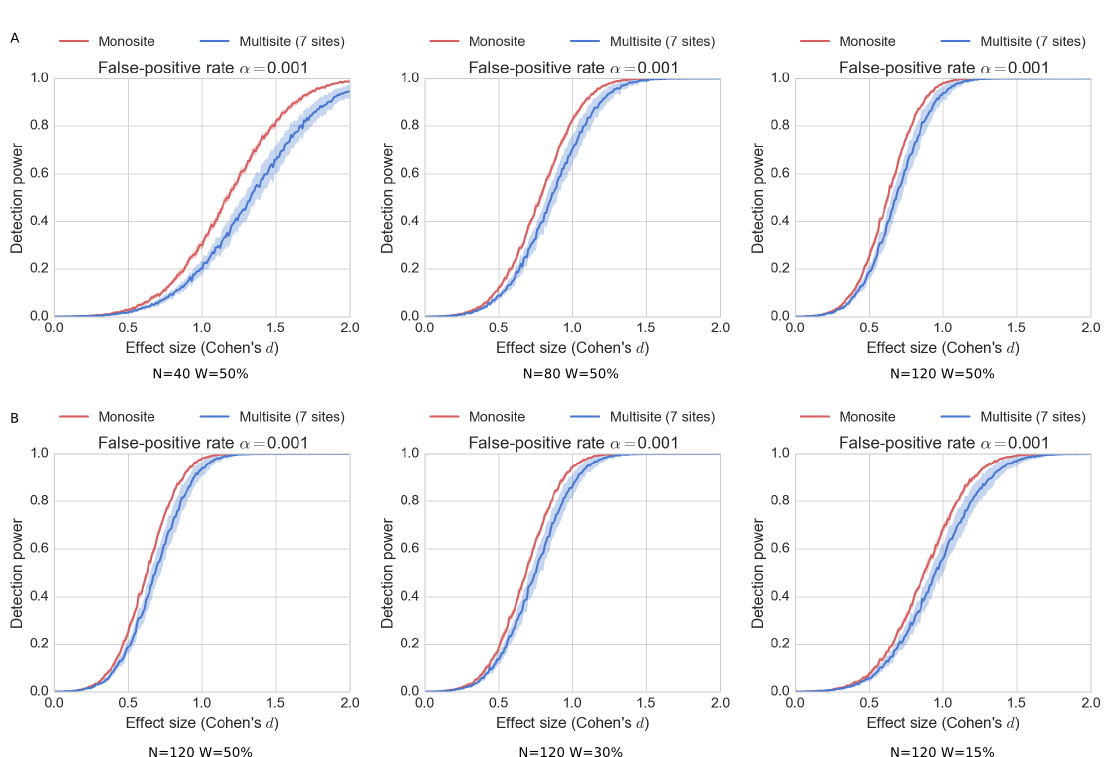
Figure 5A shows the relationship between effect size and a GLM detection power in experiment , i.e. for a fixed allocation ratio () and three different sample sizes, . The average and std of detection power was plotted across the 11 selected connections. The variations of statistical power across connections were very small for monosite simulations, as the effect size was adjusted based on the standard deviation of each connection within that sample. As expected, the sensitivity increased with sample size, quite markedly. In multisite simulations (), for a large effect size (), the detection power was with 40 subjects , with 80 subjects and with subjects. The sensitivity was larger with a single site than a multisite sample, yet the difference between the two decreased as sample size increased. With and , the detection power was close to for a single site sample, compared to for the multisite sample. With and , the difference in sensitivity was only of a few percent. The same trend was apparent for all tested effect sizes as well as for (not shown).
Statistical power and group allocation ratio
Figure 5B shows the relationship between effect size and a GLM detection power in experiment , i.e. for a fixed sample size () and three different patient allocation ratio, . Overall, we found that the detection power increased with . For example, with , the detection power was for , and increased to with , and finally for . The impact of was observed in both monosite and multisite samples, with an optimal allocation ratio of for both. This observation was also made for (not shown).
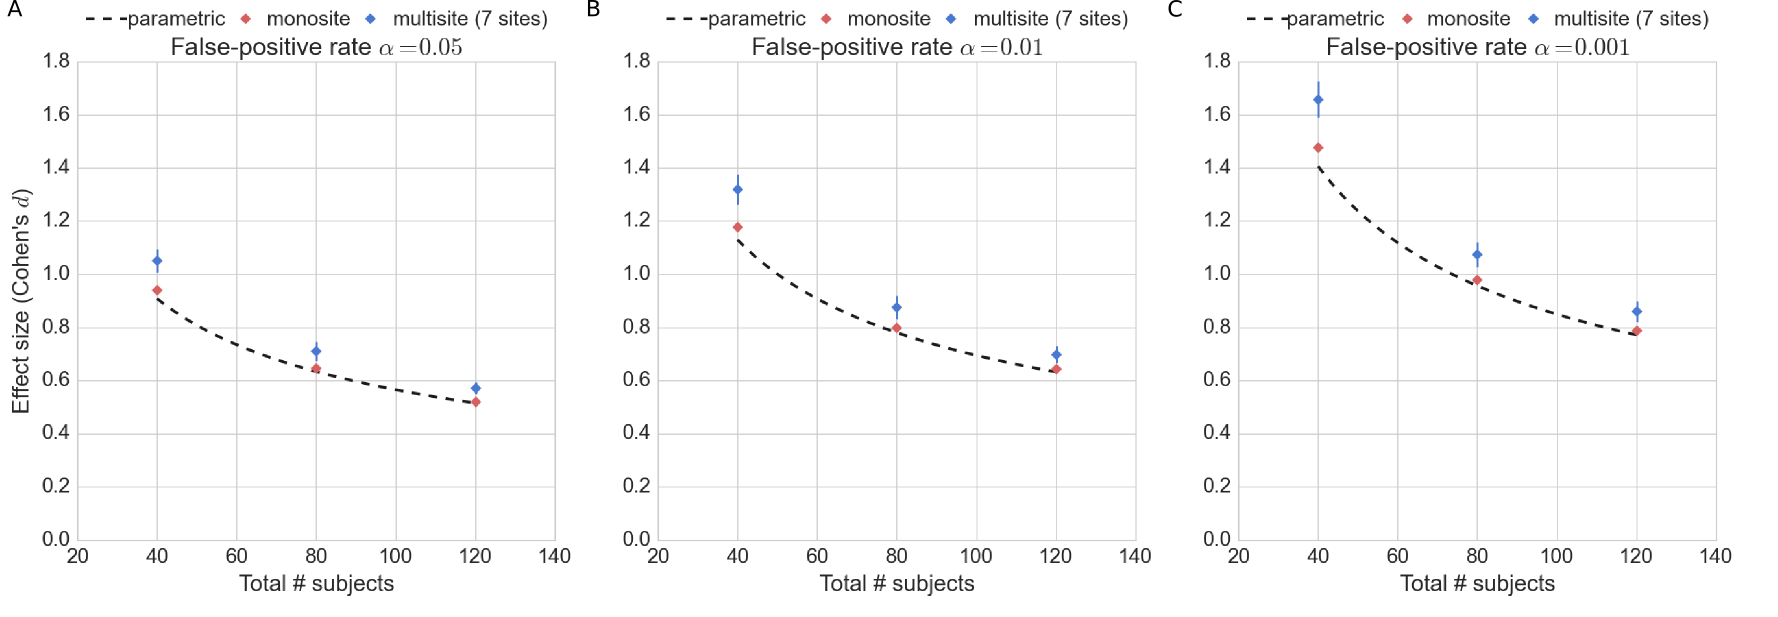
Detectable effect size, as a function of sample size
An alternative summary of experiment is to represent the effect size that can be detected with 80% sensitivity, as a function of sample size for monosite and multisite configurations, see Figure 6. As a reference, we computed the same curve for parametric -test comparisons, under assumptions of normality. As expected, the detectable effect size for parametric -tests closely followed the monosite estimation. For a small sample size (), the detectable effect size was notably larger in multisite configurations than in a monosite configuration (difference of about 0.25 in Cohen’s for ). However, the difference decreased for large sample sizes to become smaller than 0.1 with and . The lowest detectable effect size for a sensitivity of at was about , achieved in a monosite configuration with . At this sample size, the difference between single and multisite configurations was marginal, with only a few percent’s of difference in detectable effect sizes.
Prediction accuracy
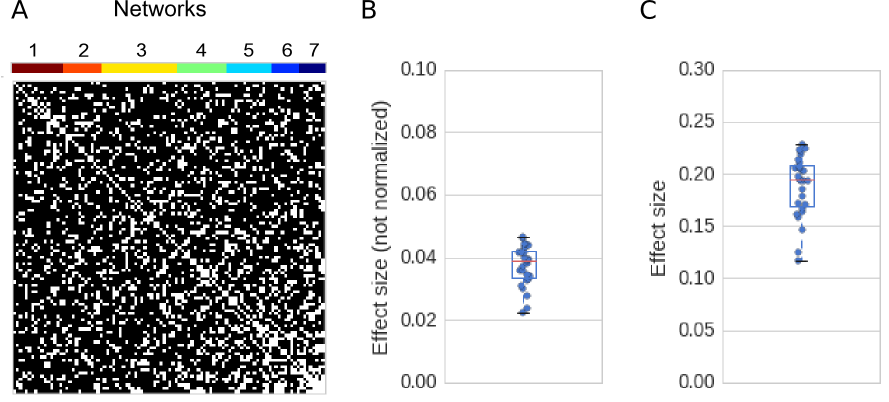
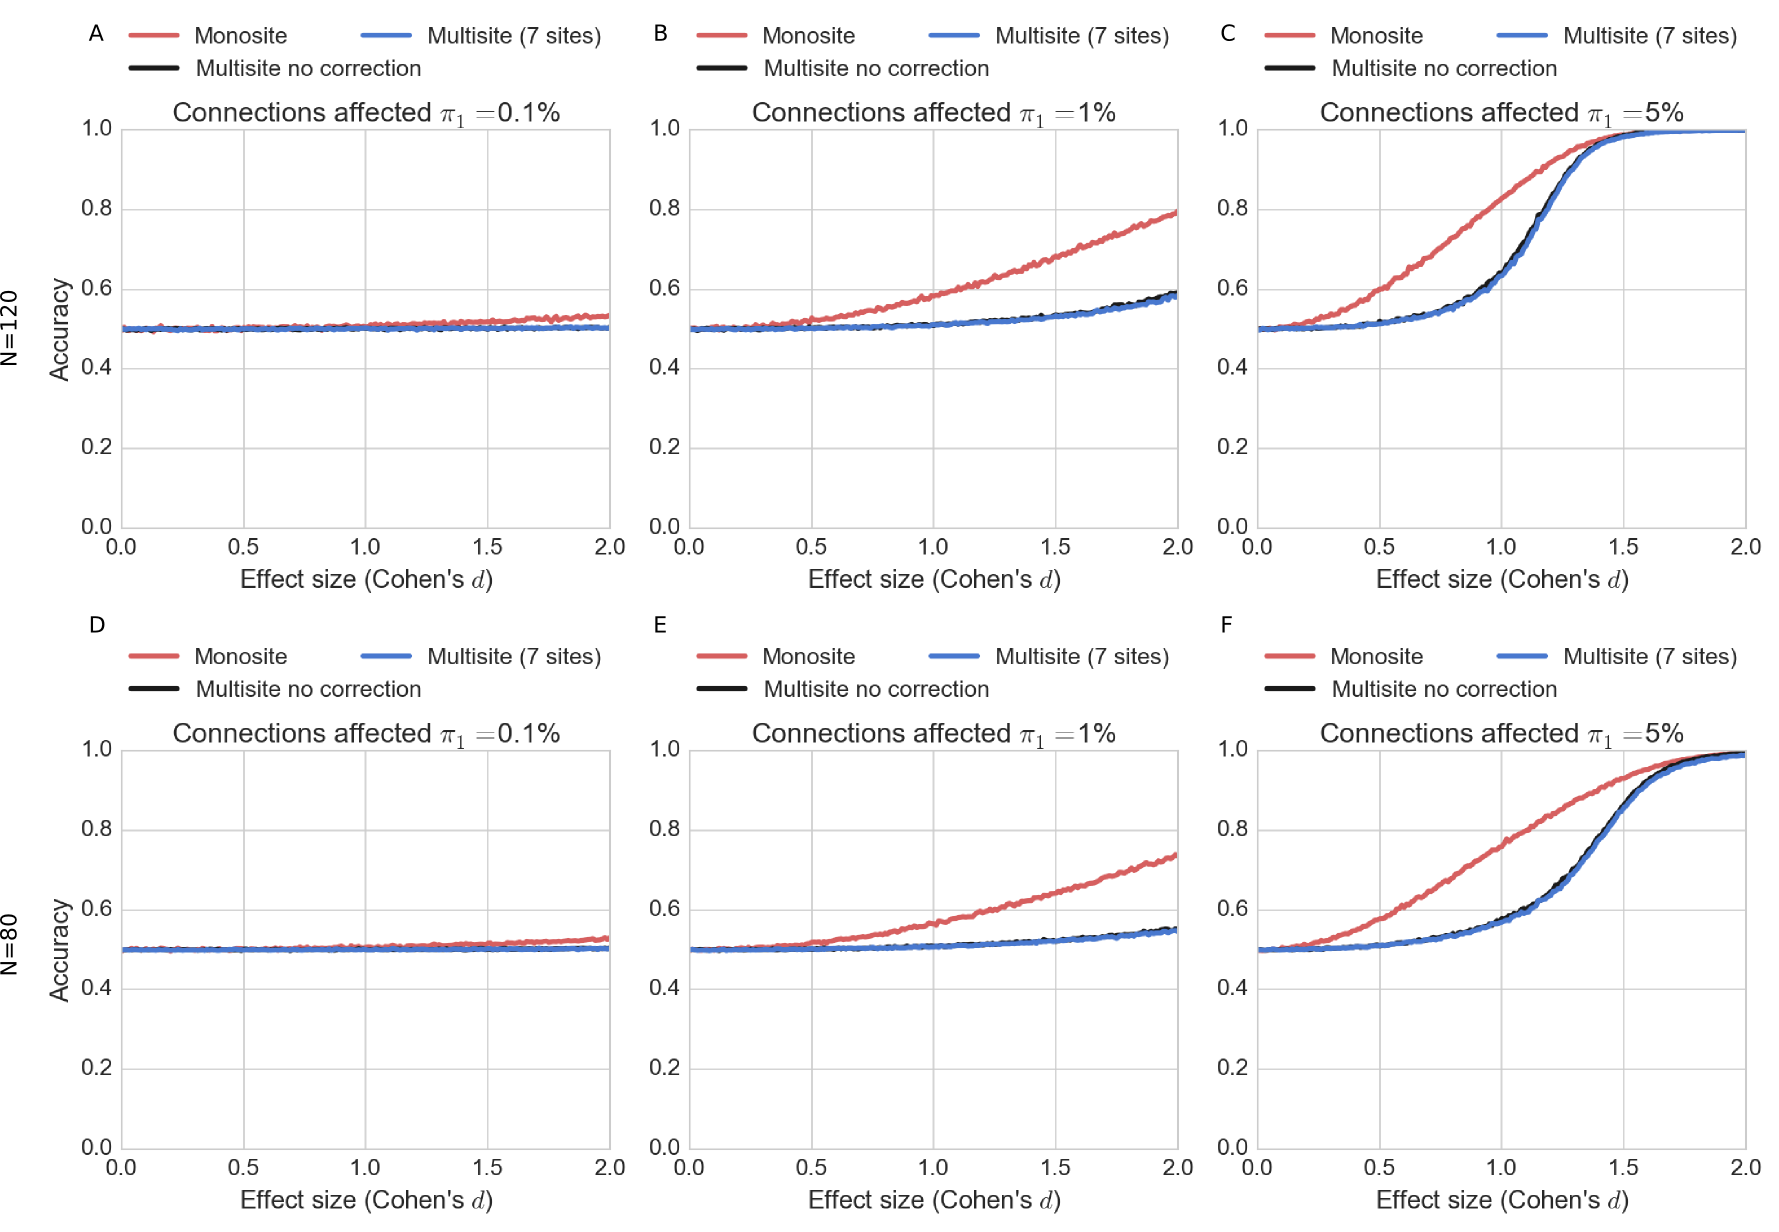
In experiment , we examined the impact of effect size and the volume of affected connections on prediction accuracy in a SVM, see Figure 7. The volume of changes had a major impact on prediction accuracy. At (around 5 connections) the accuracy level was at chance level across all tested effect sizes, (Figure 7A). With , accuracy slightly increased, but effect sizes larger than were still required to reach over accuracy (Figure 7B). With , accuracy was achieved at the same effect size (about ) for monosite and multisite simulations, although the accuracy in multisite simulations was notably lower than for monosite simulations across most effect sizes (Figure 7C). The relationship between effect size and accuracy followed a sigmoidal curve in both settings, yet a sharper, and later transition between very low and very high accuracy was observed in multisite simulations. Interestingly, correcting for site effects by regressing out the dummy variable before running the SVM classifier had no impact on accuracy levels. The sample size ( vs for training) did have a moderate effect on prediction accuracy: for and and monosite simulations, accuracy was about with (Figure 7C) and with (Figure 7F).
4 Discussion and conclusions
Inter-site effects in rs-fMRI connectivity
Typical resting-state networks, such as the DMN, the attentional, visual and sensorimotor networks, were reliably found across sites. This was strongly expected given the relative consistency of their distribution across individuals, studies, preprocessing approaches or even methods used to extract networks (e.g. Damoiseaux et al., 2006; van den Heuvel et al., 2008; Bellec et al., 2010b; Yeo et al., 2011; Power et al., 2011). We however found that significant differences
in average connectivity existed between sites, as previously
reported by Yan et al. (2013). These site effects in connectivity may undermine the
generalization of the results derived at a single site. The inter-subject
(intra-site) standard deviation of the connections was found to be more than
twice as large as the inter-site absolute effect, on average across brain connections. This effect size measured in Cohen’s d would be deemed small-to-moderate, which suggests that the impact of additive inter-site effects on statistical tests will be limited. This is a reassuring finding supporting the feasibility of statistical tests pooling fMRI data across multiple sites. Previous studies (Sutton et al., 2008; Brown et al., 2011) had reported inter-site variance up to 10 times smaller than inter-subject variability, but these studies had much more homogeneous scanning environments than ours and also used different fMRI outcome measures. In our case, we still investigated only 3T scanners, mostly Siemens, and inter-site effects may be larger when considering other manufacturers or field strengths.
Statistical power and multisite rs-fMRI
After accounting for site-related additive effects in a GLM, the multisite simulation pooling 7 sites together showed detection power close to that of a monosite simulation with equivalent sample size. The difference was noticeable for small sample size (total ), and became very small for a sample size . Another observation was that, for a given detection power, the lowest effect size that we were able to detect was more variable across connections for a low sample size. We demonstrated that a parametric group GLM does control precisely for the rate of false positive discoveries, even in multisite settings, as long as site covariates are included in the model. Taken together, these observations suggest to use sample sizes larger than subjects for GLM multisite studies. This conclusion may depend on the number of sites pooled in the study and the actual number of subjects in each of those sites, which we could not test in this work due to the size of the available sample.
Modeling site effects as random variables
We modeled the effect of each site on the average connectivity between any given pair of regions as a fixed effect. This means that the proposed GLM inference does apply only to collection of sites included in a given analysis. The linear mixed-effects model (Chen et al., 2013) would allow more powerful inferences: by modeling site effects as random variables, following a specific distribution (e.g. Gaussian), we would be able to generalize observations potentially to any collection of sites, provided our assumptions are accurate. The sample of sites available for this study (7 at most) is however too small in our view to correctly estimate the variability of effects across sites. This work would also require to formulate and investigate empirically as well as on simulations different models for the distribution of inter-site variations of site effects (e.g. Gaussian distribution).
Site heteroscedasticity
We observed mild heteroscedasticity across sites. Our simulations showed that this does not compromise the control of false positive rate in the GLM, even under homoscedastic assumptions, with the range of contrasts we investigated. Regression models more robust to heteroscedasticity may be investigated in the future, e.g. weighted least squares regression or linear mixed-effects modeling (Chen et al., 2013).
Statistical power and sample size
For a medium effect size, e.g. , the sensitivity was low (below ), even for monosite simulations with subjects. This sobering result supports the current trend in the literature to pool multiple data samples to increase sample size, at the cost of decreased homogeneity. We also found that resting-state studies based on 40 subjects or less, even at a single site, are seriously underpowered, except for extremely large effect sizes (Cohen’s greater than 1.5). Finally, unbalanced patient allocation ratio in site samples greatly reduces sensitivity, even in monosite studies. Balanced datasets, i.e. with equal numbers of patients and controls at each site, should therefore be favored.
Prediction
Comparing the monosite and the multisite accuracy curves reveals a substantial drop in accuracy from monosite to multisite across a broad range of effect sizes. However, it should be noted that classifiers trained across multiple data sources will likely generalize better to new observations, which is likely a critical feature in most applications and reflects the true potential clinical utility of this type of technique. Our conclusions are consistent with the work of Nielsen et al. (2013), which compares the prediction of a clinical diagnosis of autism in monosite vs. multisite settings. The authors concluded that the prediction accuracy for the multisite sample was significantly smaller than for the monosite sample. A somewhat surprising observation in our analysis was that linear correction for site-specific effects did not improve accuracy of prediction using SVM. The SVM model seems to learn features that are invariant across sites, maybe focusing on connections with the smallest site effect, or looking at differences between connections similarly impacted by a site effect. Finally, an important conclusion of our simulations was that the volume of brain connections affected by a disease impacts accuracy as much as the effect size per connection. This suggests that feature reduction and/or selection is a very important step to improve sensitivity to small effect sizes.
Beyond additive site effect
An important limitation to our study is that we only investigated the impact of additive effects in brain connectivity across sites. Areas of future work include interactions between site effects and pathology, possibly in the form of polynomial and non-linear interactions. We hope that, in the future, fMRI data acquired on clinical cohorts at tens of sites will become available, which will enable researchers to test empirically the presence of such interaction effects.
Other types of multisite data
Another limitation of our study is that we only investigated multisite data featuring roughly equal sample sizes with fairly balanced patient allocation ratios at each site. Multisite studies including a very large number of sites with sometimes only a few subjects per site are however quite common, e.g. the Alzheimer’s disease neuroimaging initiative (ADNI) (Mueller et al., 2005) and many pharmaceutical clinical trials at phase II and III 131313http://www.rochetrials.com/trialDetailsGet.action?studyNumber=BP28248. In this type of design, the multisite effect may play a much more pronounced role than in our simulations as it cannot be modeled in the GLM, and will become an intrinsic added source of inter-subject variance (Feaster et al., 2011). Unfortunately, this type of design could not be tested with the current dataset due to the limited number of sites available. This represents an important avenue of future work.
Underlying causes of the site effects
Not all sites seemed to be equally impacted by the site effects, with sites like Berlin or Saint-Louis showing a small number of connections significantly different then the grand average connectivity matrix, while sites like Baltimore, Queensland and Oxford showed many more connections affected by the site effects. Interestingly this can potentially be due to temporal variance of the connections (see Supplementary Figure S3) partly explained by the scanner make since Queensland and Baltimore site used scanners from different makers (namely Bruker and Philips) than the rest of the sites used in this study (Siemens scanners). This may suggest that scanners SNR (signal to noise ratio) may partly explain the variance of connectivity. These differences may not be statistically significant, or they may reflect real differences due to protocol, scanner characteristics at these sites or differences in sampling across sites. Multiple causes may be interacting together to produce the site effects, as reported by Yan et al. (2013), although some of these sources of variance could be better controlled like the scanner parameters, paired with the use of a phantom to promote more homogeneous configurations across sites (Friedman et al., 2006; Friedman and Glover, 2006; Glover et al., 2012; Friedman et al., 2008). Even in standardized experiments, it should be noted that differences in scanner protocols remain (Brown et al., 2011). A much larger multisite sample with systematically varying parameters could enable a data-driven identification of the critical parameters impacting site effects. The various releases made by the INDI initiative may fill that gap in the literature in the future, as the scanner protocols are much better described in recent releases, such as CoRR (Zuo et al., 2014), than they were in the initial FCP release. These findings stress the need for more work to find the source of that variance rather than ad-hoc procedures to correct for them.
5 Acknowledgments
Parts of this work were presented at the 2013 annual meeting of the Organization for Human Brain Mapping, as well as the 2013 Alzheimer’s Association International Conference (AAIC) (Dansereau et al., 2013). The authors are grateful to the members of the 1000 functional connectome consortium for publicly releasing their datasets. The computational resources used to perform the data analysis were provided by ComputeCanada141414https://computecanada.org/ and CLUMEQ151515http://www.clumeq.mcgill.ca/, which is funded in part by NSERC (MRS), FQRNT, and McGill University. This project was funded by NSERC grant number RN000028 and the Canadian Consortium on Neurodegeneration in Aging (CCNA), through a grant from the Canadian Institute of Health Research and funding from several partners including SANOFI-ADVENTIS R&D. PB is supported by a salary award from “Fonds de recherche du Québec – Santé” and the Courtois Foundation.
References
References
- Abraham et al. (2016) Abraham, A., Milham, M., Di Martino, A., Craddock, R. C., Samaras, D., Thirion, B., Varoquaux, G., 2016. Deriving reproducible biomarkers from multi-site resting-state data: An autism-based example. NeuroImage.
- Ad-Dab’bagh et al. (2006) Ad-Dab’bagh, Y., Einarson, D., Lyttelton, O., Muehlboeck, J. S., Mok, K., Ivanov, O., Vincent, R. D., Lepage, C., Lerch, J., Fombonne, E., Evans, A. C., 2006. The CIVET Image-Processing environment: A fully automated comprehensive pipeline for anatomical neuroimaging research. In: Corbetta, M. (Ed.), Proceedings of the 12th Annual Meeting of the Human Brain Mapping Organization. Neuroimage, Florence, Italy.
- Anand et al. (2007) Anand, A., Li, Y., Wang, Y., Gardner, K., Lowe, M. J., 2007. Reciprocal effects of antidepressant treatment on activity and connectivity of the mood regulating circuit: an fmri study. The Journal of neuropsychiatry and clinical neurosciences.
-
Bellec et al. (2010a)
Bellec, P., Carbonell, F., Perlbarg, V., Evans, A. C., 2010a. A
neuroimaging analysis kit for Octave and Matlab.
URL http://code.google.com/p/niak/ - Bellec et al. (2011) Bellec, P., Carbonell, F. M., Perlbarg, V., Lepage, C., Lyttelton, O., Fonov, V., Janke, A., Tohka, J., Evans, A. C., 2011. A neuroimaging analysis kit for Matlab and Octave. In: Proceedings of the 17th International Conference on Functional Mapping of the Human Brain. pp. In Press+.
-
Bellec et al. (2012)
Bellec, P., Lavoie-Courchesne, S., Dickinson, P., Lerch, J. P., Zijdenbos,
A. P., Evans, A. C., 2012. The pipeline system for Octave and Matlab (PSOM):
a lightweight scripting framework and execution engine for scientific
workflows. Frontiers in neuroinformatics 6.
URL http://dx.doi.org/10.3389/fninf.2012.00007 -
Bellec et al. (2010b)
Bellec, P., Rosa-Neto, P., Lyttelton, O. C., Benali, H., Evans, A. C., Jul.
2010b. Multi-level bootstrap analysis of stable clusters in
resting-state fMRI. NeuroImage 51 (3), 1126–1139.
URL http://dx.doi.org/10.1016/j.neuroimage.2010.02.082 - Benjamini and Hochberg (1995) Benjamini, Y., Hochberg, Y., 1995. Controlling the false-discovery rate: a practical and powerful approach to multiple testing. J. Roy. Statist. Soc. Ser. B 57, 289–300.
-
Biswal et al. (2010)
Biswal, B. B., Mennes, M., Zuo, X.-N. N., Gohel, S., Kelly, C., Smith, S. M.,
Beckmann, C. F., Adelstein, J. S., Buckner, R. L., Colcombe, S., Dogonowski,
A.-M. M., Ernst, M., Fair, D., Hampson, M., Hoptman, M. J., Hyde, J. S.,
Kiviniemi, V. J., Kötter, R., Li, S.-J. J., Lin, C.-P. P., Lowe, M. J.,
Mackay, C., Madden, D. J., Madsen, K. H., Margulies, D. S., Mayberg, H. S.,
McMahon, K., Monk, C. S., Mostofsky, S. H., Nagel, B. J., Pekar, J. J.,
Peltier, S. J., Petersen, S. E., Riedl, V., Rombouts, S. A., Rypma, B.,
Schlaggar, B. L., Schmidt, S., Seidler, R. D., Siegle, G. J., Sorg, C., Teng,
G.-J. J., Veijola, J., Villringer, A., Walter, M., Wang, L., Weng, X.-C. C.,
Whitfield-Gabrieli, S., Williamson, P., Windischberger, C., Zang, Y.-F. F.,
Zhang, H.-Y. Y., Castellanos, F. X., Milham, M. P., Mar. 2010. Toward
discovery science of human brain function. Proceedings of the National
Academy of Sciences of the United States of America 107 (10), 4734–4739.
URL http://dx.doi.org/10.1073/pnas.0911855107 - Brown et al. (2011) Brown, G. G., Mathalon, D. H., Stern, H., Ford, J., Mueller, B., Greve, D. N., McCarthy, G., Voyvodic, J., Glover, G., Diaz, M., et al., 2011. Multisite reliability of cognitive bold data. Neuroimage 54 (3), 2163–2175.
- Caramanos et al. (2010) Caramanos, Z., Fonov, V. S., Francis, S. J., Narayanan, S., Pike, G. B., Collins, D. L., Arnold, D. L., 2010. Gradient distortions in mri: Characterizing and correcting for their effects on siena-generated measures of brain volume change. NeuroImage 49 (2), 1601–1611.
- Chang and Lin (2011) Chang, C.-C., Lin, C.-J., 2011. LIBSVM: A library for support vector machines. ACM Transactions on Intelligent Systems and Technology 2, 27:1–27:27, software available at http://www.csie.ntu.edu.tw/~cjlin/libsvm.
- Chen et al. (2013) Chen, G., Saad, Z. S., Britton, J. C., Pine, D. S., Cox, R. W., 2013. Linear mixed-effects modeling approach to fmri group analysis. Neuroimage 73, 176–190.
-
Cheng et al. (2015)
Cheng, W., Palaniyappan, L., Li, M., Kendrick, K. M., Zhang, J., Luo, Q., Liu,
Z., Yu, R., Deng, W., Wang, Q., Ma, X., Guo, W., Francis, S., Liddle, P.,
Mayer, A. R., Schumann, G., Li, T., Feng, J., May 2015. Voxel-based,
brain-wide association study of aberrant functional connectivity in
schizophrenia implicates thalamocortical circuitry. Npj Schizophrenia 1, –.
URL http://dx.doi.org/10.1038/npjschz.2015.16 - Cohen (1992) Cohen, J., 1992. A power primer. Psychological bulletin 112 (1), 155.
-
Collins et al. (1994)
Collins, D. L., Neelin, P., Peters, T. M., Evans, A. C., 1994. Automatic 3D
intersubject registration of MR volumetric data in standardized Talairach
space. Journal of computer assisted tomography 18 (2), 192–205.
URL http://view.ncbi.nlm.nih.gov/pubmed/8126267 -
Cortes and Vapnik (1995)
Cortes, C., Vapnik, V., Sep. 1995. Support-vector networks. Machine Learning
20 (3), 273–297.
URL http://dx.doi.org/10.1007/BF00994018 -
Damoiseaux et al. (2006)
Damoiseaux, J. S., Rombouts, S. A. R. B., Barkhof, F., Scheltens, P., Stam,
C. J., Smith, S. M., Beckmann, C. F., Sep. 2006. Consistent resting-state
networks across healthy subjects. Proceedings of the National Academy of
Sciences 103 (37), 13848–13853.
URL http://dx.doi.org/10.1073/pnas.0601417103 -
Dansereau et al. (2014)
Dansereau, C., Bellec, P., Lee, K., Pittau, F., Gotman, J., Grova, C., 2014.
Detection of abnormal resting-state networks in individual patients suffering
from focal epilepsy: An initial step toward individual connectivity
assessment. Frontiers in Neuroscience 8 (419).
URL http://www.frontiersin.org/brain_imaging_methods/10.3389/fnins.2014.00419/abstract -
Dansereau et al. (2013)
Dansereau, C., Risterucci, C., Pich, E. M., Arnold, D., Bellec, P., 2013. A
power analysis for multisite studies in resting-state functional
connectivity, with an application to clinical trials in alzheimer’s disease.
Vol. 9. pp. P248 – P249, alzheimer’s Association International Conference
2013 Alzheimer’s Association International Conference 2013.
URL http://www.sciencedirect.com/science/article/pii/S1552526013011461 -
Desmond and Glover (2002)
Desmond, J., Glover, G., Aug. 2002. Estimating sample size in functional mri
(fmri) neuroimaging studies: Statistical power analyses. Journal of
Neuroscience Methods 118 (2), 115–128.
URL http://dx.doi.org/10.1016/s0165-0270(02)00121-8 - Durnez et al. (2014) Durnez, J., Moerkerke, B., Nichols, T. E., 2014. Post-hoc power estimation for topological inference in fmri. Neuroimage 84, 45–64.
- Edward et al. (2000) Edward, V., Windischberger, C., Cunnington, R., Erdler, M., Lanzenberger, R., Mayer, D., Endl, W., Beisteiner, R., Nov 2000. Quantification of fmri artifact reduction by a novel plaster cast head holder. Hum Brain Mapp 11 (3), 207–213.
- Elliott et al. (1999) Elliott, M. R., Bowtell, R. W., Morris, P. G., Jun 1999. The effect of scanner sound in visual, motor, and auditory functional mri. Magn Reson Med 41 (6), 1230–1235.
-
Fair et al. (2012)
Fair, D. A., Nigg, J. T., Iyer, S., Bathula, D., Mills, K. L., Dosenbach, N.
U. F., Schlaggar, B. L., Mennes, M., Gutman, D., Bangaru, S., Buitelaar,
J. K., Dickstein, D. P., Martino, A. D., Kennedy, D. N., Kelly, C., Luna, B.,
Schweitzer, J. B., Velanova, K., Wang, Y.-F., Mostofsky, S., Castellanos,
F. X., Milham, M. P., 2012. Distinct neural signatures detected for adhd
subtypes after controlling for micro-movements in resting state functional
connectivity mri data. Front Syst Neurosci 6, 80.
URL http://dx.doi.org/10.3389/fnsys.2012.00080 -
Feaster et al. (2011)
Feaster, D., Mikulich-Gilbertson, S., Brincks, A., Sep. 2011. Modeling site
effects in the design and analysis of multi-site trials. The American journal
of drug and alcohol abuse 37 (5), 383–391.
URL http://dx.doi.org/10.3109/00952990.2011.600386 -
Fonov et al. (2011)
Fonov, V., Evans, A. C., Botteron, K., Almli, C. R., McKinstry, R. C., Collins,
D. L., Brain Development Cooperative Group, Jan. 2011. Unbiased average
age-appropriate atlases for pediatric studies. NeuroImage 54 (1), 313–327.
URL http://dx.doi.org/10.1016/j.neuroimage.2010.07.033 -
Friedman and Glover (2006)
Friedman, L., Glover, G., Jun. 2006. Report on a multicenter fmri quality
assurance protocol. Journal of magnetic resonance imaging : JMRI 23 (6),
827–839.
URL http://dx.doi.org/10.1002/jmri.20583 -
Friedman et al. (2006)
Friedman, L., Glover, G., Consortium, T. F., Nov. 2006. Reducing interscanner
variability of activation in a multicenter fmri study: Controlling for
signal-to-fluctuation-noise-ratio (sfnr) differences. NeuroImage 33 (2),
471–481.
URL http://dx.doi.org/10.1016/j.neuroimage.2006.07.012 - Friedman et al. (2008) Friedman, L., Stern, H., Brown, G. G., Mathalon, D. H., Turner, J., Glover, G. H., Gollub, R. L., Lauriello, J., Lim, K. O., Cannon, T., et al., 2008. Test–retest and between-site reliability in a multicenter fmri study. Human brain mapping 29 (8), 958–972.
-
Giove et al. (2009)
Giove, F., Gili, T., Iacovella, V., Macaluso, E., Maraviglia, B., Oct. 2009.
Images-based suppression of unwanted global signals in resting-state
functional connectivity studies. Magnetic resonance imaging 27 (8),
1058–1064.
URL http://dx.doi.org/10.1016/j.mri.2009.06.004 - Glover et al. (2012) Glover, G. H., Mueller, B. A., Turner, J. A., van Erp, T. G., Liu, T. T., Greve, D. N., Voyvodic, J. T., Rasmussen, J., Brown, G. G., Keator, D. B., et al., 2012. Function biomedical informatics research network recommendations for prospective multicenter functional mri studies. Journal of Magnetic Resonance Imaging 36 (1), 39–54.
-
Greicius et al. (2004)
Greicius, M. D., Srivastava, G., Reiss, A. L., Menon, V., Mar. 2004.
Default-mode network activity distinguishes Alzheimer’s disease from healthy
aging: Evidence from functional MRI. Proceedings of the National Academy of
Sciences of the United States of America 101 (13), 4637–4642.
URL http://dx.doi.org/10.1073/pnas.0308627101 - Hunter (2007) Hunter, J. D., 2007. Matplotlib: A 2d graphics environment. Computing In Science & Engineering 9 (3), 90–95.
- Jovicich et al. (2016) Jovicich, J., Minati, L., Marizzoni, M., Marchitelli, R., Sala-Llonch, R., Bartrés-Faz, D., Arnold, J., Benninghoff, J., Fiedler, U., Roccatagliata, L., et al., 2016. Longitudinal reproducibility of default-mode network connectivity in healthy elderly participants: A multicentric resting-state fmri study. NeuroImage 124, 442–454.
- Kilpatrick et al. (2006) Kilpatrick, L., Zald, D., Pardo, J., Cahill, L., 2006. Sex-related differences in amygdala functional connectivity during resting conditions. Neuroimage 30 (2), 452–461.
-
Lund et al. (2006)
Lund, T. E., Madsen, K. H., Sidaros, K., Luo, W.-L., Nichols, T. E., Jan. 2006.
Non-white noise in fMRI: does modelling have an impact? NeuroImage 29 (1),
54–66.
URL http://dx.doi.org/10.1016/j.neuroimage.2005.07.005 -
Milham et al. (2012)
Milham, M. P., Fair, D., Mennes, M., Mostofsky, S. H., 2012. The adhd-200
consortium: a model to advance the translational potential of neuroimaging in
clinical neuroscience. Frontiers in Systems Neuroscience 6 (62).
URL http://www.frontiersin.org/systems_neuroscience/10.3389/fnsys.2012.00062/full -
Mueller et al. (2005)
Mueller, S. G., Weiner, M. W., Thal, L. J., Petersen, R. C., Jack, C., Jagust,
W., Trojanowski, J. Q., Toga, A. W., Beckett, L., Nov 2005. The alzheimer’s
disease neuroimaging initiative. Neuroimaging Clin N Am 15 (4), 869–77,
xi–xii.
URL http://dx.doi.org/10.1016/j.nic.2005.09.008 -
Nielsen et al. (2013)
Nielsen, J., Zielinski, B., Fletcher, T., Alexander, A., Lange, N., Bigler, E.,
Lainhart, J., Anderson, J., 2013. Multisite functional connectivity mri
classification of autism: Abide results. Frontiers in human neuroscience 7,
–.
URL http://view.ncbi.nlm.nih.gov/pubmed/24093016 -
Orban et al. (2015)
Orban, P., Madjar, C., Savard, M., Dansereau, C., Tam, A., Das, S., Evans,
A. C., Rosa-Neto, P., Breitner, J. C., Bellec, P., oct 2015. Test-retest
resting-state fMRI in healthy elderly persons with a family history of
alzheimer’s disease. Scientific Data 2, 150043.
URL http://dx.doi.org/10.1038/sdata.2015.43 -
Power et al. (2012)
Power, J. D., Barnes, K. A., Snyder, A. Z., Schlaggar, B. L., Petersen, S. E.,
Feb. 2012. Spurious but systematic correlations in functional connectivity
MRI networks arise from subject motion. NeuroImage 59 (3), 2142–2154.
URL http://dx.doi.org/10.1016/j.neuroimage.2011.10.018 -
Power et al. (2011)
Power, J. D., Cohen, A. L., Nelson, S. M., Wig, G. S., Barnes, K. A., Church,
J. A., Vogel, A. C., Laumann, T. O., Miezin, F. M., Schlaggar, B. L.,
Petersen, S. E., Nov. 2011. Functional Network Organization of the Human
Brain. Neuron 72 (4), 665–678.
URL http://dx.doi.org/10.1016/j.neuron.2011.09.006 -
Shehzad et al. (2009)
Shehzad, Z., Kelly, C. M., Reiss, P. T., Gee, D. G., Gotimer, K., Uddin, L. Q.,
Lee, S. H. H., Margulies, D. S., Roy, A. K. K., Biswal, B. B., Petkova, E.,
Castellanos, F. X., Milham, M. P., Oct. 2009. The resting brain:
unconstrained yet reliable. Cerebral cortex (New York, N.Y. : 1991) 19 (10),
2209–2229.
URL http://dx.doi.org/10.1093/cercor/bhn256 - Sheline et al. (2010) Sheline, Y. I., Price, J. L., Yan, Z., Mintun, M. A., 2010. Resting-state functional mri in depression unmasks increased connectivity between networks via the dorsal nexus. Proceedings of the National Academy of Sciences 107 (24), 11020–11025.
- Sutton et al. (2008) Sutton, B. P., Goh, J., Hebrank, A., Welsh, R. C., Chee, M. W., Park, D. C., 2008. Investigation and validation of intersite fmri studies using the same imaging hardware. Journal of Magnetic Resonance Imaging 28 (1), 21–28.
-
Tam et al. (2015)
Tam, A., Dansereau, C., Badhwar, A., Orban, P., Belleville, S., Chertkow, H.,
Dagher, A., Hanganu, A., Monchi, O., Rosa-Neto, P., Shmuel, A., Wang, S.,
Breitner, J., Bellec, P., 2015. Common effects of amnestic mild cognitive
impairment on resting-state connectivity across four independent studies.
Frontiers in Aging Neuroscience 7 (242).
URL http://www.frontiersin.org/aging_neuroscience/10.3389/fnagi.2015.00242/abstract -
van den Heuvel et al. (2008)
van den Heuvel, M., Mandl, R., Hulshoff Pol, H., Apr. 2008. Normalized Cut
Group Clustering of Resting-State fMRI Data. PLoS ONE 3 (4), e2001+.
URL http://dx.doi.org/10.1371/journal.pone.0002001 -
Van Dijk et al. (2010)
Van Dijk, K. R., Hedden, T., Venkataraman, A., Evans, K. C., Lazar, S. W.,
Buckner, R. L., Jan. 2010. Intrinsic functional connectivity as a tool for
human connectomics: theory, properties, and optimization. Journal of
neurophysiology 103 (1), 297–321.
URL http://dx.doi.org/10.1152/jn.00783.2009 - Van Dijk et al. (2012) Van Dijk, K. R., Sabuncu, M. R., Buckner, R. L., 2012. The influence of head motion on intrinsic functional connectivity mri. Neuroimage 59 (1), 431–438.
-
Vanhoutte et al. (2006)
Vanhoutte, G., Verhoye, M., der Linden, A. V., May 2006. Changing body
temperature affects the t2* signal in the rat brain and reveals hypothalamic
activity. Magn Reson Med 55 (5), 1006–1012.
URL http://dx.doi.org/10.1002/mrm.20861 -
Wang et al. (2012)
Wang, D., Liu, B., Qin, W., Wang, J., Zhang, Y., Jiang, T., Yu, C., Dec. 2012.
KIBRA gene variants are associated with synchronization within the
default-mode and executive control networks. NeuroImage.
URL http://dx.doi.org/10.1016/j.neuroimage.2012.12.022 -
Worsley and Friston (1995)
Worsley, K. J., Friston, K. J., Sep. 1995. Analysis of fMRI Time-Series
Revisited—Again. NeuroImage 2 (3), 173–181.
URL http://dx.doi.org/10.1006/nimg.1995.1023 -
Yan et al. (2009)
Yan, C., Liu, D., He, Y., Zou, Q., Zhu, C., Zuo, X., Long, X., Zang, Y., May
2009. Spontaneous Brain Activity in the Default Mode Network Is Sensitive to
Different Resting-State Conditions with Limited Cognitive Load. PLoS ONE
4 (5), e5743+.
URL http://dx.doi.org/10.1371/journal.pone.0005743 -
Yan et al. (2013)
Yan, C.-G. G., Craddock, C. C., Zuo, X.-N. N., Zang, Y.-F. F., Milham, M. P.,
Oct. 2013. Standardizing the intrinsic brain: towards robust measurement of
inter-individual variation in 1000 functional connectomes. NeuroImage 80,
246–262.
URL http://view.ncbi.nlm.nih.gov/pubmed/23631983 -
Yeo et al. (2011)
Yeo, B. T., Krienen, F. M., Sepulcre, J., Sabuncu, M. R., Lashkari, D.,
Hollinshead, M., Roffman, J. L., Smoller, J. W., Zöllei, L., Polimeni,
J. R., Fischl, B., Liu, H., Buckner, R. L., Sep. 2011. The organization of
the human cerebral cortex estimated by intrinsic functional connectivity.
Journal of neurophysiology 106 (3), 1125–1165.
URL http://dx.doi.org/10.1152/jn.00338.2011 - Zuo et al. (2014) Zuo, X.-N., Anderson, J. S., Bellec, P., Birn, R. M., Biswal, B. B., Blautzik, J., Breitner, J. C. S., Buckner, R. L., Calhoun, V. D., Castellanos, F. X., Chen, A., Chen, B., Chen, J., Chen, X., Colcombe, S. J., Courtney, W., Craddock, R. C., Di Martino, A., Dong, H.-M., Fu, X., Gong, Q., Gorgolewski, K. J., Han, Y., He, Y., He, Y., Ho, E., Holmes, A., Hou, X.-H., Huckins, J., Jiang, T., Jiang, Y., Kelley, W., Kelly, C., King, M., LaConte, S. M., Lainhart, J. E., Lei, X., Li, H.-J., Li, K., Li, K., Lin, Q., Liu, D., Liu, J., Liu, X., Liu, Y., Lu, G., Lu, J., Luna, B., Luo, J., Lurie, D., Mao, Y., Margulies, D. S., Mayer, A. R., Meindl, T., Meyerand, M. E., Nan, W., Nielsen, J. A., O’Connor, D., Paulsen, D., Prabhakaran, V., Qi, Z., Qiu, J., Shao, C., Shehzad, Z., Tang, W., Villringer, A., Wang, H., Wang, K., Wei, D., Wei, G.-X., Weng, X.-C., Wu, X., Xu, T., Yang, N., Yang, Z., Zang, Y.-F., Zhang, L., Zhang, Q., Zhang, Z., Zhang, Z., Zhao, K., Zhen, Z., Zhou, Y., Zhu, X.-T., Milham, M. P., 9 Dec. 2014. An open science resource for establishing reliability and reproducibility in functional connectomics. Sci Data 1, 140049.
Supplementary Material – Statistical power and prediction accuracy in multisite resting-state fMRI connectivity
Submitted to Neuroimage.
C. Dansereau1,2, Y. Benhajali1,3,C. Risterucci4, E. Merlo Pich4, P. Orban1, D. Arnold5, P. Bellec1,2
1Centre de Recherche de l’Institut Universitaire de Gériatrie de Montréal, Montréal, CA
2Department of Computer Science and Operations Research, University of Montreal, Montreal, CA
3Département d’anthropologie, Universitd́e Montréal, Montréal, CA
4Clinical Imaging, pRED, F.Hoffman-La Roche, Basel, CH
5NeuroRx inc., Montréal, CA
For all questions regarding the paper, please address correspondence to Pierre Bellec, CRIUGM, 4545 Queen Mary, Montreal, QC, H3W 1W5, Canada. Email: pierre.bellec (at) criugm.qc.ca.