Star Cluster Formation and Destruction in the Merging Galaxy NGC 3256
Abstract
We use the Advanced Camera for Surveys on the Hubble Space Telescope to study the rich population of young massive star clusters in the main body of NGC 3256, a merging pair of galaxies with a high star formation rate (SFR) and SFR per unit area (). These clusters have luminosity and mass functions that follow power laws, with , and with for Myr clusters, similar to those found in more quiescent galaxies. The age distribution can be described by , with for clusters younger than about a few hundred million years, with no obvious dependence on cluster mass. This is consistent with a picture where of the clusters are disrupted each decade in time. We investigate the claim that galaxies with high form clusters more efficiently than quiescent systems by determining the fraction of stars in bound clusters () and the CMF/SFR statistic (CMF is the cluster mass function) for NGC 3256 and comparing the results with those for other galaxies. We find that the CMF/SFR statistic for NGC 3256 agrees well with that found for galaxies with and SFRs that are lower by orders of magnitude, but that estimates for are only robust when the same sets of assumptions are applied. Currently, values available in the literature have used different sets of assumptions, making it more difficult to compare the results between galaxies.
Subject headings:
galaxies: star clusters: general, galaxies: star formation, galaxies: star clusters: individual (NGC 3256)1. INTRODUCTION
NGC 3256 is a merging pair of galaxies Mpc away. Dynamical simulations suggest that the system began interacting Myr ago, and it has since undergone a period of major star and star cluster formation. It exhibits two tidal tails that are rich with young massive stellar clusters (Knierman et al. 2003; Maybhate et al. 2007; Trancho et al. 2007a; Mulia, Chandar, & Whitmore 2015). The main body of NGC 3256 contains a dense population of clusters, many of which are embedded in the galaxy’s dusty interstellar medium. The galaxy’s intense star formation makes it an extreme environment in which to study cluster formation and destruction.
The cluster population of NGC 3256 has been studied in a number of previous works. Zepf et al. (1999) used and band images taken with the Wide Field Planetary Camera 2 on the Hubble Space Telescope (HST) to examine the colors and luminosities of main body clusters. Using the fraction of blue light that they found in clusters, they estimated that the efficiency of cluster formation in NGC 3256 is . Trancho et al. (2007b) performed optical spectroscopy of 23 clusters in the main body of NGC 3256, finding ages of a few to Myr and masses from . Goddard, Bastian, & Kennicutt (2010; hereafter G10) estimated ages and masses of NGC 3256 clusters from photometry using HST’s Advanced Camera for Surveys (ACS) and estimated the fraction of stars forming in bound clusters, hereafter referred to as , to be . Their method involved estimating the cluster formation rate (CFR), taken from the total mass of clusters younger than 10 Myr, and dividing by the galaxy’s star formation rate (SFR).
Some works, including G10, have suggested that there is a correlation between and SFR density, (e.g., Silva-Villa & Larsen 2011; Cook et al. 2012), and between (the fraction of band light contained in clusters) and (Larsen & Richtler 2000; Adamo Östlin, & Zackrisson 2011). These relationships imply that the conditions for cluster formation are not universal, but are dependent on conditions in the host galaxy. Chandar, Fall, & Whitmore (2015), on the other hand, measured the cluster mass function (CMF) in seven galaxies and found that when normalized by the SFR, these CMFs fall nearly on top of one another. The CMF/SFR statistic implies that cluster formation is similar in many galaxies, regardless of SFR. We estimate both and, for the first time, the CMF/SFR statistic, in NGC 3256.
This paper is arranged as follows. Section 2 describes the observations and cluster selection. Section 3 describes the method for obtaining ages and masses of clusters. Section 4 presents the luminosity functions (LFs), age distributions, and mass functions for NGC 3256. In Section 5, we quantify the effects that distance has on the measured LF and age distribution of the clusters. We determine the CMF/SFR statistic and from our new NGC 3256 cluster sample in Section 6. We summarize our results and state conclusions in Section 7.
2. OBSERVATIONS, DATA REDUCTION, AND CLUSTER SELECTION
2.1. Observations and Data Reduction
Our observations come from the ACS on HST. NGC 3256 was observed using the filters ( in the Johnson–Cousins system; exposed for 2552 s), (H; 2552 s), and (; 11358 s) as part of the program GO-9735 (PI: Whitmore). The and band images were taken in 2003 November using the Wide Field Camera (WFC) and High Resolution Camera (HRC), respectively. The H observations were taken in 2004 March. WFC observations using () and () filters were taken in 2005 November as part of program GO-10592 (PI: Evans) for 1320 and 760 s, respectively.
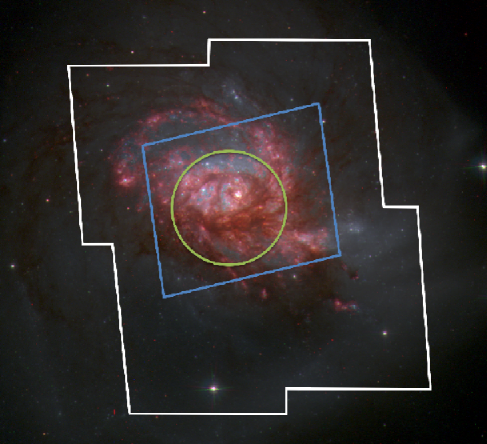
The raw data were processed through the standard ACS pipeline. The reduced, multidrizzled WFC images were taken from the Hubble Legacy Archive (HLA) and have a scale of 0.05′′ per pixel, while band images taken with HRC have 0.025′′ per pixel. A H color image of NGC 3256 is shown in Figure 1.
2.2. Cluster Selection
We use the IRAF111IRAF is distributed by the National Optical Astronomy Observatory, which is operated by the Association of Universities for Research in Astronomy (AURA) under a cooperative agreement with the National Science Foundation. task DAOFIND on the band image to make an initial catalog of point sources in NGC 3256. Using the PHOT task in IRAF, we run photometry on the , , and band images using an aperture of 3 pixels in radius and a background area between 5 and 8 pixels in radius. For the band image, we use an aperture radius of 6 pixels and a background area of radius pixels, since the HRC has twice the resolution of the WFC. We use the ACS photometric zeropoint calculator222http://www.stsci.edu/hst/acs/analysis/zeropoints to convert instrumental magnitudes to the VEGAMAG system. We use aperture corrections from 3 pixels to infinity in , , and bands taken from isolated star clusters found in the tidal tails of NGC 3256 and reported in Mulia, Chandar, and Whitmore (2015). For the band aperture correction, we find 15 isolated bright clusters and measure their mean 6 – 20 pixel magnitude. We use the encircled energy catalog found in Table 4 of Sirianni et al. (2005) for the aperture correction from 20 pixels to infinity. The final corrections were 0.63, 0.45, 0.42, and 0.54 mag for , , , and band filters respectively. We also correct the photometry in each filter for foreground extinction, 0.528, 0.441, 0.334, 0.264, and 0.183 mag for , , , H, and , respectively, taken from the NASA/IPAC Extragalactic Database.
We require photometry in all five H bands in order to accurately age-date star clusters. This has a minimal impact on our catalog and removes only a small fraction () of detected sources. We visually inspect all sources to remove cosmic rays and hot pixels from the catalog.
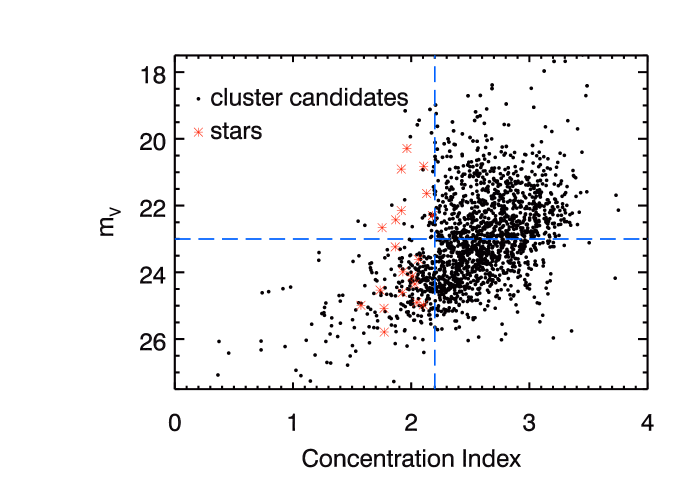
The low galactic latitude of NGC 3256 means that there will be a significant number of foreground stars from the Milky Way in our images. Luckily, at the distance of NGC 3256, we expect most clusters to be at least partially resolved in the HST/WFC images. We measure the concentration index, , to aid our separation of foreground stars and cluster candidates. For a single source, is measured as the difference in magnitude taken at two different apertures (typically done in the band at 0.5 and 3.0 pixels, which we use here). has proven to be a robust method in determining the compactness of an object and has therefore often been used to remove stellar contamination from cluster catalogs in many previous works (see Chandar et al. 2010 for a more in-depth discussion on ). Figure 2 shows versus for all cluster candidates (circles) and likely foreground stars (asterisks). All stars fall to the left of the vertical dashed line at . We therefore only include cluster candidates with .
We address incompleteness in our catalog by making a cut where the distribution begins to flatten at the faint end, rather than continue in a power law fashion. Because the central portion of NGC 3256 is dustier and has a higher background level than the outer regions, we use separate completeness limits for the inner and outer regions. Clusters in the inner region are complete down to , while the outer region is complete down to . The separation of these two regions is shown in Figure 1. We find that contamination from background galaxies is negligible in the main body of NGC 3256. In all, we find 505 cluster candidates that meet our selection criteria, and compile their properties in Table 1.
We briefly compare our catalog to that of G10, who studied clusters in the central portion of NGC 3256 using filters taken with the HRC (see Figure 1) and the band taken with the WFC from HST/ACS. Their final sample covered the central kpc2 and included 276 clusters after imposing various selection criteria on photometric uncertainty and on the goodness of fit to simple stellar population (SSP) models. The portion of NGC 3256 studied here extends the G10 coverage to include the northern spiral arm, as well as outside the central, brightest portion of the system (as shown in Figure 1). In addition, we include H observations in our analysis, which can be critical for breaking the degeneracy between age and extinction, a degeneracy that affects a number of clusters in this merging system (see Section 3.2 for more details). Our catalog includes more than of the sources that were found by G10, when both catalogs are matched in area and magnitude (). Conversely, G10 only find of the clusters in our catalog (again when matched in area and magnitude). Our study covers an area 3.5 times larger than that of G10, although we note a lack of clusters south of the main body.
3. Cluster Age and Mass Determination
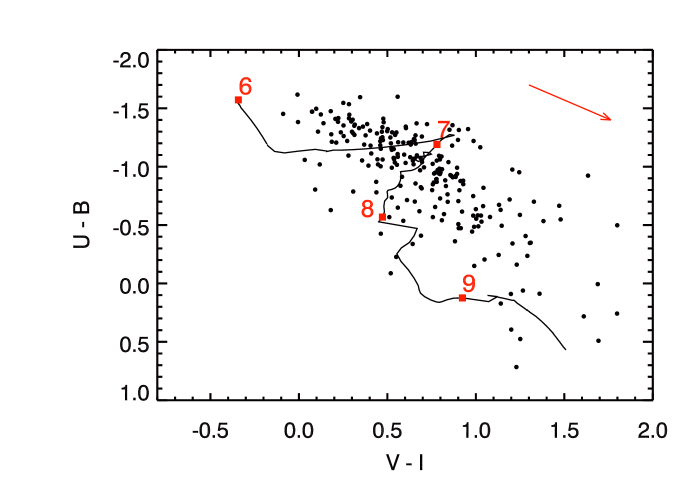
We present the color-color diagram for star clusters in NGC 3256 in Figure 3. The solid line is a stellar population model from G. Bruzual & S. Charlot (2006, private communication, hereafter BC06; and see also Bruzual & Charlot 2003) that predicts the evolution of star clusters from about – yr. All models assume a metallicity of Z = 0.02 (i.e., solar metallicity). Numbers mark the logarithmic age () corresponding to the population.
3.1. Spectral Energy Distribution (SED) Fitting
Using H photometry, we fit photometric SEDs of clusters to SEDs from cluster evolution tracks of BC06 in order to determine the age of each cluster. Reddening due to dust can yield inaccurate ages if not accounted for, because redder colors imply older ages. We therefore adopt the common technique of varying age and in order to minimize the function
| (1) |
Here, is the observed magnitude and has been corrected for both aperture and foreground extinction (see Section 2.2 for details), and the BC06 models () are normalized to each cluster’s apparent band magnitude. The function weights each photometric measurement in the fit by accounting for the photometric uncertainty () output by PHOT. We add 0.05 in quadrature to to ensure that no single measurement dominates the SED fit.
The BC06 model predicts a mass-to-light ratio (for the band luminosity) for each age, which we use to estimate a mass for each cluster. is calculated from each cluster’s magnitude (corrected for internal extinction) and the distance modulus of NGC 3256. The masses are computed using a Chabrier (2003) initial mass function.
3.2. Calibrating the H Filter
Broad-band colors alone make it difficult to differentiate clusters that are red because they are older from those that are young but appear redder due to the presence of dust. This is known as the age-extinction degeneracy. Including H photometry as a fifth point in the SED can help to break this degeneracy and has been used in a number of studies to age-date clusters (e.g., Fall, Chandar, & Whitmore 2005; Chandar et al. 2010). In this section we describe our method for calibrating the H filter in order to use it in the SED fitting method.
We first determine the zero point of the filter. We identify somewhat older star clusters, those that have only continuum emission from stars (i.e., no line emission from ionized gas). We estimate the age and extinction of each of these line-free clusters by performing the fit described in Section 3.1 using only the filters to predict a magnitude in the band. Comparison between the predicted and instrumental magnitudes gives a zero point of . We find that shifting the zero point by 0.1 alters the ages of only of the clusters by 0.3 in log().
Next, we assess whether or not we need to make an adjustment to the predictions for H line emission due to the escape of ionizing photons, as has been done in previous work on galaxies at closer distances (e.g., Fall, Chandar, & Whitmore 2005; Chandar et al. 2010). We compare the predicted and measured H maps for a subsample of hand-selected young clusters and find that, unlike for more nearby galaxies, no escape fraction is obviously needed.
In order to understand the impact that the escape fraction () has on the cluster age estimation, we run the H SED fitting with two values of ; we use the best fit of 0.25, as well as . We find that of clusters have a difference in age of log between age estimations from the two escape fractions, and adopt for simplicity due to its negligible impact on age estimates.
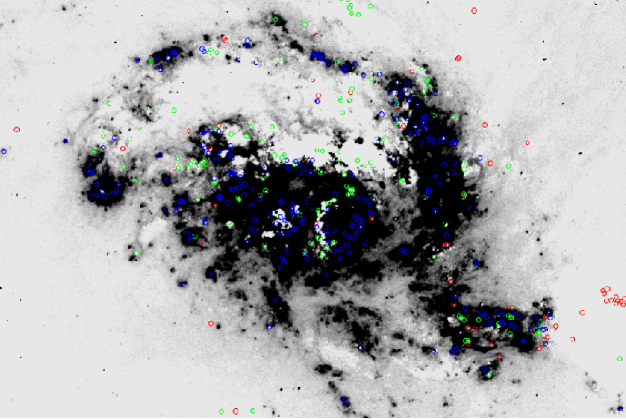
We test that cluster ages are reasonable by performing some simple checks. In most galaxies, it has been found that the brightest clusters tend to be young (we discuss the physical implications of this in Section 6.1; e.g., Whitmore et al. 1999). We test our sample by picking the brightest 15 clusters after correction for internal extinction and find that they are all younger than 10 Myr. In addition, Figure 4 shows a continuum-subtracted H map of NGC 3256, with clusters overlaid that are color-coded by age. Clusters younger than 10 Myr (blue circles) tend to clump together and follow the brightest H regions, while Myr old (green) and Myr old (red) old clusters are more sparse and fall on areas with no H emission.
4. RESULTS
4.1. Luminosity Function
We present the LFs for clusters in NGC 3256 in Figure 5. The LF is best described by a power law, , where is determined from a linear fit to log . The values have been aperture-corrected and corrected for foreground extinction in the Galaxy. The three panels of Figure 5 show the LF for the entire sample, as well as for clusters in the inner and outer regions of NGC 3256, separately. We find for the combined sample with . The LF for the inner and outer regions individually yielded in both cases. We also determine the power law index for the combined sample using and band magnitudes, and find and , respectively. These are consistent with the band result of , within the uncertainties.
Zepf et al. (1999) previously presented a catalog of clusters in NGC 3256 using poorer quality (in both depth and resolution) and band Wide Field Planetary Camera 2 images from HST. Using their cluster catalog to measure the band LF, we find , in agreement with the LF presented in this work. In addition, our value for is similar to that found in many other galaxies (Whitmore et al. 2014).
We also compare the LF found in this work to that of clusters in the eastern tidal tail of NGC 3256, as measured by Mulia, Chandar, & Whitmore (2015). They obtain , somewhat steeper than the LF in the main body, for clusters brighter than .
4.2. Age Distribution
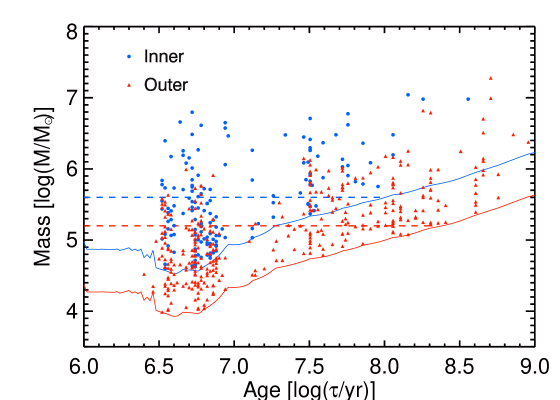
Figure 6 shows the mass-age relation, separated for clusters in the inner and outer regions. The solid lines show our brightness limits of ( for a distance modulus of 32.79) for the outer region and () for the inner region. The different completeness limits of the inner and outer regions result in different mass regimes in which the age distribution can be determined. The two dashed lines indicate the masses at which both samples are complete over the age ranges used in the age distribution (Figure 7). The inner cluster sample is complete to log( for log() , while the outer sample is complete to log( for log() . The apparent lack of clusters in the range log is an artifact of the SED fitting, partially due to the BC06 track forming a loop in color space.
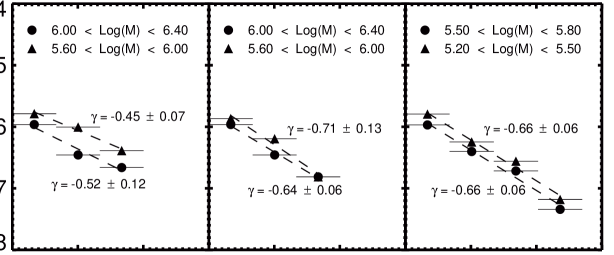
We find that the age distribution follows a power law with , with for two independent mass ranges in both the inner and outer regions. The combined catalog from both regions yields for both mass ranges; however, we note that the difference in completeness limits for the two catalogs results in a very low number of clusters for which the age distribution can properly be measured. The age distribution presented in Figure 5 of G10 for clusters in NGC 3256 shows a similar declining shape to that presented here.
Fall & Chandar (2012) find the cluster age distribution for multiple galaxies to be a power law with between and . While the slope of the age distribution fluctuates somewhat depending on how the fit is performed, this fluctuation agrees well with the fitting errors shown in Figure 7, as well as with the uncertainties listed in Fall & Chandar (2012). We conclude that for NGC 3256 is similar to the values obtained for the cluster populations in other galaxies, although several works find significantly flatter age distributions for clusters in some galaxies (e.g., Hwang & Lee 2010; Baumgardt et al. 2013; Silva-Villa et al. 2014), including recent work on M31 by the PHAT team (Fouesneau et al. 2014).
The age distribution is a combination of the formation and disruption histories of the clusters. The star formation histories (SFHs) are known independently in a number of galaxies and appear to be relatively constant at least to within a factor of two over the last few hundred million years (e.g., SMC – Harris & Zaritsky 2004; LMC – Harris & Zaritsky 2009). Unfortunately, to our knowledge, there is no published SFH for the merging, starbursting NGC 3256 system, either from direct observations or from high quality simulations. If the SFH of NGC 3256 has been constant to within a factor of a few over this timescale, as suggested by some simulations for the starbursting Antennae galaxies (Karl, Fall, & Naab 2011), as well as observational works on interacting galaxies (e.g., Knapen, Cisternas, & Querejeta 2015 and references therein), then the clusters in NGC 3256 would also have a disruption history similar to that found in these more quiescent galaxies.
4.3. Mass Function
We show the CMFs in Figure 8. These can be described by a power law, . We measure for three age ranges for clusters in the inner and outer areas of the galaxy, as well as for the combined sample. The given uncertainties only reflect the formal uncertainty in the fit; we discuss other sources of error in Section 4.3.1.
In the age range log, we find that the combined sample of inner and outer clusters yields . Separating the sample yields for outer clusters, but a shallower for inner clusters. The somewhat shallower slope is likely a result of crowding, which can artificially flatten the mass function. Studies of other galaxies have also found (e.g., Zhang & Fall 1999; Chandar, Fall, & Whitmore 2010; Chandar et al. 2010; Chandar, Fall, & Whitmore 2015). We note that G10 find for the same age range in NGC 3256, quite similar to our result.
We only determine the mass functions for older clusters in the outer region, since there are very few such clusters in the inner region. We find in the age range log. This age range is also the most difficult to fit, partially due to the loop in the BC06 track discussed in Section 4.2. Clusters with ages log produce a mass function with , where the large uncertainty in fitting is due to small-number statistics.
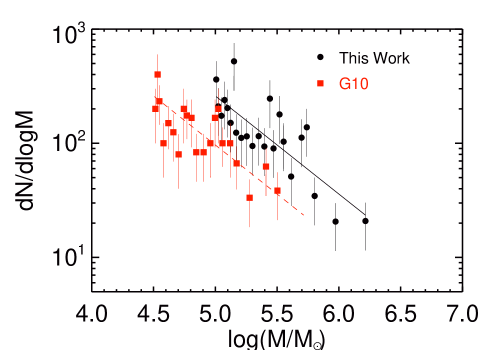
In Figure 9, we also show the mass function for NGC 3256 clusters younger than log( from the G10 sample. We find that their mass function shows an unexpected systematic offset toward lower masses. The offset is not due to differences in photometry, in SSP model assumptions, or in derived age or extinction values. When we put the G10 photometry through our age-dating procedure, no offset exists. The reason for the offset between the G10 cluster mass estimates and our own is unclear.
4.3.1 Uncertainties on
Several factors contribute to the uncertainty in the shape of the CMF. We mentioned some of these factors already in Section 3.2, such as the impact that small changes in the zero point and escape fraction for the H filter have on . In this section, we consider additional contributors to the uncertainties in .
Incompleteness can impact , causing it to become artificially shallow. This is especially true when considering for a very small age range, where brightness and mass are correlated, and a loss of faint clusters is equivalent to a loss of low-mass clusters. We discussed completeness of our catalog in Section 2.2, and we choose selection limits that are sufficiently bright that the impact of incompleteness is minimal.
Details of the fitting procedure can also affect . We find that the specific mass range used in the fits affects by less than about 0.05 for samples with 40 or more clusters, similar to most of the subsets quoted in this paper. We also measure the impact of bin size on and again find to fluctuate by . Overall we find that all of these sources of uncertainty affect within the formal uncertainty given in Figure 8 for each age range.
4.3.2 Is There an Upper Mass Cutoff?
Some works have found that mass functions for clusters in spiral galaxies deviate from a single power law and have a downturn at the high-mass end (e.g. Bastian et al. 2012). These works suggest that the mass function is better described by a Schechter function, exp(), where is the upper mass cutoff. While the lower-mass end of the Schechter function converges to a power law with index , the high-mass end drops off from a power law quickly above . In NGC 3256, we find that a single power law provides a good fit to the observed CMF, since no obvious downturn is observed at the high-mass end. Therefore, our distribution is only consistent with a Schechter function with a high (consistent with the suggestion that any would be expected to be higher than for this type of system; e.g., Kruijssen 2014). Below, we determine a lower limit to . For simplicity, we compare our CMFs for log and log to Schechter functions with a fixed and varying values, although there is no reason why has to be exactly . For the latter age range, we use only the sample taken from the outer region of the central galaxy due to low-number statistics.
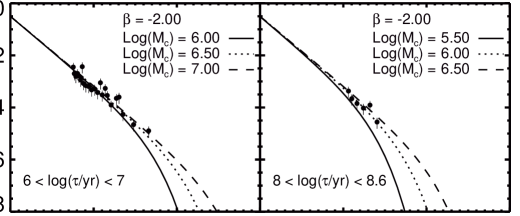
Using this approach, the mass function of clusters with ages log can only be reasonably fit for a Schechter function with log values above 6.5. Because the mass function is fit out to log, it is not surprising that Schechter functions with log begin to fall below the observed mass function at the high-mass end. The left panel of Figure 10 shows the mass function with multiple values.
Fitting the mass function for log with a Schechter function is indistinguishable from fitting a pure power law for log. This is shown in the right panel of Figure 10, where log and log provide reasonable fits to the mass function, as does a single power law. The mass function is fit out to log, and we find that the Schechter functions with log begin to fall below the observed mass function at the high end.
We find little evidence for a truncation of the mass function at the high end. We conclude that while both mass functions tested here can be fit with a Schechter function, it is not required and that a single power law provides an equally good fit to each. We therefore favor a pure power law in fitting the mass functions.
5. How Does Distance Affect the Observed Cluster Distributions?
The specific method used to select star clusters, particularly at ages Myr, may affect the results (e.g., Bastian et al. 2012). In addition, cluster selection in galaxies located at different distances will necessarily be limited by resolution since at least some sources will appear as diffuse stellar clusters in nearby galaxies but not in more distant ones.
At a distance of 36 Mpc, NGC 3256 is nearly twice as far as the Antennae, the nearest example of a pair of actively merging galaxies. In order to assess how distance might impact source selection, as well as the LFs, mass functions, and age distributions of cluster populations in NGC 3256, we use the well studied HST images of the Antennae, and compare the resulting cluster distributions when we simulate the entire system to lie a factor of two further away.
We download the Antennae data from HST/WFC , , and filters, as well as the WFC 3 filter from the HLA. The combined image for each filter is then boxcar-smoothed with a kernel width of two pixels. We run DAOFIND on both the original and degraded images, tuning only the FWHM parameter in both images, and we detect 8405 and 3173 objects, respectively. We refer to the cluster catalogs produced from the unaltered and degraded images as the “original” and “image-smoothed” catalogs, respectively. We perform aperture photometry on all detected sources and correct for foreground extinction. In addition, we measure and apply separate aperture corrections to each catalog.
Figure 11 shows a comparison of the original and image-smoothed images. The circles indicate detections from DAOFIND. It is evident that the image-smoothed source catalog is missing many of the very faint clusters in addition to some of the bright sources. We illustrate this in Figure 12, where the bottom panel shows the relative fraction of sources found in the image-smoothed catalog compared to the original catalog.333We do not restrict our sample to objects that appear to be spherically symmetric, as has been recommended to separate bound from unbound clusters (e.g., Gieles & Portegies Zwart 2011), since resolution makes this difficult at the distance of the Antennae and NGC 3256. We find that of the 3173 image-smoothed detections share coordinates (within one pixel) with their original image counterparts.
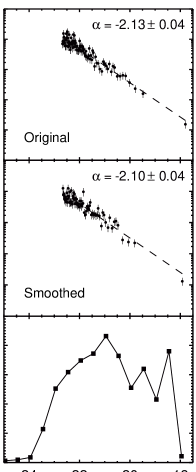
The top and middle panels of Figure 12 show the LFs for the original and image-smoothed cluster catalogs, respectively. Both LFs are fit for (), where the distribution begins to flatten out at the faint end. We find values for of for the clusters detected in the original image, very similar to those found in previous works. For the smoothed image sample we also find . A similar and more extensive study was performed by Randriamanakoto et al. (2013), where it was also determined that is not greatly impacted by resolution. They performed various convolutions on their image in order to simulate different galaxy distances, finding that differed by no more than 0.2.
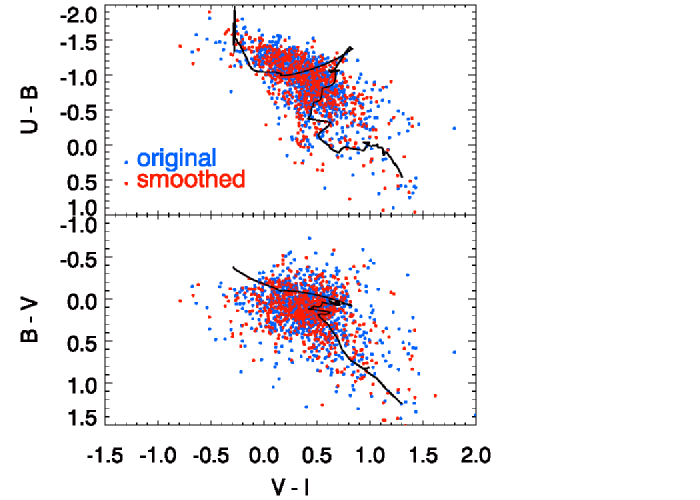
The color distributions of clusters brighter than from the original and smoothed images are quite similar. While there are more points from the original catalog present in Figure 13, the scatter in the colors among the two catalogs is roughly the same. We run SED fitting on both catalogs and construct their age distributions (not shown), finding in both cases.
We find that the LF, color distributions, and age distributions for the original and image-smoothed catalogs are nearly the same, and we therefore conclude that distance does not significantly hamper our ability to study clusters out to Mpc.
6. How Efficiently Does NGC 3256 Form Clusters?
Many previous works have suggested that galaxies with a high SFR per unit area () form clusters more efficiently than galaxies with lower (e.g., G10; Kruijssen 2012; Kruijssen & Bastian 2016). Two independent observational methods have been developed to test this: the CMF/SFR statistic (Chandar, Fall, & Whitmore 2015; hereafter CFW15) and , the fraction of stars formed in bound clusters (Bastian et al. 2008). A third, less direct method, , has also been used (Larsen & Richtler 2000). In this work, we focus on the first two methods, because they are easier to interpret. In this section, we apply both methods to our cluster sample in NGC 3256, and compare the results with those from previous works and for different galaxies.
6.1. CMF/SFR Statistic
CFW15 compared the CMFs between several different galaxies by normalizing them by the SFR of the host galaxy, and comparing the amplitudes of the resulting CMF/SFR statistic. The sample included spirals (M83 and M51), irregulars and starbursts (Large and Small Magellanic Clouds, NGC 4214, and NGC 4449), and the merging Antennae galaxies. The large range of amplitudes for the CMFs in two different ranges of age (log and log) in these galaxies collapse when divided by their respective SFRs. The dispersion in the CMF/SFR statistic is only , similar to the expected uncertainties. Since the CMF/SFR statistic of very young clusters is similar across these different galaxies, CFW15 concluded that cluster formation scales with the overall SFR on galaxy scales. The similarity of the CMF/SFR statistic for the older clusters suggests that the disruption histories are also similar across the galaxies.
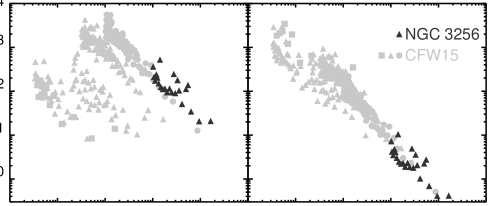
Here, we determine the CMF/SFR statistic for NGC 3256 for the first time and compare with the rest of the galaxies in the CFW15 sample. The mass functions discussed in Section 4.3 were shown to follow a power law with index . In the left panel of Figure 14, we show the unnormalized CMFs for the same seven galaxies shown in CFW15 and now also include NGC 3256. The CMF for NGC 3256 is higher than that of the other galaxies, including the Antennae. The right panel of Figure 14 presents the CMF/SFR statistic for NGC 3256 and shows that it is similar to that of the other seven galaxies. We measure the CMF/SFR statistic only for clusters younger than log, because our NGC 3256 sample does not contain a significant number of clusters older than this.
The uncertainties in the CMF/SFR statistic can be separated into uncertainties in the CMF and in the SFR value. Here we focus on the latter and refer the reader to Section 4.3.1, where we discussed uncertainties regarding the mass function. We adopt a total SFR of 50 yr-1 for NGC 3256 (Sakamoto et al. 2014), which was calculated from the bolometric infrared luminosity. This SFR is quite similar to the value of 46 yr-1 calculated from the total infrared luminosity and adopted in G10 for the SFR. We find other modern calculations of the SFR in NGC 3256 in a similar range, with a high value of 85 yr-1 using infrared luminosity (Rodríguez-Zaurín et al. 2011). These values are consistent with an accuracy to within a factor of about two for the SFR, as found by several previous works (e.g., Lee et al. 2009; CFW15).
While our full area of coverage is kpc2, the clusters fall within an area of kpc2, comparable to that used for the SFR determinations mentioned above. While it is important that the same area of the galaxy be used for determining both the CMF and the SFR (as done in CFW15), this has not always been done. A number of studies have compared cluster properties with the SFR density of the host galaxy, but with the latter determined for a different area than for the clusters. For NGC 3256, G10 assumed a star-forming area of kpc2 (taken from the literature), but the actual area covered by their cluster catalog is only kpc2 (see Section 2.2 and Figure 1). We estimate the uncertainty in previously published values of the star-forming area to be approximately a factor of two for NGC 3256. This is on top of the uncertainty in the SFR itself.
CFW15 quantify the scatter in the CMF/SFR statistic among galaxies by fitting each galaxy by
| (2) |
and find the scatter in the normalization coefficient to be log . When NGC 3256 is added as an eighth galaxy, we find log .
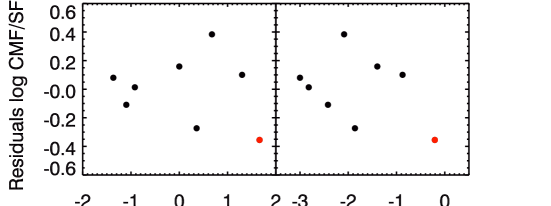
If the formation of clusters is affected by the overall SFR or of their host galaxy, we should see a correlation of these properties with the residuals of log . In Figure 15, we plot the residuals of log for each galaxy versus the SFR and . We take values for all galaxies (including NGC 3256), but not the Antennae, from the recent compilation made by Adamo et al. (2015). The result for NGC 3256 is shown in red. The left panel is similar to the upper-left panel of Figure 4 in CFW15, who did not show the residuals with respect to . No obvious trend in the residuals is observed with either the SFR or with . The nonparametric Spearman correlation coefficient, , and the corresponding probability confirm this visual impression. We find of -0.07 and of 0.87 for log versus SFR and of -0.24 and of 0.57 for log versus . These values should be less than 0.05 to have a greater than 95% confidence of there being a correlation. Therefore, there is no statistically significant correlation between the residuals in log and SFR and for these eight galaxies.
Our results for NGC 3256, when added to those for the seven galaxies presented in CFW15, are consistent with the hypothesis that the formation rates of stars and clusters are similar across star-forming galaxies that span a large range (approximately three orders of magnitude) in SFR and . Our results for the age distribution in NGC 3256, which also shows a declining shape similar to that in the other more quiescent galaxies, suggest that the disruption history may also be the same, although this conclusion depends on the (currently unknown) SFH of the system. The cluster population models presented in Whitmore, Chandar, & Fall (2007) indicate that for cluster disruption that is mostly independent of mass, the youngest clusters are the brightest. This is consistent with our findings for NGC 3256 in Section 3.2.
6.2. The Statistic
A second, similar statistic that has been widely used in the literature is , defined as the mass formed in bound clusters divided by the total stellar mass. The total mass in clusters, within a given age range, is typically found by extrapolating the observed CMF down to a mass of 100 . This extrapolation is accomplished either by assuming a power law or Schechter function, or by using a simulated cluster population. has been estimated for a number of galaxies and is typically plotted against of the host galaxy. Previously, both observational and theoretical works have suggested that there is a strong correlation between and (and and ), such that the higher the of a galaxy, the higher the fraction of stars formed in bound clusters. Since estimates of and SFR correlate strongly for the specific galaxies studied thus far, there should be a similarly strong correlation between and SFR. If confirmed, this result would differ from the result of CFW15 who found little variation from galaxy to galaxy for CMF/SFR.
G10 estimated for NGC 3256, and found . This was calculated from the CFR divided by the SFR, and it included only clusters with log(. We summarize their method below, and refer the reader to G10 for details. G10 found the total mass in clusters above a cutoff of log and used a synthetic cluster population to find the fraction of mass contained in clusters that is below this cutoff, assuming a power law mass function with slope . They obtained the CFR by dividing their total mass in clusters by 7 Myr, rather than 10 Myr, due to the expectation that the clusters are embedded for the first 3 Myr and hence are missing from the sample. They divided the CFR by the SFR and obtained . They made three additional corrections, each increasing by %, giving a final value of . G10 made these corrections in order to account for: (1) their rejection of clusters with poor fits and photometry, (2) a range of metallicities for young clusters in NGC 3256, which G10 found would increase the total cluster mass relative to their assumptions, and (3) an underestimate in actual cluster masses relative to derived masses.
We follow the G10 method, for the most part, to estimate from our larger cluster catalog in NGC 3256. We find the total mass in clusters above log and younger than 10 Myr to be . We use a similar synthetic cluster population as G10 to calculate the fraction of mass contained in clusters for . We arrive at a CFR of 16.7 yr-1 by dividing by 7 Myr, and we calculate CFR/SFR , when we assume an SFR of 50 yr-1. We do not make the three 25% corrections in our determination of , because our procedure does not result in the rejection of clusters with poor fits, we do not find any direct information on the metallicity distribution of young clusters in NGC 3256, and we are using different SSP models that, as far as we know, do not systematically underestimate cluster masses. Our value of 0.33 is times higher than the value of 0.12 obtained by G10 before they make the additional corrections described above. This factor is the same as the relative offset in the masses that we found in Section 4.3. Our results suggest that is fairly robust when the same set of assumptions are used.
Ideally, should be determined using the same set of assumptions for all galaxies. However, this is not the current state of estimates in the literature, where different sets of assumptions have been used for different galaxies. For completeness, in Table 2, we compile different estimates of for NGC 3256 using different sets of assumptions. Here, column 4 shows our ‘best’ estimates of , while column 5 includes the three 25% corrections used by G10 (labeled as ). We find that one of the biggest sources of uncertainty is the exact value used for the power law index of the CMF, . G10 and other works have found that has typical uncertainties of the order of . However, changes at this level have a strong impact and change the derived value of by a factor of nearly four. is also sensitive to both the lower and upper mass ranges assumed in the extrapolation. If , then each decade in mass adds an equal percentage of total mass. For example, extrapolating down to a lower mass cutoff of, say, rather than would increase the fraction of by . The estimates of vary from 0.09 to 0.98 (i.e., a factor of approximately 10!), depending on the specific choice of parameters. If we apply the same three 25% corrections as used by G10, we find a range between 0.18 and 1.91, i.e. the estimates go higher than 100%.
As also found by G10, the exact value of is quite sensitive to the specific assumptions and extrapolations that are made. Because a variety of assumptions have been made for determinations of in different galaxies (which we will address in a forthcoming paper), and because this method requires more assumptions than the CMF/SFR statistic, the current determinations have larger uncertainties, which may make it more difficult to compare results between galaxies.
7. SUMMARY AND CONCLUSIONS
We have used ACS/WFC from HST to measure the properties of star clusters in the main body of NGC 3256. We draw the following conclusions.
-
1.
The LF follows a power law with index where for the sample combining inner (with ) and outer (with ) regions of NGC 3256. Measuring for the inner and outer regions separately yielded . These values agree with previous work.
-
2.
We found that the age distribution can be described by a power law with index for independent mass ranges and for catalogs from the inner and outer areas of the galaxy separately. These values can be interpreted as a destruction rate of each decade in time and are consistent with typical values of found in other systems.
-
3.
The mass functions in various cluster age ranges are well described by a power law with index . Young (log) clusters follow a robust . We found that log clusters are better described by , while log clusters follow . We investigated a number of sources of uncertainty in and found that uncertainties agree with the formal uncertainties given in Figure 8.
-
4.
In order to test for the effect that image resolution can have on cluster properties, we artificially degraded an image of the Antennae and created independent catalogs from the degraded and original images. While less than half of the image-smoothed sources were detected in the original image, the LFs, color distributions, and age distributions produced from both catalogs were very similar. We conclude that reliable measurement of the ages and luminosities of star clusters is not significantly hampered by the distance to NGC 3256.
-
5.
We considered two different methods that measure the efficiency with which clusters form in a galaxy. The CMF/SFR statistic was measured for eight galaxies, including NGC 3256, and had a dispersion of (log . We measured and found a value of from clusters younger than 10 Myr, and we discussed the different parameters and assumptions that affect this method.
We thank the referee for helpful comments. R.C. is grateful for support from NSF through CAREER award 0847467. This work is based on observations made with the NASA/ESA Hubble Space Telescope, and obtained from the Hubble Legacy Archive, which is a collaboration between the Space Telescope Science Institute (STScI/NASA), the Space Telescope European Coordinating Facility (ST-ECF/ESA) and the Canadian Astronomy Data Centre (CADC/NRC/CSA). This work was supported in part by NASA through grant GO-9735-01 from the Space Telescope Science Institute, which is operated by AURA, INC, under NASA contract NAS5-26555. This research has made use of the NASA/IPAC Extragalactic Database, which is operated by the Jet Propulsion Laboratory, California Institute of Technology, under contract with NASA.
References
- (1) Adamo, A., Kruijssen, J. M. D., Bastian, N., Silva-Villa, E., & Ryon, J. 2015, MNRAS, 452, 246
- (2) Adamo, A., Östlin, G., & Zackrisson, E. 2011, MNRAS, 417, 1904
- (3) Bastian, N. 2008, MNRAS, 390, 759
- (4) Bastian, N., Adamo, A., Gieles, M., et al. 2012, MNRAS, 419, 2606
- (5) Baumgardt, H., Parmentier, G., Anders, P., & Grebel, E. K. 2013, MNRAS, 430, 676
- (6) Bruzual, G. & Charlot, S. 2003, MNRAS, 344, 1000
- (7) Chabrier, G. 2003, PASP, 115, 763
- (8) Chandar, R., Fall, S. M., & Whitmore, B. C. 2010, ApJ, 711, 1263
- (9) Chandar, R., Fall, S. M., & Whitmore, B. C. 2015, ApJ, 810, 1 (CFW15)
- (10) Chandar, R., Whitmore, B. C., Kim, H., et al. 2010, ApJ, 719, 966
- (11) Cook, D. O., Seth, A. C., Dale, D. A., et al. 2012, ApJ, 751, 100
- (12) Fall, S. M. & Chandar, R. 2012, ApJ, 752, 96
- (13) Fall, S. M., Chandar, R., & Whitmore, B. C. 2005, ApJ, 631, 133
- (14) Fouesneau, M., Johnson, L. C., Weisz, D. R., et al. 2014, ApJ, 786, 117
- (15) Gieles, M. & Portegies Zwart, S. F. 2011, MNRAS, 410, 6
- (16) Goddard, Q. E., Bastian, N., & Kennicutt, R. C. 2010, MNRAS, 405, 857 (G10)
- (17) Harris, J. & Zaritsky, D. 2004, AJ, 127, 1531
- (18) Harris, J. & Zaritsky, D. 2009, AJ, 138, 1243
- (19) Hwang, N. & Lee, M. G. 2010, ApJ, 709, 411
- (20) Karl, S. J., Fall, S. M., & Naab T. 2011, ApJ, 734, 11
- (21) Knapen, J. H., Cisternas, M., & Querejeta, M. 2015, 454, 1742
- (22) Knierman, K. A., Gallagher, S. C., Charlton, J. C. et al. 2003, AJ, 126, 1227
- (23) Kruijssen, J. M. D. 2012, MNRAS, 426, 3008
- (24) Kruijssen, J. M. D. 2014, CQGra, 31, 4006
- (25) Kruijssen, J. M. D. & Bastian, N. 2016, MNRAS, 457, 24
- (26) Larsen, S. S. & Richtler, T. 2000, A&A, 354, 836
- (27) Lee, J. C., Gil de Paz, A., Tremonti, C., et al. 2009, ApJ, 706, 599
- (28) Maybhate, A., Masiero, J., Hibbard, J. E. et al. 2007, MNRAS, 381, 59
- (29) Mulia, A. J., Chandar, R., & Whitmore, B. C. 2015, ApJ, 805, 99
- (30) Randriamanakoto, Z., Väisänen, P., Ryder, S., Kankare, E., Kotilainen, J., & Mattila, S. 2013, MNRAS, 431, 554
- (31) Rodríguez-Zaurín, J., Arribas, S. Monreal-Ibero, A., Colina, L., Alonso-Herrero, A., & Alfonso-Garzón, J. 2011, A&A, 527, 60
- (32) Sakamoto, K., Aalto, S., Combes, F., Evans, A., & Peck, A. 2014, ApJ, 797, 90
- (33) Silva-Villa, E., Adamo, A., Bastian, N., Fouesneau, M., Zackrisson, E. 2014, MNRAS, 440,116
- (34) Silva-Villa, E., Larsen, S. S. 2011, A&A, 529, 25
- (35) Sirianni, M., Jee, M. J., Benìtez, N., et al. 2005, PASP, 117, 1049
- (36) Trancho, G., Bastian, N., Miller, B. W., & Schweizer, F. 2007b, ApJ, 664, 284
- (37) Trancho, G., Bastian, N., Schweizer, F., & Miller, B. W. 2007a, ApJ, 658, 993
- (38) Whitmore, B. C., Chandar, R., Bowers, A. S. et al. 2014, AJ, 147, 78
- (39) Whitmore, B. C., Chandar, R., Fall, S. M. 2007, AJ, 133, 1067
- (40) Whitmore, B. C., Zhang, Q., Leitherer, C., Fall, S. M., Schweizer, F., & Miller, B. W. 1999, AJ, 118, 1551
- (41) Zepf, S. E., Ashman, K. M., English, J., Freeman, K. C., & Sharples, R. M. 1999, AJ, 118, 752
- (42) Zhang, Q. & Fall, S. M. 1999, ApJ, 527, 81


| ID | R.A. | Decl. | |||||||||||||
|---|---|---|---|---|---|---|---|---|---|---|---|---|---|---|---|
| 1 | 10 27 52.352 | -43 54 33.30 | 22.87 | 0.08 | 23.12 | 0.02 | 22.81 | 0.01 | 25.45 | 0.04 | 22.36 | 0.02 | 5.25 | 8.31 | 0.00 |
| 2 | 10 27 52.377 | -43 54 32.71 | 23.16 | 0.11 | 23.13 | 0.02 | 22.90 | 0.01 | 25.54 | 0.05 | 22.30 | 0.02 | 5.25 | 8.41 | 0.00 |
| 3 | 10 27 49.477 | -43 54 31.89 | 20.70 | 0.02 | 22.15 | 0.03 | 22.25 | 0.03 | 25.29 | 0.11 | 22.07 | 0.04 | 4.35 | 6.82 | 0.00 |
| 4 | 10 27 49.490 | -43 54 31.77 | 20.58 | 0.03 | 21.81 | 0.04 | 21.79 | 0.03 | 24.75 | 0.09 | 21.56 | 0.04 | 4.56 | 6.84 | 0.00 |
| 5 | 10 27 49.626 | -43 54 31.75 | 21.25 | 0.03 | 22.73 | 0.03 | 22.65 | 0.03 | 24.01 | 0.06 | 22.34 | 0.04 | 4.16 | 6.74 | 0.04 |
| 6 | 10 27 49.491 | -43 54 31.44 | 19.40 | 0.01 | 20.81 | 0.02 | 20.87 | 0.02 | 23.89 | 0.04 | 20.58 | 0.02 | 4.93 | 6.84 | 0.00 |
| 7 | 10 27 49.724 | -43 54 31.12 | 20.52 | 0.02 | 21.61 | 0.01 | 21.38 | 0.01 | 23.06 | 0.07 | 20.82 | 0.02 | 4.89 | 6.76 | 0.22 |
| 8 | 10 27 49.723 | -43 54 31.00 | 20.33 | 0.01 | 21.53 | 0.02 | 21.35 | 0.02 | 23.24 | 0.11 | 20.76 | 0.02 | 4.95 | 6.86 | 0.14 |
| 9 | 10 27 50.821 | -43 54 29.85 | 22.08 | 0.05 | 22.92 | 0.02 | 22.55 | 0.02 | 24.67 | 0.10 | 21.90 | 0.03 | 5.25 | 7.76 | 0.16 |
| 10 | 10 27 50.805 | -43 54 29.81 | 22.70 | 0.10 | 23.37 | 0.05 | 22.75 | 0.04 | 25.47 | 0.33 | 21.97 | 0.05 | 5.46 | 8.01 | 0.28 |
| SFR ( yr-1) | (Myr) | |||
|---|---|---|---|---|
| -1.8 | 46 | 7 | 0.24 | 0.47 |
| -1.8 | 46 | 10 | 0.17 | 0.33 |
| -1.8 | 50 | 7 | 0.22 | 0.43 |
| -1.8 | 50 | 10 | 0.15 | 0.30 |
| -1.8 | 85 | 7 | 0.13 | 0.25 |
| -1.8 | 85 | 10 | 0.09 | 0.18 |
| -2.0 | 46 | 7 | 0.36 | 0.71 |
| -2.0 | 46 | 10 | 0.25 | 0.50 |
| -2.0 | 50 | 7 | 0.33 | 0.65 |
| -2.0 | 50 | 10 | 0.23 | 0.46 |
| -2.0 | 85 | 7 | 0.20 | 0.38 |
| -2.0 | 85 | 10 | 0.14 | 0.27 |
| -2.2 | 46 | 7 | 0.98 | 1.91 |
| -2.2 | 46 | 10 | 0.68 | 1.33 |
| -2.2 | 50 | 7 | 0.90 | 1.75 |
| -2.2 | 50 | 10 | 0.63 | 1.23 |
| -2.2 | 85 | 7 | 0.53 | 1.03 |
| -2.2 | 85 | 10 | 0.37 | 0.72 |