Geoneutrinos and reactor antineutrinos at SNO+
Abstract
In the heart of the Creighton Mine near Sudbury (Canada), the SNO+ detector is foreseen to observe almost in equal proportion electron antineutrinos produced by U and Th in the Earth and by nuclear reactors. SNO+ will be the first long baseline experiment to measure a reactor signal dominated by CANDU cores (55% of the total reactor signal), which generally burn natural uranium. Approximately 18% of the total geoneutrino signal is generated by the U and Th present in the rocks of the Huronian Supergroup-Sudbury Basin: the 60% uncertainty on the signal produced by this lithologic unit plays a crucial role on the discrimination power on the mantle signal as well as on the geoneutrino spectral shape reconstruction, which can in principle provide a direct measurement of the Th/U ratio in the Earth.
1 Introduction
Designed as a retrofit of the former Sudbury Neutrino Observatory (SNO) at SNOLAB, SNO+ is a multipurpose kiloton-scale liquid scintillation detector aimed at performing low energy neutrino physics measurements. Thanks to an overburden of 6 km water equivalent and to a very low background, the SNO+ detector can reach several physics goals, including the observation of electron antineutrinos produced by the Earth and by nuclear reactors via the Inverse Beta Decay (IBD) reaction chen_2006 .
Geoneutrinos produced in beta minus decays along the 238U and 232Th decay chains provide an exceptional insight into the Earth’s interior, allowing for the determination of the heat-producing element abundances and hence of the total radiogenic heat power of the planet. The SNO+ detector is located in the Superior Province (Ontario, Canada), one of the Earth’s largest Archean’s cratons, characterized by a thick ( 42 km) continental crust, which gives rise to a sizable geoneutrino crustal signal rate huang_2014 . In this framework, nuclear reactors are the most severe source of background as there is a significant overlap between the reactor antineutrino energy spectrum and the geoneutrino one at low energies. The Bruce, Pickering and Darlington power stations, which are respectively 240 km, 340 km and 350 km far from the SNO+ site, host globally 18 operating cores for a total thermal power of approximately 43 GW baldoncini_2015 .
The primary aim of this study is predicting the expected geoneutrino and reactor signals at SNO+ on the basis of existing reference Earth and reactor models. Since these predictions are affected by some degree of uncertainties, the purpose is to highlight priorities for future refinements.
2 Geoneutrinos
The prediction of the geoneutrino signal at SNO+ is based on the modeling of the distribution and amount of U and Th in the Earth’s reservoirs. The continental crust, despite accounting for approximately 0.5% of the Earth’s mass, is the main reservoir of U and Th and generates 75% of the total geoneutrino signal expected at SNO+ huang_2013 . For this reason a deep understanding of the continental crust, in particular the region immediately surrounding the detector, is mandatory to evaluate the geoneutrino signal and its uncertainties. These studies can be performed both via 3D geochemical and geophysical crustal models huang_2014 and via heat balance models based on the combination of the Moho heat flux and of the crustal heat production phaneuf_2014 .
The local crust of SNO+, i.e. six 2⊙ 2⊙ tiles centered at the detector location, is modeled in huang_2014 and is based on integrating regional geological, geophysical, and geochemical data. The geoneutrino signal from the local crust is predicted to be 15.6 TNU. A detailed analysis of the geoneutrino signal contribution from the different lithologic units of the local crust reveals that the Huronian Supergroup-Sudbury Basin (HS-SB), with a signal of 7.3 TNU, is the major source of signal as well as of uncertainty concerning the local contribution to the expected geoneutrino signal. The 1 range (4.3 - 12.3 TNU) of the geoneutrino signal produced by the HS-SB is comparable with the full range of the expected mantle signal (2 - 19 TNU) fiorentini_2012 ; sramek_2013 . With the perspective of inferring the mantle geoneutrino signal by subtracting the estimated crustal contribution to the total fiorentini_2012 , improving the HS-SB modeling is mandatory.
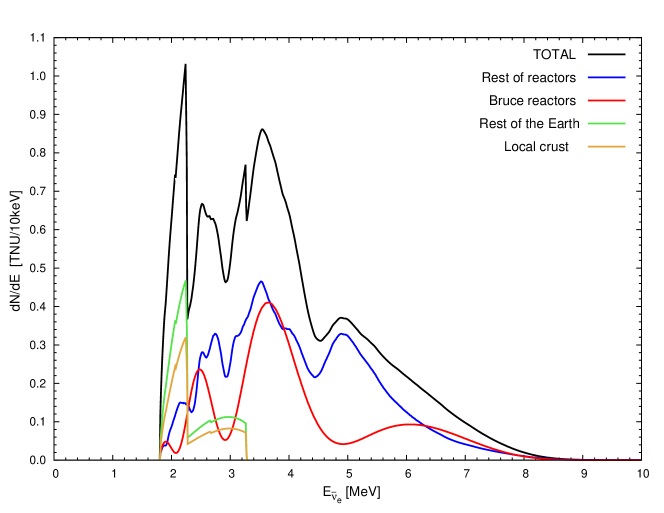
In Fig.2 we report the geoneutrino spectrum subdivided into two components, generated by the U and Th in the local crust and in the rest of the Earth. We took into account the antineutrino survival probability adopting the oscillation parameters reported in huang_2014 . In Table 1 we summarize the four main geoneutrino signal components at SNO+, corresponding to the local crust, rest of the crust, continental litospheric mantle and mantle contributions.
| Geoneutrinos | Reactor antineutrinos | |||
| LER [TNU] | LER [TNU] | FER [TNU] \bigstrut[t] | ||
| Local crust | 15.6 | Bruce reactors | 17.3 | 73.7 \bigstrut[t] |
| Rest of the crust | 15.1 | Rest of reactors | 31.2 | 118.9 \bigstrut[t] |
| Continental litoshperic mantle | 2.1 | \bigstrut[t] | ||
| Mantle | 9 | \bigstrut[t] | ||
| TOTAL | 40 | TOTAL | 48.5 | 192.6 \bigstrut[t] |
3 Conclusions and perspectives
As the antineutrino signal in the LER at SNO+ is expected to be generated by nuclear reactors and by the Earth in a ratio of 1.2, a detailed characterization of both the geoneutrino and the reactor antineutrino sources is compulsory in terms of both absolute values and uncertainties.
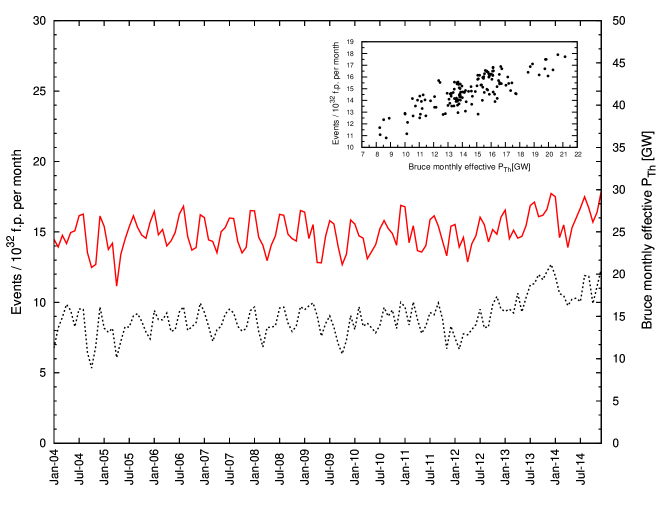
A multitemporal analysis of the expected reactor signal at SNO+ over a time lapse of 10 years (January 2004 – December 2014) reveals that the monthly signal fluctuations associated to different reactors operational condition are on the order of 10% at 1 level. The 18 operating CANDU reactors belonging to the Bruce, Pickering and Darlington power stations generate approximately 55% of the total reactor signal in the LER at SNO+. For this reason, an accurate profile of the CANDU fissile isotope inventory over the entire duty cycle is mandatory for the SNO+ experiment.
The HS-SB is the strongest geoneutrino source among the local crust reservoirs and it is predicted to produce 7.3 TNU with respect to a total geoneutrino signal of 40 TNU. The compositional heterogeneity of this lithologic unit, which is due to the presence of a mixture of Paleoproterozoic sedimentary, metasedimentary and igneous rocks of the Canadian Shield, affects the geoneutrino signal uncertainty on the order of 60%. Therefore, a systematic sampling of the main lithologies of the HS-SB is highly recommended for improving the knowledge of the U and Th content of the unit and to put more stringent constraints on the local contribution to the geoneutrino signal at SNO+.
References
- (1) Chen M. C. 2006 Earth Moon Planet 99 221–228
- (2) Huang Y, Strati V, Mantovani F, Shirey S B and McDonough W F, 2014 Geochemistry, Geophysics Geosystems 15 3925–3944
- (3) Baldoncini M, Callegari I, Fiorentini G, Mantovani F, Ricci B, Strati V and Xhixha G, 2015 Phys. Rev. D 91 065002
- (4) Bain A, Boyd F and Critoph E ,1997 Canada enters the nuclear age: a technical history of Atomic Energy of Canada limited as seen from its research laboratories (Canada: McGill- Queen’s University Press)
- (5) Nichols A, Aldama D and Verpelli M, 2008 IAEA INDC (NDS)-0534
- (6) Andringa S et al. (SNO+ Collaboration), 2015 arXiv:1508.05759 [hep-ex, physics:physics]
- (7) Huang Y, Chubakov V, Mantovani F, Rudnick R L and McDonough W F, 2013 Geochem. Geophys. Geosyst. 14 2003–2029
- (8) Phaneuf C and Mareschal J C, 2014 Tectonophysics 622 135–144
- (9) Fiorentini G, Fogli G L, Lisi E, Mantovani F and Rotunno A M, 2012 Physical Review D 86
- (10) Sramek O, McDonough W F, Kite E S, Leki ̵́c V, Dye S T and Zhong S, 2013 Earth and Planetary Science Letters 361 356–366