Triangulum galaxy viewed by Planck
We used Planck data to study the M33 galaxy and find a substantial temperature asymmetry with respect to its minor axis projected onto the sky plane. This temperature asymmetry correlates well with the HI velocity field at 21 cm, at least within a galactocentric distance of , and it is found to extend up to about from the galaxy center. We conclude that the revealed effect, that is, the temperature asymmetry and its extension, implies that we detected the differential rotation of the M33 galaxy and of its extended baryonic halo.
Key Words.:
Galaxies: general – Galaxies: individual (M33) – Galaxies: halos1 Introduction
A temperature asymmetry has been detected in Planck data toward the M31, Cen A, and M82 galaxies, always aligned with respect to the expected galaxy spin (De Paolis et al. 2011, 2014, 2015; Gurzadyan et al. 2010). The aim of this paper is to investigate whether the same phenomenon also occurs for M33 (also known as the Triangulum galaxy), which is an appropriate object on which to test our method, and on which we can trace the dynamics of the baryonic galactic halo (which at large scales also has to reflect the dark matter contribution) in a model-independent way because it is sufficiently extended and useful multi-wavelength observations are available.
M33 (or NGC 598) is the nearest late-type spiral galaxy that lies at a distance of only about 840 kpc (Magrini et al., 2007; Gieren et al., 2013). It is the third largest member (after M31 and the Milky Way) of the Local Group (see Rauzy & Gurzadyan 1998 for the dynamics and substructure of the Local Group), and the coordinates of its center are RA and Dec . It is classified as an SAcd galaxy, that is, a late-type spiral with a weak bar (Corbelli & Walterbos 2007), no clear evidence of any bulge component (see, e.g., Bothan 1992), and relatively loosely wound arms (Buta et al., 2007). At the M33 distance corresponds to 244 pc ( kpc), which allows us to study this galaxy with a great degree of accuracy. The relatively small inclination angle (van den Bergh, 2000) allows us to obtain a comprehensive view of the M33 galaxy, which is a key advantage, for example, for studying the correlation of the velocity field with the galaxy geometry. For a recent and comprehensive review about M33 we refer to Hodge (2012).
The M33 disk is rotating with a maximum circular velocity of about km s-1 and has a rising profile (see, e.g., Corbelli & Salucci 2000; Corbelli et al. 2014; Kam et al. 2015), indicating that the outer regions of the galaxy possess substantial mass. The observations at wavelength of 21 cm show the detailed spatial and kinematic structure of the neutral hydrogen in M33, which extends farther out than the stellar component. Interestingly, at least of the HI gas is found beyond the star-forming disk. There is some evidence of a faint halo component (McConnachie et al. 2010; Cockcroft et al. 2013) that was previously undetected (see, e.g., Trinchieri et al. 1988; Barker et al. 2007). The study in the microwaves of the M33 disk and halo within is the aim of the following sections, particularly with the aim of investigating their rotation.
2 Planck data analysis and results
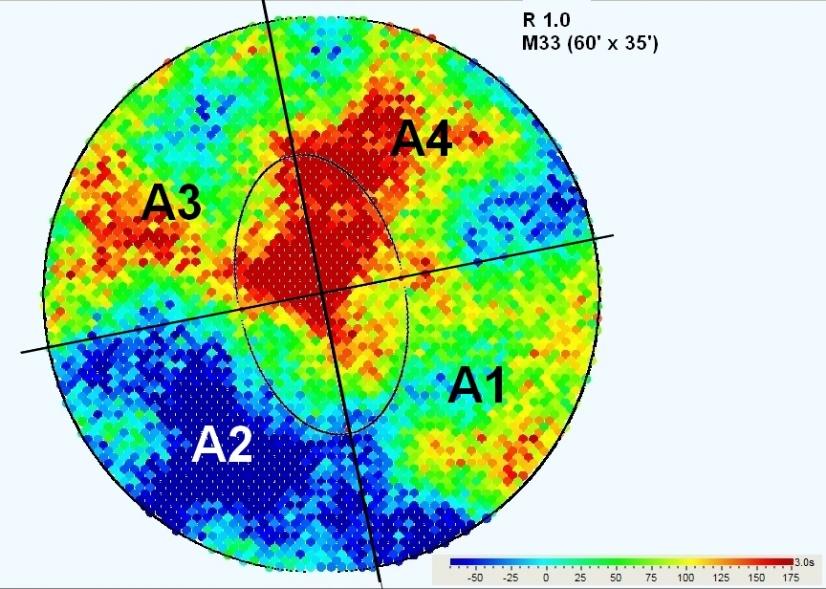
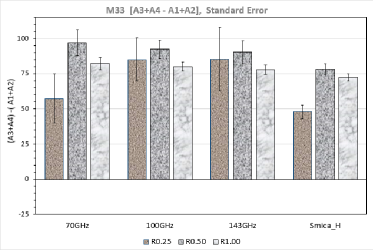
We used data of Planck 2015 release (Planck Collaboration I, 2015) in the bands at 70 GHz of the Low Frequency Instrument (LFI), and in the bands at 100 and 143 GHz of the High Frequency Instrument (HFI) with angular resolution of , , and in terms of FHWM, respectively. The frequency maps are provided in cosmic microwave background (CMB) temperature at resolution corresponding to =2048 in HEALPix scheme (Górski et al., 2005; Planck Collaboration XVI, 2015). To begin, the considered region of the sky (shown in Fig. 1 in the Planck band at 70 GHz) toward the M33 galaxy was divided into four quadrants indicated as A1, A2, A3, and A4. The optical extension of M33 of (Berkhuijsen 1983) is also shown in the same figure. The mean temperature excess in K (i.e., the average pixel temperature excess with respect to the mean CMB temperature) in each of the indicated regions was obtained in the Planck bands at 70, 100, and 143 GHz with the corresponding standard error. The standard error has been calculated as the standard deviation of the excess temperature distribution divided by the square root of the pixel number in each region. We have verified that within the errors, the sigma values calculated in this way are consistent with those evaluated by using the covariance matrix obtained by a best-fitting procedure with a Gaussian to the same distribution. The obtained results are presented in the upper panel of Fig. 2, which show the temperature asymmetry of regions A3 and A4 with respect to regions A1 and A2 within , , and from the center of M33. This together with Fig. 1 shows that regions A3 and A4 are systematically hotter than regions A1 and A2 in the considered Planck bands. The detected temperature asymmetry with respect to the minor axis of the M33 galaxy is clearly aligned along its rotational direction, indicating a Doppler-induced effect modulated by the spin of the galaxy, since it is almost independent of the Planck band. This result is also confirmed by analyzing the foreground-corrected SMICA map (Planck Collaboration I, 2015), as indicated by the histogram at the right side of the upper panel in Fig. 2. In this respect, we also note that the temperature asymmetry in the SMICA map does not mean that it is of cosmological origin. To remove the CMB contribution from a Planck map, it is therefore not possible to subtract the SMICA map on a pixel-by-pixel basis from the considered data (see, e.g., Appendix B in Hermelo et al. 2016).
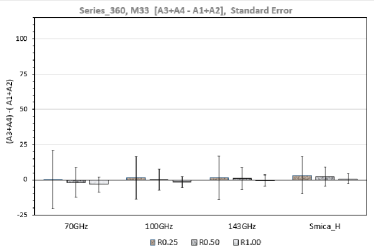
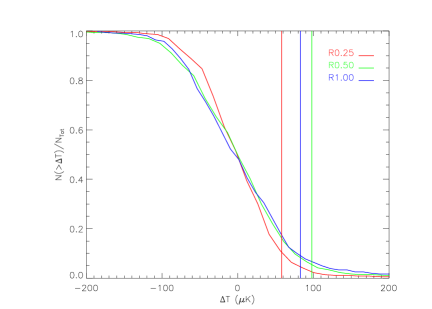
In the central panel of Fig. 2 we show the temperature asymmetry for 360 control fields with the same geometry as in Fig. 1, equally spaced at one degree distance to each other in Galactic longitude and at the same latitude as M33, together with the corresponding standard error of the mean. To test more carefully whether the measured values of towards M33 is real or may be a fluctuation of the CMB background, we show in the bottom panel of Fig. 2 the cumulative distribution (i.e., the relative number of control fields with a stronger temperature asymmetry than a given ) of the temperature asymmetry in the 70 GHz Planck band. The vertical lines show for each region the value measured toward M33. Fewer than of the control fields have values higher than the corresponding values toward M33, and moreover, a careful inspection of the single profiles shows that only eight of the control field profiles are globally above the profile of M33, implying a probability certainly that the detected temperature asymmetry toward the M33 galaxy is due to a random fluctuation of the CMB sky (see, in addition, the discussion at the end of Sect. 3, where we consider the region up to from the center of M33).
3 Comparison with 21 cm data
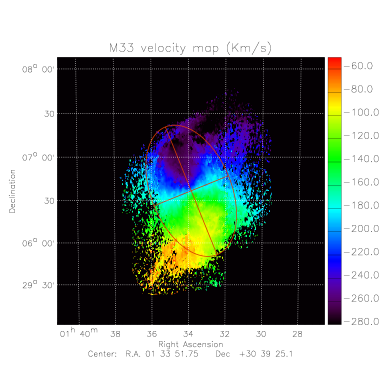
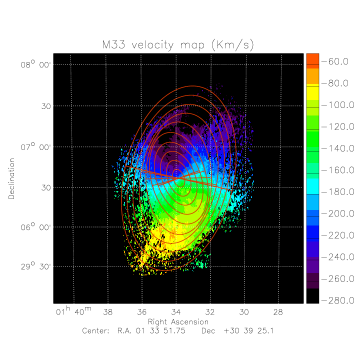
The M33 galaxy has been studied in great detail in the 21 cm emission line of the neutral hydrogen (see, e.g., Corbelli & Salucci 2000; Chemin et al. 2012; Keenan et al. 2016), and the obtained velocity maps clearly show the M33 rotation with respect to its minor axis. The same effect is also clear in other analyses, such as the CO velocity field (Fig. 6 in Gratier et al. 2010). The comparison of Planck data with the HI velocity field at 21 cm might in principle helpful to infer the possible source of the temperature asymmetry found in Planck data. If the signal in the microwave band were due to gas or dust emission, modulated by the M33 spin, the temperature asymmetry between regions A3 and A4 and A1 and A2 should be given by
| (1) |
according to the model first proposed in De Paolis et al. (1995). Here, is the rotation velocity, is the M33 disk inclination angle, is the gas or dust filling factor, and is the averaged optical depth within a given Planck band. The shape of the temperature and velocity asymmetry profiles should then correlate tightly, provided that does not change much within the galaxy. To investigate this question, we considered the velocity field reported in Chemin et al. (2012) that was acquired with aperture synthesis observations at the Dominion Radio Astrophysical Observatory (DRAO). In Fig. 3 we show the velocity field of the HI component with the superimposed M33 ellipse (red curve). We note that the ellipse shown in Fig. 3 and considered in the following analysis is slightly larger than the ellipse shown in Fig. 1 (which corresponds to the optical extension of the M33 galaxy). The semi-major axis was in Fig. 1, while it is in Fig. 3. The reason for this choice is that we wished to compare Planck and DRAO data at the largest possible scale (limited by the extension of the available 21 cm data), which becomes clear in the following discussion.
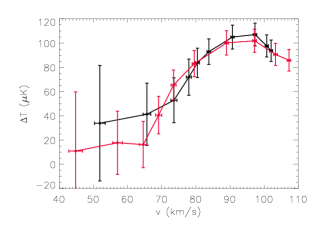
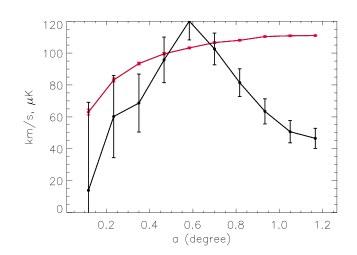
In the upper panel of Fig. 4 we present the temperature asymmetry in the 70 GHz Planck band versus the M33 rotation velocity evaluated within ten ellipses with semi-major axes between and (black line). However, the M33 HI disk is known to have a prominent warp, which is mostly consistent with a twist of the kinematic position angle as the inclination remains more or less constant with radius (Corbelli et al. 2014). From a galactocentric distance of about 7 kpc, the kinematic position angle of the major axis of the outer regions is seen to decline by about with respect to the inner disk regions. To investigate whether the correlation is modified by the warping HI disk, we also considered a different ellipse with a position angle rotated by (with respect to that shown in Fig. 3) and obtained the red curve in the upper panel of Fig. 4.
The correlation between and for the two profiles is quite similar, and the Pearson correlation coefficient is 0.93 and 0.89 for the black and red profiles, respectively.
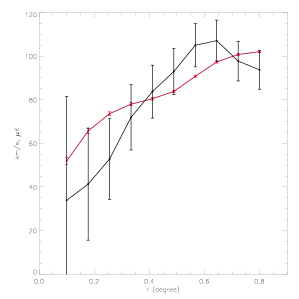
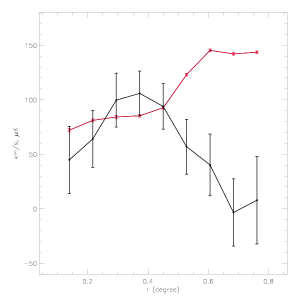
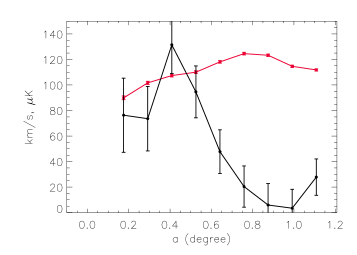
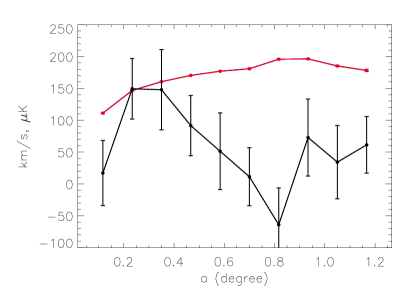
In Fig. 4 we also show the temperature asymmetry in the 70 GHz Planck band (black curve) and the velocity asymmetry (red curve) radial profiles, with the respective errors. In particular, in the middle panel we consider ten concentric ellipses with semi-major axes between and and, within the ellipese, the average temperature (in Planck’s 70 GHz band) and the radial velocity asymmetry (with respect to the galaxy minor axis) are calculated. The agreement between the temperature and velocity curves is quite good, although the errors relative to the temperature asymmetry curve are quite large. In the bottom panel of Fig. 4 we present the radial profiles but, different from the middle panel, with the temperature and velocity asymmetry calculated shell by shell (in a symmetric way with respect to the minor axis of the M33 galaxy). The two profiles apparently agree well within about , the extension of the visible M33 disk, while the agreement seems lost beyond .
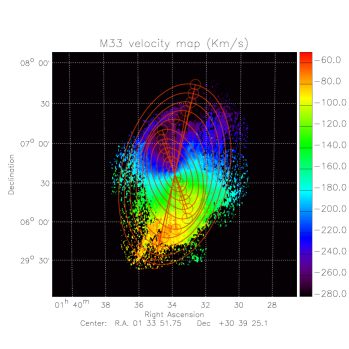
A more detailed study of this problem is presented in Fig. 5, where we consider a set of ten ellipses with increasing semi-major axis values and position angles rotated from (corresponding to the ellipse directed as in Figs. 1 and 3) to (corresponding to the outermost ellipse in the upper panel of Fig. 5), following the geometrical model described in Sect. 4 in Corbelli & Schneider (1997). The ellipses have semi-major axes since to and position angle given by ( being the semi-major axis, in arcmin, of the ellipse) and describe with a certain degree of accuracy the warped disk of the M33 galaxy. The obtained ellipses are shown in the upper panel of Fig. 5, and the corresponding temperature asymmetry and HI velocity profiles are shown in the middle and bottom panels of Fig. 5, which are analogous for the rotated ellipses to the corresponding panels in Fig. 4. As indicated by the middle and bottom panels of Fig. 5, the two profiles deviate from each other beyond about , so that we can conclude that beyond this distance, the agreement of the two considered profiles is not substantially improved by the consideration of the Corbelli & Schneider (1997) geometrical model with respect to the model used in Fig. 4.
However, the lack of agreement between the temperature asymmetry and velocity profiles beyond about is expected. While the HI velocity field precisely yields the gas velocity in a given direction of sight, the temperature in a given Planck pixel in a certain band does depend on a number of physical parameters that are difficult to quantify, therefore it depends on a complex superpositions of effects. Roughly speaking, it indicates that in the range the value of in Eq. (1) decreases rapidly.
We also note that the emission peak of about k at about from the center of M33 (central and bottom panels in Fig. 5) may be related to the strong increase of the heating efficiency that rises from about in the inner kpc to at a radial distance of about kpc (Kramer et al., 2013).
The analysis discussed above is also confirmed by Fig. 6, in which we have considered the temperature and velocity asymmetry between symmetrically disposed circles of radius positioned at the extrema of each ellipse in the Corbelli & Schneider (1997) model, as indicated in the upper panel of the figure. Here we show the major axis of each ellipse at the vertex of which the radius circles are shown. In the bottom panel of Fig. 6 we plot the velocity (red curve) and temperature (black curve) asymmetry profiles obtained by subtracting the average velocity and temperature values in each symmetrically positioned circle with respect to the center of M33. This plot traces the disk rotation of M33 better than Fig. 5. The choice of circles of this size arises from a compromise between the necessity to have a sufficient number of pixels (to have lower error bars in the temperature profile) and being at the same time representative for each step along the ellipse major axes. In spite of the relatively large error bars in the temperature asymmetry curve, the obtained profiles are required to maximize the asymmetry effect with respect to the results in Figs. 4 and 5. From comparing the result with that in the bottom panel of Fig. 5, the agreement between the velocity and temperature profiles becomes slightly better, although the two curves diverge beyond about . It is also confirmed, however, that the temperature profile starts to rise again beyond about , and the agreement between the two profiles is restored within .
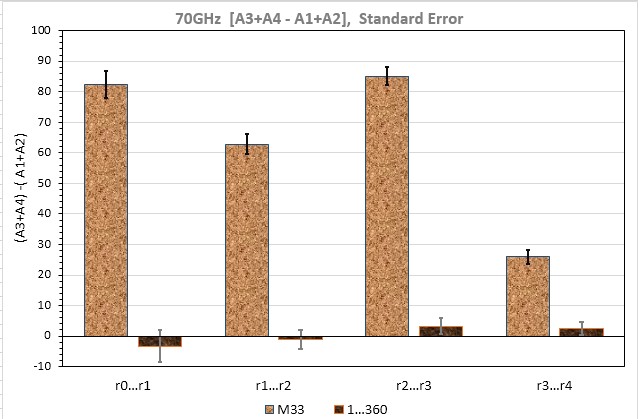
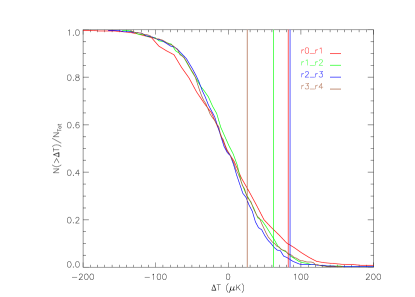
We also analyzed the temperature asymmetry farther away from the center of M33. In the upper panel of Fig. 7 we present a histogram with the analysis of Planck data in the 70 GHz band up to from the M33 center. The light brown columns give the temperature asymmetry in K of regions A3 and A4 with respect to regions A1 and A2 within (indicated by ) and in regions (indicated by ), (indicated by ), and (indicated by ), with the corresponding asymmetry in the 360 control fields (in dark brown). The temperature asymmetry extends up to about from the M33 center and then rapidly decreases. In the bottom panel of Fig. 7 we show the cumulative distribution of the measured values for the 360 control fields together with the corresponding values detected toward M33 (vertical lines). With the exception of the outermost ring between and , fewer than of the control fields have higher than the corresponding values toward M33. This corresponds to a probability (i.e., ) for a random nature of the M33 temperature asymmetry. This result is also confirmed by a direct inspection of the temperature asymmetry profiles in each of the control fields, which shows that only one of the control fields has higher than that of M33 in each of the four considered regions. This indicates that the probability that the M33 temperature asymmetry is due to a random fluctuation of the microwave signal is . These two considerations indicate that the temperature asymmetry observed up to about from the center of M33 is a genuine effect.
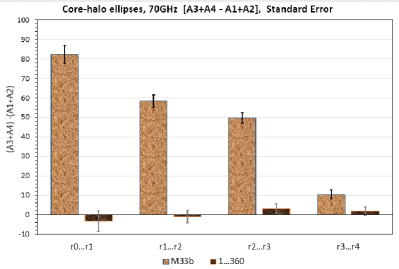
Finally, we considered the same geometry as in Fig. 7, but with the position angle of the second, third, and fourth annuli rotated by , that is, oriented as the outermost ellipse of the model by Corbelli & Schneider (1997). In Fig. 8 we present the obtained temperature asymmetry in the four annuli up to . A comparison between the upper panel of Fig. 7 and Fig. 8 clearly shows that the temperature asymmetry shows higher values for the original orientation of the geometry.
4 Conclusions
Similar to other nearby galaxies analyzed in some previous papers, M33 also shows a temperature asymmetry in Planck data with respect to the M33 minor axis projected onto the sky plane. This effect is clearly visible in all considered Planck bands at 70, 100, and 143 GHz, as well as in the best foreground-corrected SMICA map. As shown by the good correlation with the HI velocity field within about , this is likely due to gas or dust emission in the M33 disk, modulated by its rotation. After peaking in the 70 GHz band at about , the microwave signal decreases between and , but then it increases again and peaks in the annulus between and (see Fig. 7). The detected temperature asymmetry is much more extended than the visible M33 disk and seems to be present up to a galactocentric distance of about . This apparently odd behavior indicates either a change in the emission geometry or a drastic change of the dominant emission mechanism, even if the situation might be complicated by contaminating effects, such as gas flowing into the M33 galaxy, and/or related to a past M33-M31 interaction (see, in particular, Bekki 2008; Wolf et al. 2013).
Five possible emission mechanisms might explain the observed temperature asymmetry: () free-free emission, () synchrotron emission, () anomalous microwave emission (AME) from dust grains, () Sunyaev-Zel’dovich (SZ) effect, in particular the kinetic-SZ effect, and () cold gas clouds populating the halo of M33. The absence of a substantial dependence of the observed temperature asymmetry on the considered Planck bands together with the fact that the hot and cold side are toward the expected directions indicates that it has to be modulated by the Doppler effect induced by the M33 spin.
The dominating emission mechanism in the microwave regime is not clear as yet. Mechanisms (), (), and () require the presence of a hot plasma with cosmic-ray electrons (CRE) around M33, however, and give rise to an emission spectrum with a rather steep dependence on the frequency (see, e.g., Bennett 2003; Planck Collaboration XII 2014). This plasma, expected to emit mainly in X-rays, is hard to detect since the emission measure scales with the square of the electron density, and when the galaxy surface brightness drops to the level of the X-ray background, mainly due to the Milky Way, further detection is impossible. A hot gaseous halo (or corona) has been detected only for a few spiral galaxies. In our Galaxy, Gupta et al. (2012) probed the warm-hot phase (at a temperature K) of the Galactic halo through the Chandra detection of and absorption lines (with redshift ) toward known AGNs and inferred a warm halo extending up to kpc and possibly containing about in gaseous form (Miller and Bregman, 2013). This gaseous halo probably rotates with a velocity lower than the Local Standard of Rest velocity (Hodges-Kluck et al., 2016). For UGC12591, a hot halo has been detected that extends up to 110 kpc from the galactic center (Dai et al. 2012). For M33, although a hot-diffuse gas component is clearly visible in the XMM-Newton EPIC data up to about (Pietsch et al. 2003), it cannot be excluded that it extends farther out and, moreover, investigation of the CRE propagation length shows that its value is even higher than that in M31 (Berkhuijsen et al. 2013). AME, option (), has been observed in various interstellar environments such as in the ISM (Miville-Deschênes et al., 2008) and in dark clouds (Watson et al., 2005). Several processes can excite dust grain emission, provided they are present in galactic halo environments (see below): IR and radio photons, gas or dust interaction, formation of molecules on the dust grain surface, photoelectric emission (see, e.g., Draine and Lazarian 1998). Option () cannot be excluded at present because cold gas clouds (with or without a dust component) may populate the M33 halo, giving rise, if it were to rotate, to a certain temperature asymmetry through Eq. (1). These clouds may be optically thin or thick to their own sub-millimeter radiation, depending on their mass and temperature. When the clouds are in virial equilibrium, the cloud optical thickness may be estimated through the relation
| (2) |
where and are the cloud mass and temperature, and is the mass of Jupiter. Large clouds are therefore expected to be optically thin, while only extremely low massive clouds (with ) may be optically thick. The expected effect in the microwave bands is therefore very small. Cold clouds, such as those implied by BOOMERANG (Veneziani et al., 2010), Planck (Planck Collaboration VII, 2011), and Herschel (Juvela et al., 2010, 2012), also calledHerschel cold clouds (HCC) and studied mainly toward the Small Magellanic Clouds (see Nieuwenhuizen et al. 2012 and references therein), might also be present in the M33 halo and give rise to a temperature asymmetry in the Planck bands. We also mention that HI clouds have been discovered in the outer regions of M33 (Grossi et al., 2008; Keenan et al., 2016), and it has been suggested that they play a role in feeding the star formation in the disk of M33. The observed gaseous features extend up to 38 kpc from the galaxy center, and the HI mass beyond the M33 disk contains about of the estimated total HI mass (Putman et al., 2009). Until now, Herschel data of M33, within the project HERM33ES (Herschel M33 Extended Survey), have been analyzed and reported in the literature only up to a galactocentric distance of about and show a cold dust component with temperature K between about 2 kpc and 6 kpc, and both SPIRE and PACS maps show a weak emission extending outside of 8 kpc (Kramer et al., 2010).
For the extension of the microwave emission toward M33 and its connection with some galactic population, we mention that in addition to the possible hot corona of CRE and plasma, there is another component that has recently been discussed in the literature: the RGB star halo population of M33, which was discovered by using the Pan-Andromeda Archeological Survey (PAndAS). This is found to have an exponential scale length of about kpc (about ), as obtained by Cockcroft et al. (2013), and might account for the emission in the microwave bands through the mechanisms discussed above. Even though RGB stars cannot generate an asymmetry in the microwave temperature, a gas or dust component (as that described above) might be present in the outer region of the M33 galaxy, in association with the RGB stars.
Galactic halos do contain the fossil record of galaxy assembly, and clarifying their composition is extremely important to understand the processes that led to the formation and subsequent evolution of these structures. The degree to which galactic halos rotate with respect to the disks is also a relevant and extremely difficult question to answer (see, e.g., Courteau et al. 2011; Deason et al. 2011). All this indicates the need for more detailed, extended, and dedicated surveys.
Acknowledgements.
We acknowledge the use of Planck data in the Legacy Archive for Microwave Background Data Analysis (LAMBDA) and HEALPix (Górski et al., 2005) package. FDP, AAN, and GI acknowledge the support by the INFN project TAsP, and PJ acknowledges support from the Swiss National Science Foundation. AQ is grateful for hospitality to the DST Centre of Excellence in Mathematical & Statistical Sciences of the University of the Witwatersrand, Johannesburg, South Africa. The anonymous referee is acknowledged for the detailed comments.References
- Barker et al. (2007) Barker, M.K., Sarajedini, A., Geisler, D. et al. 2007, AJ, 133, 1125
- Bekki (2008) Bekki, K. 2008, MNRAS, 390, L24
- Bennett (2003) Bennett, C.L. 2003, ApJ, 148, 97
- Berkhuijsen (1983) Berkhuijsen, E.M. 1983, A&A, 127, 395
- Berkhuijsen et al. (2013) Berkhuijsen, E.M., Beck, R. and Tabatabaei, F.S. 2013, MNRAS, 435, 1598
- Bothan (1992) Bothan, G.D. 1992, AJ, 103, 104
- Buta et al. (2007) Buta, R.J., Corwin, H.G. and Odewahn, S.C .2007, The de Vaucouleurs Altlas of Galaxies, Cambridge University Press, Cambridge, UK
- Chemin et al. (2012) Chemin, L., Carignan, C., Foster, T. and Kam, Z.S. 2012, in Proceedings of the Annual meeting of the French Society of Astronomy and Astrophysics (Eds.: S. Boissier, P. de Laverny, N. Nardetto, R. Samadi, D. Valls-Gabaud and H. Wozniak), pag. .519-522
- Cockcroft et al. (2013) Cockcroft, R., McConnachie, A.W., Harris, W.E. et al. 2013, MNRAS, 428,1248
- Corbelli & Schneider (1997) Corbelli, E. and Schneider, S.E. 1997, ApJ, 479, 244
- Corbelli & Salucci (2000) Corbelli, E. and Salucci, P. 2000, MNRAS, 311, 441
- Corbelli & Walterbos (2007) Corbelli, E. and Walterbos, R.A.M. 2007, ApJ, 669, 315
- Corbelli et al. (2014) Corbelli, E., Thilker, D., Zibetti, S. et al. 2014, A&A, 572, id.A23
- Courteau et al. (2011) Courteau, S., Widrow, L. M., McDonald, M., et al. 2011, ApJ, 739, 20
- Dai et al. (2012) Dai, X. Anderson, M.E., Bregman, J.N., Miller, J.M. 2012, ApJ, 755, 107
- Deason et al. (2011) Deason, A. J., Belokurov, V. & Evans, N. W. 2011, MNRAS, 411, 1480
- De Paolis et al. (1995) De Paolis, F., Ingrosso, G., Jetzer, Ph. et al. 1995, A&A, 299, 647
- De Paolis et al. (2011) De Paolis, F., Gurzadyan, V.G., Ingrosso, G. et al. 2011, A&A, 534, id. L8
- De Paolis et al. (2014) De Paolis, F., Gurzadyan, V.G., Nucita, A.A. et al. 2014, A&A, 565, id. L3
- De Paolis et al. (2015) De Paolis, F., Gurzadyan, V.G., Nucita, A.A. et al. 2015, A&A, 580, id. L8
- Draine and Lazarian (1998) Draine, B.T. and Lazarian, A. 1998, ApJ, 508, 157
- Gieren et al. (2013) Gieren, W., Górski, M., Pietrzyǹski, G. et al. 2013, ApJ, 773, id. 69
- Górski et al. (2005) Górski, K. M., Hivon, E., Banday, A. J. et al. 2005, ApJ, 622, 759
- Gratier et al. (2010) Gratier, P., Braine, J., Rodriguez-Fernandez, N.J. et al. 2010, A&A, 522, A3
- Grossi et al. (2008) Grossi, M., Giovanardi, C., Corbelli, E. et al. 2008, A&A, 487, 161
- Gupta et al. (2012) Gupta, A. Mathur, S., Krongold, Y., Nicastro, F., Galeazzi, M. 2012, ApJ, 756, id. L8
- Gurzadyan et al. (2010) Gurzadyan, V., De Paolis, F, Nucita, A et al. 2015, A&A, 582, id.A77
- Hermelo et al. (2016) Hermelo, I., Relano, M., Lisenfeld, U. et al. 2016, arXiv:1603.02125
- Hodge (2012) Hodge,, P. 2012, The Spiral galaxy M33, Springer
- Hodges-Kluck et al. (2016) Hodges-Kluck, E.J., Miller, M.J., Bregman, J.N. 2016, ApJ, 822, id. 21
- Juvela et al. (2010) Juvela, M., Ristorcelli, I., Montier, L.A. et al. 2010, A&A, 518, id. L93
- Juvela et al. (2012) Juvela, M., Ristorcelli, I., Pagani, L. et al. 2012, A&A, 541, id. A12
- Kam et al. (2015) Kam, Z.S., Carignan, C., Chemin, L., Amram, P. and Epinat, B. 2015, MNRAS, 449, 4048
- Keenan et al. (2016) Keenan, O.C., Davies, J.I., Taylor, R. and Minchin, R.F. 2016, MNRAS, 456, 951
- Kramer et al. (2010) Kramer, C., Buchbender, C., Xilouris, E.M. et al. 2010, A&A, 518, id. L67
- Kramer et al. (2013) Kramer, C., Abreu-Vicente, J., Garcia-Burillo, S. et al. 2013, A&A, 553, id. A114
- Magrini et al. (2007) Magrini, L., Corbelli, E. and Galli, D. 2007, A&A, 470, 843
- McConnachie et al. (2010) McConnachie, A.W., Ferguson, A.M.N., Irwin, M.J. et al. 2010, ApJ, 723, 1038
- Miller and Bregman (2013) Miller, M.J., Bregman, J.N. 2013, ApJ, 770, id. 118
- Miville-Deschênes et al. (2008) Miville-Deschênes, M.-A., Ysard, N., Lavabre, A. et al. 2008, A&A, 490, 1093
- Nieuwenhuizen et al. (2012) Nieuwenhuizen, T.M., van Heusden, E.F.G., Liska, M.T.P. 2012, Physica Scripta, 151, id.014085
- Pietsch et al. (2003) Pietsch, W., Ehle, M., Haberl, F. et al. 2003, Astronomische Nachrichten, 324, 85
- Planck Collaboration VII (2011) Planck Collaboration VII, 2011, A&A, 536, id. A7
- Planck Collaboration XII (2014) Planck Collaboration XII, 2014, A&A, 571, id.A12
- Planck Collaboration I (2015) Planck Collaboration I, 2015, A&A submitted; arXiv:1502.01582
- Planck Collaboration XVI (2015) Planck Collaboration XVI, 2015, A&A submitted; arXiv:1506.07135
- Putman et al. (2009) Putman, M.E., Peek, J.E.G., Muratov, A. et al. 2009, ApJ, 703, 1486
- Rauzy & Gurzadyan (1998) Rauzy, S. and Gurzadyan, V. G. 1998, MNRAS, 298, 114
- Trinchieri et al. (1988) Trinchieri, G., Fabbiano, G. and Peres, G. 1988, ApJ, 325, 531
- van den Bergh (2000) van den Bergh, S., 2000, The Galaxies of the Local Group, Cambridge University Press, Cambridge, UK
- Veneziani et al. (2010) Veneziani, M., Ade, P.A.R., Bock, J.J. et al. 2010, ApJ, 713, 959
- Watson et al. (2005) Watson, R.A., Rebolo, R., Rubiño-Martin, J.A. et al. 2005, ApJ, 624, L89
- Wolf et al. (2013) Wolf, S.A., Pisano, D.J., Lockman, F.J. et al. 2013, Nature, 497, 224