Structural and magnetic properties of Co-N thin films deposited using magnetron sputtering at 523 K
Abstract
In this work, we studied cobalt nitride (Co-N) thin films deposited using a dc magnetron sputtering method at a substrate temperature () of 523 K. We find that independent of the reactive gas flow () used during sputtering, the phases of Co-N formed at this temperature seems to be identical having N % 5. This is contrary to Co-N phases formed at lower . For 300 K, an evolution of Co-N phases starting from Co(N)Co3NCoN can be seen as increases to 100, whereas when the substrate temperature increases to 523 K, the phase formed is a mixture of Co and , independent of the used during sputtering. We used x-ray diffraction (XRD) to probe long range ordering, x-ray absorption spectroscopy (XAS) at Co absorption edge for the local structure, Magneto-optical Kerr e ffect (MOKE) and polarized neutron reflectivity (PNR) to measure the magnetization of samples. Quantification of N % was done using secondary ion mass spectroscopy (SIMS). Measurements suggest that the magnetic moment of Co-N samples deposited at 523 K is slightly higher than the bulk Co moment and does not get affected with the used for reactive sputtering. Our results provide an important insight about the phase formation of Co-N thin films which is discussed in this work.
keywords:
Cobalt nitride thin films, tetra cobalt nitride, reactive nitrogen sputtering1 Introduction
Tetra 3d magnetic transition metal nitrides (e.g. , ) are ferromagnetic materials having higher (than pure metal) magnetic moment, large spin polarization ratio (SPR) and superior chemical stability. Such properties make them a candidate in high density magnetic memory devices and spintronics [1, 2, 3, 4, 5, 6]. In addition, transition metal nitrides are also used as an anode materials for lithium-ion batteries. In particularly, cobalt nitrides find place in Li3-xCoxN, which shows a remarkable high reversible capacity and good cycle performance [7, 8, 9, 10]. A lot of theoretical [11, 12, 13, 14, 15] and experimental [16, 17, 18, 19, 20, 21, 22, 23] reports are available on iron nitride (Fe-N) system. In a number of studies thin films have been prepared and studied [16, 17, 18, 19, 20, 21, 22, 23]. On the other hand, the Co-N system has not been explored as much. In particularly, recent works on the phase revealed that the SPR of can be as high as 0.9 (probably the highest) which is considerably larger than the SPR of at 0.66 [24]. This has led to renowned research on phase during last couple of years. Special interest has been paid to thin films and they have been deposited using sputtering [25, 24, 4, 6], MBE [26, 27] etc.
One of the key parameters for growth of single phase tetra metal nitrides is the substrate temperature (). In the case of Fe-N, the phase diagram is well-known and the phase is formed at 623 K. In the absence of Co-N phase diagram, the experimental method adopted for preparation of thin film seems to be influenced directly by the recipe used for thin films. However there seems to be large variations in used for preparation of thin films; as large as 723 as low as 300 K [2, 3, 5, 6, 27]. In a recent work, It was demonstrated that thin film with lattice parameter close to its theoretical values can be prepared at 300 K and these films were not stable beyond 473 K [27]. In an early study by Maya et. al. [28], thermal decomposition of CoN thin films was measured. Here it was found that a volatile evolution of nitrogen peaks around 613 K. This signifies that N out diffuses from the CoN system leaving behind fcc Co. In the view of such observations, higher (600 K) used for the growth of phase seems to be not appropriate. In order to clarify the phase formation of films we have chosen at 523 K, well-below the volatile evolution temperature. In a recent study, Silva [24] also studied the formation of thin films at =523 K, however they varied the partial nitrogen gas flow only in a narrow range. In the present work, we did a systematic study by preparing a series of Co-N thin films. We varied the partial nitrogen gas flow in the whole range (0 to 100) and resultant films were studied for their long and short range ordering, chemical composition and magnetic properties. We found that the formation of Co-N phases at = 523 K does not have any dependence on the partial nitrogen gas flow. This is a new result for Co-N system and can be understood in terms of its heat of formation.
2 Experimental Procedure
Co-N thin films were deposited on glass substrate at = 523 K by direct current magnetron sputtering (dcMS) using a AJA Int. Inc. make ATC Orion-8 series sputtering system equipped with high purity 3 inch diameter cobalt target (99.99). The substrate to target distance was fixed at 12 cm. The substrate holder was rotated along its own axis at 60 rpm during the deposition for better uniformity of the film. The sputtering was done in Ar (99.999) and N2 (99.999) plasma environment using different partial gas flows defined as = p/(pAr+p, where pAr and p are gas flow of Ar and N2 gases, respectively. With a base pressure of 110-7 Torr, the pressure during deposition was kept fixed at 310-3 Torr using a dynamic throttle gate valve. All samples were deposited at a fixed power of 100 W and used during deposition was 0, 25, 50, 75, 100. A reference sample of pure Co was also deposited under identical conditions at = 300 K. The thickness of thin film samples was kept typically at 200 nm, expect for = 100, sample, where the thickness was about 100 nm due to reduced deposition rate.
To measure the concentration of nitrogen content, secondary ion mass spectroscopy (SIMS) measurements were performed under UHV conditions using a Hiden Analytical SIMS workstation. The crystal structure and the phase formation of samples were characterized by x-ray diffraction (XRD) using a standard XRD system (Bruker D8 Advance) using CuKα x-ray source. To get the precise information about the electronic structure, soft x-ray absorption spectroscopy (SXAS) measurements were carried out at BL-1 beamline of Indus-2 synchrotron radiation source at RRCAT, Indore. To study the magnetic properties, magneto optical-Kerr effect (MOKE) and polarized neutron reflectivity (PNR) measurements were carried out. MOKE measurements were performed in longitudinal mode on M/S Evico Magnetics system and PNR measurements were carried out at the SuperADAM instrument at ILL, Grenoble, France.
3 Results
3.1 Composition and Structural Characterization
Nitrogen concentration of samples was measured using SIMS depth profiles of Co and N (not shown). A thin film sample with a known nitrogen concentration of about 20 % was used as a reference. Using a procedure described in ref. [4], the nitrogen concentration was calculated. We find that N concentration is about 5(2)% for samples deposited using = 25, 50, 75 and 100 (table 1). This is surprising as it is generally expected that with an increase in , N concentration should increase. This issue will be discussed in section 4.
As mentioned in section 2, we deposited two types of sample, Co-N thin films with = 25, 50, 75 and 100 at = 523 K and pure Co films at = 300 K and 523 K. Pure Co films were deposited as a reference sample. The XRD pattern of all samples is shown in fig. 1. Pure Co film deposited at 300 K show distinct peaks appearing at 2 values 42.20∘, 44.75∘ and 47.51∘. Typical error in measurements of peak position is about 0.06 ∘. Comparing the position of these peaks with the standard JCPDS reference number (050727), it can be inferred that these peaks correspond to hcp Co planes (100), (002) and (101), respectively. When the is raised to 523 K, peaks appearing in the XRD pattern show a different behavior. We find that peaks now appear at 2 = 44.55∘, 47.64∘ and 51.57∘, which correspond to a mixture of fcc and hcp Co. While peaks at 2 = 44.55∘ and 51.57∘ correspond to fcc planes (111) and (200), respectively, the one appearing in the middle is similar to the sample deposited at 300 K.
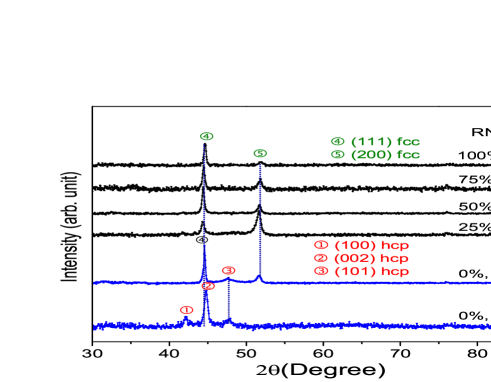
Addition of nitrogen gas during deposition seems to cause visible changes in the XRD pattern (fig. 1). We find that the peak corresponding to (002) plane of hcp Co does not appear anymore. Additionally, the intensity of (111) is more than (200) plane for samples having = 50, 75, 100 while for = 25 the intensity of (200) plane is more than (111) plane. In addition, peaks corresponding to fcc planes (111) and (200) shift towards lower 2 values indicating an expansion in the lattice parameter (LP). Such expansion may take place due to interstitial occupation of N atoms (in fcc Co) and formation of phase. Calculated values of LP are shown in table 1.
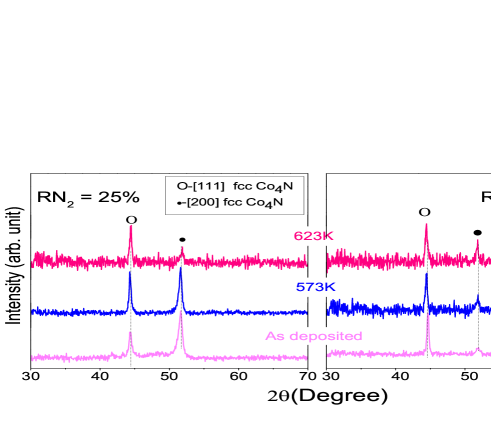
Moreover, we investigated the thermal stability of all samples deposited at various . Samples were annealed altogether in a vacuum furnace with base Pressure of 110-6 Torr and the annealing were carried out at 573 K and 623 K for 1 hour. Representative XRD pattern of annealed samples for = 25 and 100 are shown in fig. 2. We find that the peak positions corresponding to (111) and (200) planes remain identical. However the intensity of (111) plane seems to fluctuate rather randomly, whereas no significant changes can be observed for = 100 with annealing. From this it is clear that the sample deposited at = 523 K remain stable when annealed upto 623 K.
| nitrogen | LP | magnetic | ||
|---|---|---|---|---|
| () | % | Å | (1e28/m3) | moment() |
| (2) | (0.004) | (0.1) | () | |
| 0 | 0 | 3.521 | 8.9 | 1.68 |
| 25 | 4 | 3.536 | 8.7 | 1.75 |
| 50 | 5 | 3.536 | 8.7 | 1.70 |
| 75 | 5 | 3.530 | 8.7 | 1.73 |
| 100 | 6 | 3.532 | 8.7 | 1.7 |
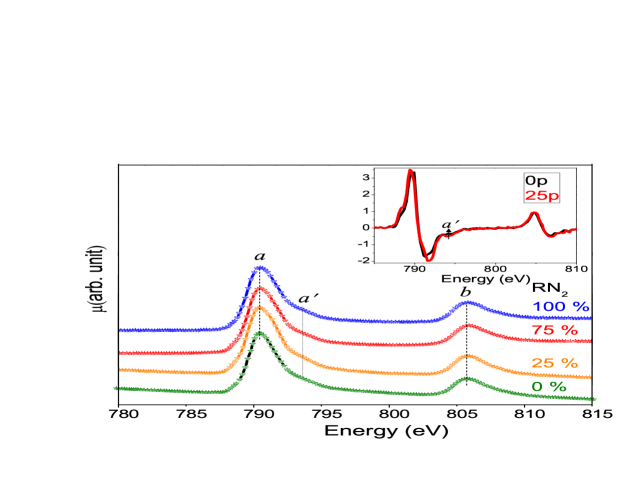
To know about the local environment and the electronic structure of deposited films, XAS measurements were performed for samples = 0, 25, 75 and 100 at Co L edges as shown in fig. 3. Inset to this figure compares the derivative of absorption spectra of samples for = 0 and 25. We find three features assigned as , and . Features and have the energy difference of about 15 eV and are known as L3 (2p3/2) and L2 (2p1/2) edge jumps, arising due to well-known spin-orbit interaction. It can be noticed that the position of features and remains identical across all samples indicating that the oxidation state does not change with a variation of . In addition, the feature , a shoulder to feature , shows a clear variation for samples deposited with or without nitrogen. This feature appears due to different chemical bonding at inequivalent 3d metal sites [27, 29] and is a characteristic feature for anti-pervoskite type structures. We also notice that the intensity of feature , and is more (than pure Co) when nitrogen gas is used during sputtering. This happens due to the enhanced hybridization N 2p states with Co 3d states. Our XAS results clearly show a small but observable difference between sample prepared with and without nitrogen gas used during sputtering. However among the sample sputtered with nitrogen (= 25, 75 and 100), there seems to be no observable difference in the XAS spectra.
3.2 Magnetic Measurements
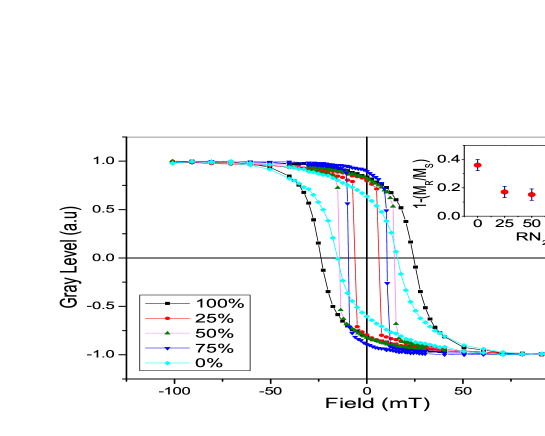
Fig. 4 shows the MOKE hysteresis loops, typical of a ferromagnetic sample. From the loops it can be seen that the magnetic anisotropy (1-(MR/MS); MR: remanent magnetization and MS: saturation magnetization) and coercivity for pure Co and Co-N films are different. Inset of the fig. 4 compares the variation of 1-(MR/MS) with . Here it can be seen that the pure Co film has somewhat large anisotropy than nitrogenated samples. While going from = 25 to 100 only a little variation can be seen in 1-(MR/MS). It may noted that hcp Co is expected to show rather large anisotropy but in fcc structure the anisotropy becomes low (as low as 10 times than hcp). From our XRD measurements, we found that the pure Co film deposited at = 523 K forms in a mixture of hcp and fcc phases, later being a dominant phase. Therefore the magnetic anisotropy of Co is expected to be low and it becomes even smaller when only fcc phase get formed in presence of nitrogen gas during sputtering. Our results obtained from XRD and XAS measurements correlate very well to the fact that the pure Co sample is different from Co-N samples and within Co-N samples they are identical.
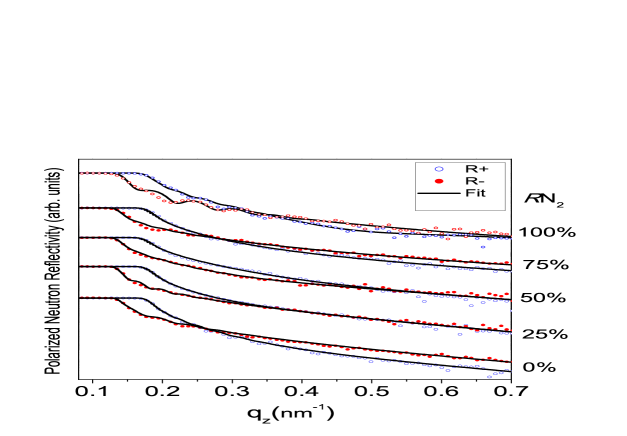
In order to measure the absolute Ms of our samples, we did PNR measurement. It is well-known that the PNR is the most accurate method for magnetization measurements in thin films. Since PNR provide an absolute value of Ms independent on sample mass and does not get influence by diamagnetism of the substrate. We performed the PNR measurements with an magnetic field (parallel to sample surface) of 0.5 Tesla to saturate them magnetically. The PNR pattern (fig. 5) of the samples shows a clear splitting between spin-up and down reflectivities which is a signature of ferromagnetism. Here, it is interesting to see that spin-up and spin-down reflectivities cross each other at different qz values. This happen due to a thin surface layer (3 nm) of different density. Such layer is generally form in thin films when exposed to atmosphere. To get the precise information about the Ms and the number density, PNR data were fitted using SimulReflec programme [30]. Fitted parameter are given in table 1. We find that pure Co has number density 8.91028 m-3 and a Ms of 1.68 0.05 which is in agreement with bulk Co [31, 6]. When nitrogen is added, we find number density decreases but magnetic moment increases slightly. The obtained values of magnetic moments and number density are shown in table 1.
4 Discussion
From the results presented in section 3, following information can be obtained. (i) pure Co grows in a hcp structure when deposited at = 300 K whereas at = 523 K a mixture of hcp and fcc phases is formed. (ii) when nitrogen is added during deposition, a fcc structure is formed, irrespective of the amount of nitrogen used during sputtering. (iii) properties of pure Co and that of Co-N films (for any ) are different with respect to structural, electronic and magnetic properties.
As far as pure Co film deposited at = 523 K is concerned, appearance of fcc Co phase already at this is somewhat surprising as the transition temperature from hcp to fcc structure for bulk Co is 690 K or above [32, 33, 4]. However in case of thin films, it has been observed that such transition from hcp to fcc phase can occur at much lower (than bulk) transition temperature (690 K) as observed by Carbel [32, 33]. On the other hand, the behavior of the films deposited in the presence of nitrogen is surprising as an increase in is expected to increase in N %. Generally for other systems like Fe-N, it has been observed that the addition of nitrogen during deposition results in N% enhancement almost up to mononitride composition (1:1 for Fe:N). Similarly, when Co-N films are deposited at = 300 K they show an evolution of phases, starting with few % of N to 50% N as increases from 5 to 100 [4].
Therefore, our observation that independent of (at = 523 K) used, the phases form are always similar, is surprising and such behavior has not been seen before for the Co-N system. On the other hand a lot of experimental reports are available, claiming the formation of phase at varying from 433 K to 723 K [25, 3, 5, 24, 6]. Use of such higher might have been influenced by phase which is generally formed at 673 K.
A comparison between the theoretical and experimentally observed values of LP can be used to understand the results obtained in this work. From our XRD data, we find a slight increment in the LP of Co-N samples as compared to the pure Co film deposited at 523 K. Theoretical values of LP for fcc Co and are 3.54 Å and 3.74 Å, respectively [24, 1, 34]. This implies that for (at N 20%) composition, the lattice dilation should be about 5. However, the experimental data available for films shows that the value of LP are 3.586 Å at 433 K [25], 3.524 Å at 523 K [24], 3.524 Å at 723 K [3] etc. This implies that the dilation in the LP of phase obtain experimentally so far is 0.5 to 1 only, against the expected value of 5. However, when films are deposited at = 300 K, the measured value of LP is 3.7 Å, quite close to the theoretical LP of [4].
Our data presented in this work, also imply that an expansion of typically 0.5 in the LP would correspond to 2-3 N % (in agreement with SIMS measurements). This result clearly indicate that, when Co-N films are deposited at 300 K, N % in resulting Co-N films is significantly low as compared to those obtained in Fe-N system. The reason for such behavior can be investigated while looking in the thermodynamics of Co-N system. It is known that the enthalpy of formation (H) for is -12.2(20) kJ/mol [35], however the value of H for Co-N system are not yet known explicitly. In theoretical calculation carried by Häglund , [36], it has been shown that the H increases as one moves along 3d series from Ti to Ni which means that the thermal stability of metal nitrides should decreases as Z increases in the 3d series [36]. In our recent study, we measured the thermal stability of films formed at = 300 K. Here it was found that above a temperature of 423 K, significant nitrogen diffusion starts to take place. It seems at high , rapid N diffusion takes place leaving behind pure Co with together with a reminiscent fraction of . It is interesting to see that fcc phase is formed for any used during sputtering, which also indicate that N atoms diffuse out form a parent fcc phase. In addition since samples deposited at = 523 K have somewhat higher Ms than pure Co, and they are also stable upto 623 K, is an interesting observation that can be used to prepare fcc Co films. Obtained results provide an important information about the Co-N system and a recipe of preparation of films which should involve low instead of higher temperature used in other works.
5 Conclusion
In this work we did a systematic study of Co-N thin films deposited at = 523 K using = 0, 25, 50, 75 and 100. From our SIMS, XRD, XAS, MOKE and PNR measurements, we found a clear difference between samples deposited with or without nitrogen during sputtering. However a variation in seems to cause not much difference among samples even as is varied from 25 to 100. This is a counter intuitive result which can be understood as the H for the might be much larger, resulting in poor thermal stability leading to rapid diffusion of N atoms. In such a scenario when Co-N films are deposited at high , N atoms diffuse out, leaving behind a fcc Co phase which has been often mistaken for a fcc phase.
Acknowledgments
We are thankful to V. R. Reddy, Zaineb Hussain for MOKE measurements, Alexei Vorobiev for providing help in PNR measurements, Layanta Behera and Anil Gome are acknowledge for their help in various measurements. BL01, Indus 2 team (D. M. Phase, D. K. Shukla, Rakesh Sah) are acknowledge for support in XAS beamline.
References
References
- Matar et al. [2007] S. F. Matar, A. Houari, M. A. Belkhir, Phys. Rev. B 75 (2007) 245109.
- Ito et al. [2014] K. Ito, K. Kabara, T. Sanai, K. Toko, Y. Imai, M. Tsunoda, T. Suemasu, Journal of Applied Physics 116 (2014).
- Ito et al. [2011] K. Ito, K. Harada, K. Toko, H. Akinaga, T. Suemasu, Journal of Crystal Growth 336 (2011) 40 – 43.
- Gupta et al. [2015] R. Gupta, N. Pandey, A. Tayal, M. Gupta, AIP Advances 5 (2015).
- Lourenço et al. [2014] M. Lourenço, M. Carvalho, P. Fonseca, T. Gasche, G. Evans, M. Godinho, M. Cruz, Journal of Alloys and Compounds 612 (2014) 176 – 182.
- Silva et al. [2014] C. Silva, A. Vovk, R. da Silva, P. Strichovanec, P. Algarabel, A. Gonçalves, R. Borges, M. Godinho, M. Cruz, Thin Solid Films 556 (2014) 125 – 127.
- Takeda et al. [2000] Y. Takeda, M. Nishijima, M. Yamahata, K. Takeda, N. Imanishi, O. Yamamoto, Solid State Ionics 130 (2000) 61–69.
- Das et al. [2009] B. Das, M. Reddy, P. Malar, T. Osipowicz, G. S. Rao, B. Chowdari, Solid State Ionics 180 (2009) 1061–1068.
- Das et al. [2012] B. Das, M. Reddy, G. S. Rao, B. Chowdari, Journal of Materials Chemistry 22 (2012) 17505–17510.
- Das et al. [2013] B. Das, M. Reddy, B. Chowdari, Nanoscale 5 (2013) 1961–1966.
- Mohn and Matar [1999] P. Mohn, S. Matar, Journal of Magnetism and Magnetic Materials 191 (1999) 234 – 240.
- Coey and Smith [1999] J. M. D. Coey, P. A. I. Smith, J. Magn. Magn. Mat. 200 (1999) 405 – 424.
- Kuhnen et al. [1992] C. Kuhnen, R. de Figueiredo, V. Drago, E. da Silva, Journal of Magnetism and Magnetic Materials 111 (1992) 95 – 104.
- Sifkovits et al. [1999] M. Sifkovits, H. Smolinski, S. Hellwig, W. Weber, Journal of Magnetism and Magnetic Materials 204 (1999) 191 – 198.
- Matar et al. [1988] S. Matar, P. Mohn, G. Demazeau, B. Siberchicot, Journal de Physique 49 (1988) 1761–1768.
- Dirba et al. [2015] I. Dirba, M. B. Yazdi, A. Radetinac, P. Komissinskiy, S. Flege, O. Gutfleisch, L. Alff, Journal of Magnetism and Magnetic Materials 379 (2015) 151 – 155.
- Li et al. [2015] Z. Li, X. Feng, X. Wang, W. Mi, Materials Research Bulletin 65 (2015) 175 – 182.
- Atiq et al. [2009] S. Atiq, H.-S. Ko, S. A. Siddiqi, S.-C. Shin, J. Alloys Compds. 479 (2009) 755 – 758.
- Atiq et al. [2008] S. Atiq, H.-S. Ko, S. A. Siddiqi, S.-C. Shin, Applied Physics Letters 92 (2008).
- Na et al. [2015] Y. Na, C. Wang, J. Xiang, N. Ji, J. ping Wang, Journal of Crystal Growth 426 (2015) 117 – 122.
- Ito et al. [2011] K. Ito, G. H. Lee, K. Harada, M. Suzuno, T. Suemasu, Y. Takeda, Y. Saitoh, M. Ye, A. Kimura, H. Akinaga, Applied Physics Letters 98 (2011).
- Ito et al. [2015] K. Ito, K. Toko, Y. Takeda, Y. Saitoh, T. Oguchi, T. Suemasu, A. Kimura, Journal of Applied Physics 117 (2015).
- Gallego et al. [2004] J. M. Gallego, S. Y. Grachev, D. M. Borsa, D. O. Boerma, D. Écija, R. Miranda, Phys. Rev. B 70 (2004) 115417.
- Sil [2015] Journal of Alloys and Compounds 633 (2015) 470 – 478.
- Oda et al. [1987] K. Oda, T. Yoshio, K. Oda, Journal of Materials Science 22 (1987) 2729–2733.
- Ito et al. [2011a] K. Ito, K. Harada, K. Toko, H. Akinaga, T. Suemasu, Journal of Crystal Growth 336 (2011a) 40 – 43.
- Ito et al. [2011b] K. Ito, K. Harada, K. Toko, M. Ye, A. Kimura, Y. Takeda, Y. Saitoh, H. Akinaga, T. Suemasu, Applied Physics Letters 99 (2011b).
- Maya et al. [1996] L. Maya, M. Paranthaman, J. Thompson, T. Thundat, R. Stevenson, Journal of applied physics 79 (1996) 7905–7910.
- Ito et al. [2015] K. Ito, K. Toko, Y. Takeda, Y. Saitoh, T. Oguchi, T. Suemasu, A. Kimura, Journal of Applied Physics 117 (2015).
- Ott [2011] F. Ott, SIMULREFLEC (V1.7 2011).
- E.P.Wohlfarth [1986] E.P.Wohlfarth, Ferromagnetic Materials, volume 1, North-Holland, 1986.
- Cabral Jr et al. [1993] C. Cabral Jr, K. Barmak, J. Gupta, L. Clevenger, B. Arcot, D. Smith, J. Harper, Journal of Vacuum Science & Technology A 11 (1993) 1435–1440.
- Zhang et al. [1999] H. Zhang, J. Poole, R. Eller, M. Keefe, Journal of Vacuum Science and Technology A 17 (1999).
- Imai et al. [2010] Y. Imai, Y. Takahashi, T. Kumagai, Journal of Magnetism and Magnetic Materials 322 (2010) 2665 – 2669.
- Tessier et al. [2000] F. Tessier, A. Navrotsky, R. Niewa, A. Leineweber, H. Jacobs, S. Kikkawa, M. Takahashi, F. Kanamaru, F. J. DiSalvo, Solid State Sciences 2 (2000) 457.
- Häglund et al. [1993] J. Häglund, A. F. Guillermet, G. Grimvall, M. Körling, Physical Review B 48 (1993) 11685.