Strong Evidence for the Density-wave Theory of Spiral Structure in Disk Galaxies
Abstract
The density-wave theory of galactic spiral-arm structure makes a striking prediction that the pitch angle of spiral arms should vary with the wavelength of the galaxy’s image. The reason is that stars are born in the density wave but move out of it as they age. They move ahead of the density wave inside the co-rotation radius, and fall behind outside of it, resulting in a tighter pitch angle at wavelengths that image stars (optical and near infrared) than those that are associated with star formation (far infrared and ultraviolet). In this study we combined large sample size with wide range of wavelengths, from the ultraviolet to the infrared to investigate this issue. For each galaxy we used an optical wavelength image (-band: 445 nm) and images from the Spitzer Space Telescope at two infrared wavelengths (infrared: 3.6 and 8.0 m) and we measured the pitch angle with the 2DFFT and Spirality codes (Davis et al., 2012; Shields et al., 2015). We find that the -band and 3.6 m images have smaller pitch angles than the infrared 8.0 m image in all cases, in agreement with the prediction of density-wave theory. We also used images in the ultraviolet from Galaxy Evolution Explorer, whose pitch angles agreed with the measurements made at 8 m. Because stars imaged at those wavelengths have not had time during their short lives to move out of the star-forming region.
Subject headings:
galaxies: evolution — galaxies: spiral — galaxies: structure — galaxies: fundamental parameters1. Introduction
Spiral arm structure can serve as an indicator for several properties of galaxies including central bulge mass and disk surface density (Davis et al., 2015) and thus indirectly central black hole mass galaxies including central bulge mass and disk surface density (Davis et al., 2015) and thus indirectly central black hole mass (Seigar et al., 2008) as well as rotation shear (Seigar et al., 2006), rotational velocity (Savchenko et al., 2011) and weakly, bulge-to-disk ratio (Kennicutt, 1981). Evolution in spiral structure can provide clues about the evolution of the aforementioned properties.
The density-wave theory of spiral structure in disk galaxies was proposed in the mid 1960s by C.C. Lin and Frank Shu (Lin & Shu, 1964; Bertin & Lin, 1996; Shu, 2016). Their theory envisaged long-lived quasi-stationary density waves (also called heavy sound), which impose a semi-permanent spiral pattern on the face of the galactic disk. All subsequent versions of the theory agree that the density wave causes star formation to occur by compressing clouds of gas as they pass through the spiral arm.
The brightest stars created in this burst of star formation do not live long enough to travel far from the position of the spiral density waves and so the eye, when observing the galaxy in optical wavelengths, picks out the spiral pattern quite easily.
The spiral arms predicted by this theory, and those actually observed in disk galaxies, are approximately logarithmic spirals. Logarithmic spirals are characterized by a constant pitch angle that has been proposed as a quantifiable feature suitable for theory testing between different explanations for galactic spiral structure (Athanassoula et al., 2010; Martinez-Garcia, 2012; Davis et al., 2015).
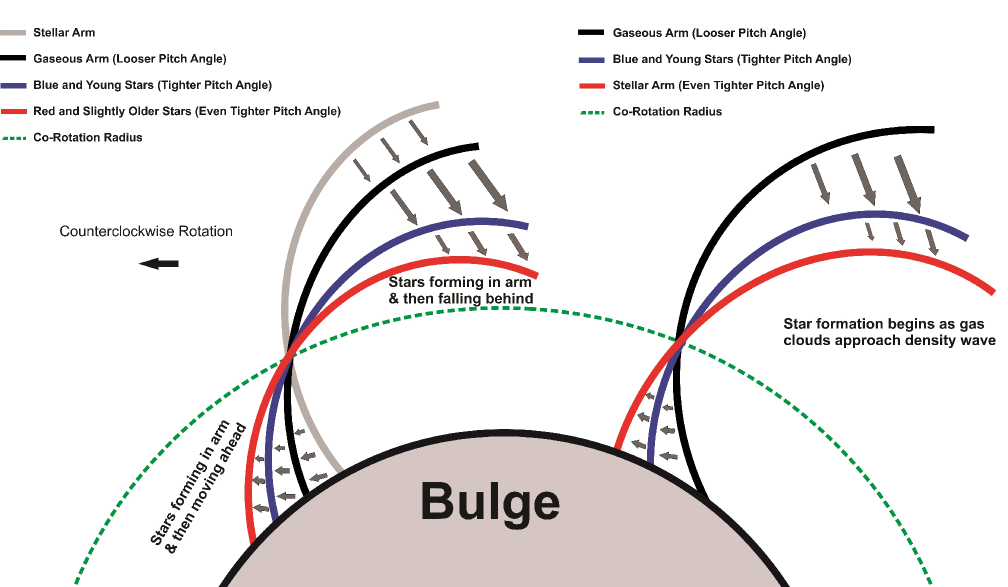
Because the spiral pattern moves as if it was a rigid pattern, it follows that the newly born stars, which are subject to differential rotation, will quickly move out of the spiral arm. In fact, since newly born stars are typically obscured from view by the warm dust-filled clouds associated with star formation (except for the very brightest UV stars), most of the new stars will be observed only when they leave the spiral arm. In the inner part of the disk, stars move faster than the spiral-arm pattern and move ahead of the density wave, while in the outer part of the disk, they fall behind(see Fig. 1). In between is the co-rotation radius where stars and the spiral arm move together.111 In practice, there are galaxies where the co-rotation radius is quite outside the region where we measure pitch angle, but the relation between pitch angles will still be as described. It thus follows that the pitch angle of the pattern formed by the newly formed stars (the bluer stars), seen in the optical, is smaller than the pitch angle of spiral shape formed by the actual star formation region (we will refer to this region as the gaseous arm), seen in the far-infrared (which is sensitive to light from the warmed dust of the star-forming region itself). In other words, the spiral pattern formed by the newly formed stars is tighter than the one formed by the gaseous arm or star-forming region (see either side of Figure 1).
The density-wave theory predicts that the pitch angle of galactic spiral arms should vary with the wavelength in which the spiral pattern is observed. This is in contrast to its main rival, the manifold theory of spiral structure, which posits that the spiral arms are the result of highly eccentric orbits of young stars (formed at the end of the galaxy’s bars) that confine the stars to motion along manifolds - tubes running across the disk. A key aspect of this theory is that the pitch angle should not vary with wavelength (Athanassoula et al., 2010).
This is an excellent opportunity for theory testing and indeed several attempts have been made to do so, with mixed results. Three studies have looked at large samples using only two wavebands in the optical or near-infrared. Two of these studies have declared that there is no discernible variation in pitch angle considering only these wavelengths (Seigar et al., 2006; Davis et al., 2012). Another study by Martinez-Garcia (2012), drew the opposite conclusion. Though it is noteworthy that the majority of galaxies measured in that paper was close to, on or even over the line of equality from the smaller number that showed the reported trend (see Fig. 11 of Martinez-Garcia (2012)). Two studies by Martinez-Garcia et al. (2014) and Grosbol & Patsis (1998) measured only five galaxies across several wavebands spanning the optical and extending into the near infrared or near ultraviolet. They did observe small differences in pitch angle in a majority of the galaxies they studied. In addition to these studies, there have been others that have looked for offsets in position between star-forming regions, stellar arms, and recently formed stars, both in the radio (Egusa et al., 2009; Louie et al., 2013) and in the optical (Kendall et al., 2008). Thus, results to date on this important question have been inconclusive, though it would have to be said that the vast majority of galaxies studied have shown no significant difference in pitch angle across optical and infra-red wavelengths.
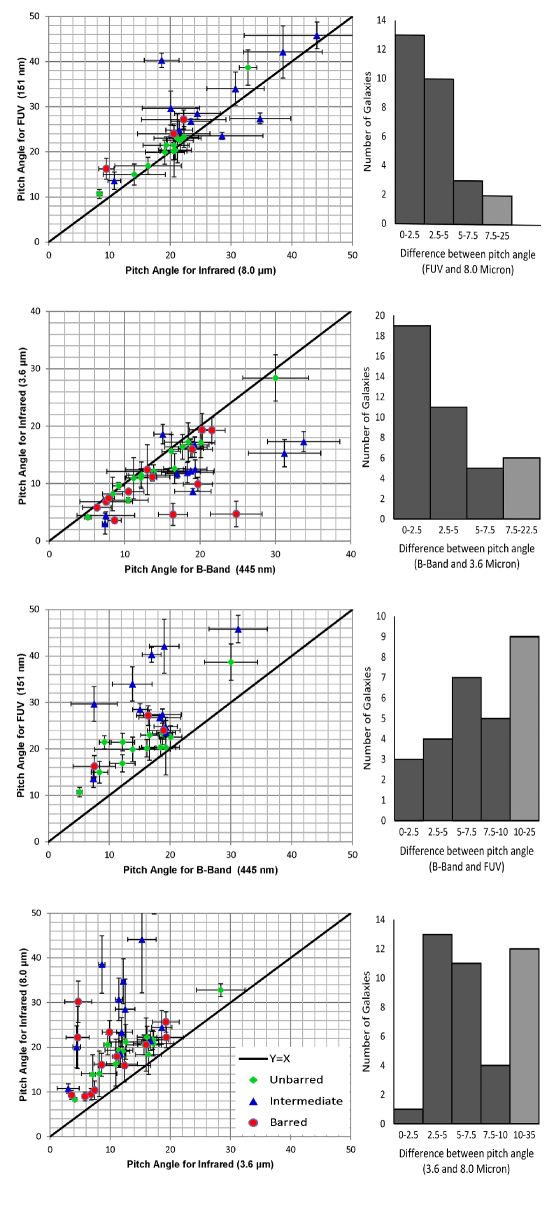
This study makes several advances over previous efforts, most importantly, the much increased range of wavelengths over which measurements are made. We make use of Spitzer images of galaxies taken at 8 and 3.6 m. At 8 m, which images warmed dust in clouds where star formation is occurring, we are capable of seeing the region of star formation in the gaseous spiral arm. The uv images from Galaxy Evolution Explorer (GALEX) show the same region, since they are sensitive to stars so young and bright that they are seen while still in their star-forming nurseries. We do indeed find that the 8 m pitch angles agree with those measured in the uv for those galaxies (a majority) for which GALEX images are available (see Fig. 2). The near-infrared and -band images are sensitive to starlight. We find that the pitch angles of these images are consistently tighter than those measured for the 8.0 m and uv images (see Fig. 2). It is clear that the -band images are showing young stars that have recently left the gaseous arm where they were formed.
Another improvement on earlier work is the large sample size. The average error in pitch angle in our sample is 2∘.5. To increase confidence in our results, we made use of two completely independent methods of measuring pitch angles. One is an established algorithm involving a 2DFFT (Davis et al., 2012) decomposition of the galactic image, and the other is a new approach that compares the spiral pattern to templates based upon a spiral coordinate system (Shields et al., 2015). We found that the two codes agree well and that our results are independent of the method of measurement used, but we report only the 2DFFT measurements in this letter.222We took great care to eliminate the bar from our measurement annulus, as discussed in Davis et al. (2012) and also used a function of Spirality (Shields et al., 2015) to check that the spiral arms in one image actually corresponded, in angular terms, to spiral arms in the other wavelength images of the same galaxy. We also made use of a third check on the results, electronically overlaying synthetic spiral arms of the measured pitch on the galaxy image to let the observer’s eye provide a check on the validity of each measurement (see Fig. 3).
A prediction of this theory is that the pitch angle of spiral arms for galaxies in blue-light wavelength images should be smaller than when imaged in deep infrared-light. Young (blue) stars born in the spiral arms of the galaxies move ahead of the density wave inside the co-rotation radius, and fall behind outside of it. The co-rotation radius is defined as the radius at which the density wave pattern speed is equal to the local rotation speed of stars (which rotate differentially with radius). This implies that blue stars should form slightly tighter arms than the density wave itself does. It means gas and dust involved in star formation should form looser arms with bigger pitch angles than blue and red stars, and blue stars should form bigger pitch angle than red and old stars (because they are short-lived and have less time in which to move ahead of and fall behind the density wave pattern). So the old stars form tighter arms in galaxies (Figure 1).
| Galaxy Name | Type | P (IRAC 3.6) | P (-band) | P (IRAC 8.0) | P (FUV Band) | Image Source |
|---|---|---|---|---|---|---|
| (1) | (2) | (3) | (4) | (5) | (6) | (7) |
| NGC 0157 | SABb | … | IRAC3.60, INT4400, IRAC8.0 | |||
| NGC 0289 | SBbc | … | IRAC3.6, CTIO4400, IRAC8.0 | |||
| NGC 0613 | SBbc | … | IRAC3.6, ESO4400, IRAC8.0 | |||
| NGC 0628 | Sac | IRAC3.6, NOT4400, IRAC8.0, GALEX1516A | ||||
| NGC 0925 | SABd | IRAC3.6, PAL4400, IRAC8.0, GALEX1516A | ||||
| NGC 1097 | SBb | IRAC3.6, LCO4400, IRAC8.0, GALEX1516A | ||||
| NGC 1353 | SBb | … | IRAC3.6, ESO4400, IRAC8.0 | |||
| NGC 1512 | SBab | … | IRAC3.6, NOT4400, IRAC8.0 | |||
| NGC 1566 | SABbc | IRAC3.6, KPNO4400, IRAC8.0, GALEX1516A | ||||
| NGC 2403 | SABc | IRAC3.6, LCO4400, IRAC8.0, GALEX1516A | ||||
| NGC 2841 | SAb | IRAC3.6, LOWE4500, IRAC8.0, GALEX1516A | ||||
| NGC 2915 | SBab | … | IRAC3.6, KPNO4400, IRAC8.0 | |||
| NGC 2976 | Sac | IRAC3.6, KPNO4400, IRAC8.0, SDSS3551A | ||||
| NGC 3031 | SAab | IRAC3.6, JKY4034, IRAC8.0, GALEX1516A | ||||
| NGC 3049 | SBab | … | IRAC3.6, CFHT4400, IRAC8.0 | |||
| NGC 3184 | SABcd | IRAC3.6, KPNO4400, IRAC8.0, GALEX1516A | ||||
| NGC 3190 | SAap | … | IRAC3.6, CTIO4400, IRAC8.0 | |||
| NGC 3198 | SBc | IRAC3.6, CTIO4400, IRAC8.0, GALEX1516A | ||||
| NGC 3351 | SBb | IRAC3.6, CTIO4400, IRAC8.0, GALEX1516A | ||||
| NGC 3513 | SBc | … | IRAC3.6, CTIO4400, IRAC8.0 | |||
| NGC 3521 | SABbc | IRAC3.6, CTIO4400, IRAC8.0, GALEX1516A | ||||
| NGC 3621 | SAd | IRAC3.6, ESO4400, IRAC8.0, GALEX1516A | ||||
| NGC 3627 | SABb | IRAC3.6, KPNO4400, IRAC8.0, GALEX1516A | ||||
| NGC 3938 | SAc | IRAC3.6, LOWE4500, IRAC8.0, GALEX1516A | ||||
| NGC 4050 | SBab | … | IRAC3.6, LCO4050, IRAC8.0 | |||
| NGC 4254 | SAc | IRAC3.6, INT4034, IRAC8.0, GALEX2274A | ||||
| NGC 4321 | SABbc | IRAC3.6, KPNO4331, IRAC8.0, SWIFT2030A | ||||
| NGC 4450 | SAab | IRAC3.6, LOWE4500, IRAC8.0, GALEX2267A | ||||
| NGC 4536 | SABbc | IRAC3.6, KP4400, IRAC8.0, GALEX1516A | ||||
| NGC 4569 | SABab | IRAC3.6, PAL4050, IRAC8.0, GALEX1516A | ||||
| NGC 4579 | SABb | IRAC3.6, KPNO4400, IRAC8.0, SWIFT2030A | ||||
| NGC 4725 | SABab | IRAC3.6, KPNO400, IRAC8.0, GALEX2267A | ||||
| NGC 4736 | SAab | IRAC3.6, PAL4400, IRAC8.0, GALEX1516A | ||||
| NGC 4939 | SAbc | … | IRAC3.6, CTIO4400, IRAC8.0 | |||
| NGC 4995 | SABb | … | IRAC3.6, LCO4050, IRAC8.0 | |||
| NGC 5033 | SAc | … | IRAC3.6, KPNO4400, IRAC8.0 | |||
| NGC 5055 | SAbc | IRAC3.6, PAL4360, IRAC8.0, GALEX1516A | ||||
| NGC 5474 | SAcd | IRAC3.6, JKY4034, IRAC8.0, GALEX1516A | ||||
| NGC 5713 | SABb | IRAC3.6, CTIO4400, IRAC8.0, GALEX1516A | ||||
| NGC 7331 | Sab | IRAC3.6, KPNO4400, IRAC8.0, GALEX1516A | ||||
| NGC 7793 | SAd | IRAC3.6, ESO4400, IRAC8.0, GALEX1516A |
Note. — Columns: (1) Galaxy name; (2) Hubble morphological type. (3) pitch angle in degrees for infrared 3.6 m; (4) pitch angle in degrees for -band 445 nm; (5) pitch angle in degrees for infrared 8.0 m; (6) pitch angle in degrees for FUV 1516 Å; (7) telescope/literature source of imaging .
2. Data and Analysis
Our sample of 41 galaxies is drawn from the Spitzer Infrared Nearby Galaxies Survey, which consists of imaging from the Infrared Array Camera (Fazio et al., 2004), selecting those galaxies with imaging at both 3.6 and 8.0 m and that had available optical imaging in the -band (445 nm) as found in the NASA/IPAC Extragalactic Database (NED; see Table 1 for -band image sources). Twenty-eight (28) of these galaxies also have available ultraviolet imaging from archived GALEX data at two wavelengths, far-UV (FUV) 1350-1780 Å and near-UV (NUV) 1770-2730 Å, as indicated in Table 1.
3. Results
Spiral-arm pitch angles of our sample galaxies were measured in three or four wavelength bands using the 2DFFT code (Davis et al., 2012) and checked with the Spirality code of Shields et al. (2015)(not reported here).
The -band images are sensitive primarily to newly born stars that have emerged from their stellar nurseries. For the images at 3.6 m it is expected that older stars dominate. By contrast, at 8.0m, we can see details of gas and dust in spiral arms (Elmegreen et al., 2011), as this waveband is sensitive to dust warmed by nearby star formation. Finally, the GALEX images at 1516 Å are sensitive to the brightest O-type stars with the shortest lives, visible while still in the star-forming region.
Our results for 28 local galaxies show that spiral arms for images at 8.0m are clearly very similar in pitch angle to the same spiral arms observed in the far-UV by GALEX (see Fig. 2, top panel). If they are different, as the histogram in Fig. 2 suggests, it is by less than 2∘.5 of pitch in most cases, which is the average error in our measurements. Similarly, as seen in the second panel of Fig. 2, the pitch angles of 41 galaxies (the entire sample) in the -band and 3.6 m images are also close to the line of equality, clustered largely within 2∘.5 of it, as the histogram shows.
By contrast, the third panel shows that the -band and Far-UV images clearly disagree in pitch angle. The -band images have consistently tighter pitch angles, with the histogram showing that they typically differ by 5∘ or more. Similarly, there is also a clear difference, in the bottom panel, between the pitch angles in the two infrared bands. Once again it is the stellar waveband (3.6 m) that is consistently tighter in pitch angle than that associated with the star-forming region (8.0 m).
4. Discussion
It is apparent from Figure 2 that the far-UV and the 8.0 m images have essentially the same pitch angle. This supports our argument that these wavebands both image the star-forming region. It forms a spiral pattern that is noticeably looser than that formed in both the -band and the 3.6 m images, which both image stars. Thus, we confirm the picture from the left-hand side of Figure 1, in which the star-forming region or gaseous arm (UV and 8.0 m) has a larger pitch angle than that formed by the bluer stars (-band) and the redder stars (3.6 m). The region just downstream from the spiral arm has just as many old disk stars as any other region of the disk, but the population has been augmented by recently formed reddish stars. Thus, even in the red or infrared, the region associated with newly formed stars is brighter than other parts of the disk. For several intermediate and barred galaxies, the difference in pitch angle in the different wavebands is very high, which may mean that the pitch angle derived is biased by the presence of a bar.
We employed a Monte Carlo technique to generate two-dimensional Gaussians about each data point (based upon the associated measurement errors) to see what were the chances of finding counter-examples to our reported trend. We find that there is on the order of a 1% chance of contradicting the claim of tighter pitch angles for the stellar sources than for the star-forming regions (Figure 2, bottom two panels). For the cases where the two bands are both sampling stellar sources (Figure 2, second panel) or star-forming regions (Figure 2, top panel), the chance of finding a contradictory result are on the order of 10%.
Our results are compatible with those in Davis et al. (2012) and Seigar et al. (2006). Both claimed to see no noticeable change in pitch angle at wavebands that image stars, Davis et al. between and bands and Seigar et al. between on the one hand and either or bands on the other. We believe this is consistent with our picture that there are fundamentally two discernible pitch angles, one that images the gaseous arm and one that images stars that have moved out from the star-forming region to form a tighter spiral pattern nearby and that crosses the gaseous arm at the co-rotation radius. We do see a modest difference between the bands at the extreme ends of this range, from -band to 3.6 m (see Fig. 2), but it is small at best.
Another study is Martinez-Garcia (2012), which compares pitch angles in and for a good-sized sample of galaxies. Although Martinez-Garcia sees an overall tendency for the -band pitches to be tighter than the -band pitches (see Fig. 11 of Martinez-Garcia (2012)), we note (as stated above) that many of his objects are consistent with an equality between the pitch angles at optical and near-infrared images.
Our results are not compatible with the claim made by both Martinez-Garcia et al. (2014) and Grosbol & Patsis (1998) that they see a tendency for pitch angles to be tighter at blue wavelengths than at red. Broadly speaking, we see the opposite, looser spirals in the ultraviolet, growing tighter in the blue, and perhaps tightening a little further into the red. We find, nevertheless, that there is some important common ground between our work and that of Martinez-Garcia et al. (2014).
Grosbol and Patsis claim a difference in pitch angle, for four objects 333Grosbol and Patsis measure five galaxies but only have -band measurements for four of them., between the -band and the I band, which is tighter in for all four. In Fig. 1 we present the results of Davis et al which also measures -band versus -band for a larger sample of galaxies. The reader will note that none of Grosbol and Patsis’ objects are exceptional in this sample. They are close to galaxies with a similar difference between and as measured by Davis et al. But the over all spread of Davis et al’s results straddles the line of equality. Thus we believe that a larger sample in Grosbol and Patsis would have shown a similar result, that there is no significant difference in pitch angle between the and bands. They claim an even larger difference between and , in disagreement with the much larger sample of Seigar et al, who see no consistent tendency for or to be tighter than the other. Our difference between B and 3.6 m is the opposite to that claimed between and by Grosbol and Patsis (they see as the tighter pitch, we see it as looser). We do not have high quality images in for a direct comparison. We do note that our measurements in B for two of their objects agree reasonably well with theirs, so this is not simply the result of two different methods of measuring pitch angle.
We agree completely with one key result of Martinez-Garcia et al. (2014): that pitch angles in images taken at the line agree well with the pitch measured in the band. They argue that these images are capturing the star-forming region. We agree since we have measured some of our objects in the band and find results in agreement with those given here for the UV and 8.0 m bands. Therefore, it seems likely that both they and we are successfully imaging the gaseous arm in a number of different widely separated wavebands. However, they find that images in the , , , and bands tend to show tighter pitch angles, compared to and . So, contrary to us, they claim that the stellar pitch angles are tighter than the pitch angle of the gaseous arm where stars are formed.
Their analysis, which is based on the theoretical work of Kim & Kim (2013), is that their red bands are imaging the stellar spiral arm where the density wave causes old disk stars to crowd closer together. The pitch angle of this “stellar arm” should be the largest because the density wave moves in a fixed pattern. Everything else moves ahead of the stellar arm when inside the co-rotation radius and falls behind outside of it, as illustrated in Fig. 1 (this is a simplified account, but qualitatively matches the more complex picture coming from density-wave theory, as seen in Kim & Kim (2013). The stellar arm is where gas clouds passing through the density wave begin their collapse (gray arm in Fig. 1). A short while later their gravitational collapse has proceeded to the point where they are giving birth to stars. By this time they have moved to a new position that is referred to as the gaseous arm (black arm in Fig. 1). Because the stellar arm and the gaseous arm cross each other at the co-rotation radius, Martinez-Garcia et al. (2014) and Grosbol & Patsis (1998) are looking for a gradient of this type: red spiral arms tighter than blue. Equivalently, the stellar arm is tighter than the gaseous arm, as depicted in Fig. 7 of Kim & Kim (2013), which is based upon complex theoretical modeling of the dynamics within the spiral arm created by the density wave.
We interpret our results, in contrast, not as the result of a gradient across the spiral arm itself, but a gradient produced by migration of new stars, born inside the spiral arm, as they pass out of it. As Martinez-Garcia et al. (2014) say in their paper, speaking about the stars born in the spiral arm, “these young stars will then gradually age, as they leave the place where they were born, and produce a gradient toward the red in the opposite direction.” That is to say, when we image the stars that originate in the star-forming region, these stars will have moved further on from that region (ahead in the inner disk, behind in the outer disk) and so the pitch angle gradient will be, as they say, in the opposite direction: UV stars will have the loosest pitch, blue stars a tighter pitch. This is, of course, exactly what we see in our sample. In fact, the reddest stars in our sample may have the tightest pitch angle of all. We conclude, therefore, that these are also stars born in the spiral arm that have migrated out of it. We stress, however, that this issue is not critical to the confirmation of the density-wave theory. It is sufficient to note the difference in pitch angle between the newly born blue stars and the 8.0 m and UV images that sample the gaseous spiral arm.
One possible interpretation is that our 3.6 m images are not capturing the old stars in the “stellar arm” (gray line in Fig. 1). Since our 3.6 m images are, if anything, slightly tighter than the -band images, we might interpret this as evidence that these stars are also recently born. Of course, they mingle with and augment the light from a population of older disk stars that themselves just passed through the spiral arm. Thus, we are seeing the “gradient … in the opposite direction” referred to in Martinez-Garcia et al. (2014). Rather than seeing a color gradient within the spiral arm itself we may be seeing a color gradient created by stars moving downstream from their formation within the spiral arm.
Another interpretation is possible, however, based upon the notion, proposed in some versions of density-wave theory (Roberts, 1969; Gittins & Clarke, 2004), that the star formation begins to occur as the gas clouds approach the density wave (see the right-hand side of Figure 1). In this case, the gaseous or star formation arm should have a looser pitch angle than the stellar arm consisting of old red disk stars concentrated by the density wave, which is what we see. New blue stars formed in the gaseous arm move downstream as described earlier and end up close to the position of the stellar arm. This scenario is clearly compatible with our results.
We hope that in future work we may decide between these two interpretations by studying individual galaxies and their dynamics in more detail to determine which fits better with observations. In this context, it is worth noting that a few galaxies in Fig. 2, all barred, have very large changes in pitch angle that are hard to reconcile with either scenario. These anomalies could be due to difficulties in measurement (pitch angles of these galaxies all have large error bars). Increasing the sample size may help in identifying the reason for these odd results.
Regardless of the interpretation, we find our results to be a strong confirmation of the density- wave theory. The model that our results support is one in which a star-forming region rotating with a fixed spiral pattern gives birth to stars that move downstream from the spiral arm, with a pitch angle altered by shear (differential rotation). This is a prediction of the density-wave theory that is not replicated by its rivals. The strongest competitor to the density-wave theory currently is the manifold theory. As noted by Athanassoula et al. (2010), this theory finds that the spiral patterns are formed by stars moving along orbital trajectories within certain elliptical manifolds. It predicts that all stars and gas should move together, with no color gradient. This is contrary to the evidence we present in this letter.
Images from deep infrared wavelength (3.6 and 8.0 m) unlike images taken at optical wavelengths show us the spiral arms patterns traced by old stars (near-infrared) and gas and dust (far-infrared). For each galaxy we used an optical wavelength image (-band: 445 nm) and another image from the Spitzer Space Telescope in the deep infrared range and we measured the pitch angle with the 2DFFT code and a completely independent code called Spirality (which uses templates with Fourier transforms to measure pitch angle). Our results for 41 NGC galaxies show that spiral arms for images with optical wavelength 445 nm (more details of blue stars) are clearly tighter than spiral arms in infrared wavelength 8.0 m (more details of gas and dust (Elmegreen et al., 2011)) in all cases and spiral arms for images with infrared wavelength 3.6 m (more details of red and old stars (Elmegreen et al., 2011)) are clearly tighter than spiral arms in optical wavelength 445 nm (more details of blue stars), in agreement with the prediction of density wave theory (Figure 1).
References
- Athanassoula et al. (2010) Athanassoula, E., Romero-Gómez, M., Bosma, A. and Masdemont, J. J. 2010, MNRAS, 407, 1433-1448
- Bertin & Lin (1996) Bertin, G. & Lin, C. C. 1995, Spiral structure in galaxies a density wave theory, The MIT Press
- Davis et al. (2015) Davis, B. L., Kennefick, D., Kennefick, J., Kyle, B. W., Shields, D. W. 2015, ApJ, 802, L13
- Davis et al. (2012) Davis, B. L., Berrier, J. C., Shields, D. W., Kennefick, J., Kennefick, D., Seigar, M. S., Lacy, C. H. S., & Puerari, I. 2012, ApJS, 199, 33
- Egusa et al. (2009) Egusa, F. and Kohno, K. and Sofue, Y. and Nakanishi, H. and Komugi, S. 2009, ApJ, 697, 1870
- Elmegreen et al. (2011) Elmegreen, D. M., Elmegreen, B. G., Yau, Andrew, et al. 2011, ApJ, 737, 32
- Fazio et al. (2004) Fazio, G. G., Hora, J. L., Allen, L. E., et al. 2004, ApJS, 154, 10
- Gittins & Clarke (2004) Gittins, D. M. and Clarke, C. J. 2004, MNRAS, 349, 909-921
- Grosbol & Patsis (1998) Grosbol, P. J. & Patsis, P. A. 1998, A&A, 336, 840
- Kendall et al. (2008) Kendall, S. and Kennicutt, R. C. and Clarke, C. and Thornley, M. D. 2008, MNRAS, 387, 1007-1020
- Kennicutt (1981) Kennicutt, Jr., R. C. 1981, AJ, 86, 1847
- Kim & Kim (2013) Kim, Y. and Kim, W.-T. 2013, MNRAS, 440, 208-224
- Lin & Shu (1964) Lin, C. C. and Shu, F. H. 1964, ApJ, 140, 646
- Louie et al. (2013) Louie, M. and Koda, J. and Egusa, F. 2013, ApJ, 763, 94
- Martinez-Garcia (2012) Martínez-García, E. E. 2012, ApJ, 744, 92
- Martinez-Garcia et al. (2014) Martínez-García, E. E. and Puerari, I. and Rosales-Ortega, F. F. and González-Lópezlira, R. A. and Fuentes-Carrera, I. and Luna, A. 2014, ApJ, 793, L19
- Roberts (1969) Roberts, W. W. 1969, ApJ, 158, 123
- Seigar et al. (2006) Seigar, M. S., Bullock, J. S., Barth, A. J., & Ho, L. C. 2006, ApJ, 645, 1012
- Seigar et al. (2008) Seigar, M. S., Kennefick, D., Kennefick, J., & Lacy, C. H. S. 2008,ApJ, 678, L93
- Savchenko et al. (2011) Savchenko, S. S., and Reshetnikov, V. P. 2011, AstL, 37, 817
- Shields et al. (2015) Shields, D. W., Davis, B. L., Pour-Imani, Hamed., Kennefick, D., & Kennefick, J. 2015, arXiv:1511.06365
- Shu (2016) Shu, Frank H. 2016, Six Decades of Spiral Density-Wave Theory, Annual Review of Astronomy and Astrophysics, Vol 54, Sep 2016