THE ABUNDANCE OF LITHIUM IN AN AGB STAR IN THE GLOBULAR CLUSTER M3 (NGC 5272)
Abstract
A survey of red giants in the globular cluster M3 with the Hydra multi-object spectrograph on the WIYN 3.5-m telescope indicated a prominent Li I 6707 feature in the red giant vZ 1050. Followup spectroscopy with the ARC 3.5-m telescope confirmed this observation and yielded a derived abundance of A(Li)NLTE = 1.6 0.05. In addition, the high oxygen and low sodium abundances measured from the same spectrum suggest that vZ 1050 is a first generation cluster star. The location vZ 1050 above the horizontal branch and blueward of the red giant branch in the cluster’s color-magnitude diagram places vZ 1050 on M3’s asymptotic giant branch. The likely source for the enhanced lithium abundance is the Cameron-Fowler mechanism operating in vZ 1050 itself.
Facility: WIYN: 3.5m (Hydra), ARC: 3.5m (ARCES)
1 Introduction
Since the discovery of the first lithium-rich red giants in globular clusters (NGC 362: Smith et al. 1999, M3: Kraft et al. 1999), similar lithium rich giants have been identified in other clusters, including a second lithium-rich red giant in NGC 362 (D’Orazi et al. 2015) and one in NGC 4590 (Ruchti et al. 2011). Studies of lithium in main sequence turnoff stars in globular clusters have also found Li-rich stars even at this earlier evolutionary phase (M92: Boesgaard et al. 1998, NGC 6397: Koch et al. 2011; M4: Monaco et al. 2012). Koch et al. discovered a turnoff star in the metal-poor globular cluster NGC 6397 with a lithium abundance A(LI)NLTE = 4.0, significantly higher than both the predictions of Big Bang nucleosynthesis (Cyburt et al. 2008) and the observed lithium abundance in unevolved halo metal-poor stars (Sbordone et al. 2010). Domínguez et al (2004) and Kirby et al. (2012) discovered 15 Li-rich, metal-poor giants in dwarf spheroidal galaxies near the Milky Way. Kirby et al. provide a preliminary estimate of 0.85% for the frequency of super-litihum-rich red giants in dwarf spheroidal galaxies, consistent with the 1% frequency of occurance of lithium rich giants in Galactic stellar populations (Brown et al. 1989, Ruchti et al. 2011).
Many authors have reprised discussions of lithium dilution and depletion as stars evolved from the main sequence to the red giant branch and beyond (see, for example, Kirby et al. 2012 and 2016, or D’Orazi et al. 2015 and references therein). High lithium abundances in dwarf and giant stars are usually inconsistent with the standard model of stellar evolution, and several authors have proposed explanations for their origin. Monaco et al. (2012) offer two alternatives to explain the presence of a lithium-rich dwarf star in the globular cluster M4, either that the star has preserved lithium from its formation (while other stars of the same temperature in the cluster have not) or the excess lithium results from mass transfer from a former asymptotic giant branch (AGB) companion. Koch et al. (2011) consider that the lithium-rich turnoff star in NGC 6397 could have resulted from mass transfer from a former red giant companion star that underwent cool-bottom processing (CPB; Wasserburg et al. 1995), but also propose other mechanisms, including possible diffusion of lithium to the surface.
Wasserburg et al. (1995) and Boothroyd et al. (1995) computed models with enhanced mixing to explore CPB and hot-bottom burning (HBB) in low mass stars. They explored and predicted changes in the surface compositions of stars due to deeper mixing in each case. Sackmann & Boothroyd (1999) examined the effect of CBP on the abundances of light elements, and specifically on the abundance of lithium in low mass red giants. They found that CBP in red giants could produce surface lithium abundances as high as A(Li) = 4111A(x) = 12 + log n(x)/n(H), where n(x) is the number density of atoms of species x and n(H) is the number density of H atoms. through the Cameron-Fowler conveyor (Cameron & Fowler 1971) with appropriate tuning of the mixing mechanism.
Palacios et al. (2001) proposed a scenario to explain anomalously high lithium abundances in giants above the red giant luminosity function bump (LFB). Under certain conditions, newly synthesized lithium from the star’s interior adds to a star’s energy production. Palacios et al. argue that rotation-induced mixing can occur when the hydrogen burning zone reaches the molecular weight discontinuity following the first dredge-up. The extra mixing brings 7Be upwards, where it decays to 7Li. The 7Li reacts with protons in a thin ”lithium burning shell,” increasing the luminosity of the star by perhaps a third. Palacios et al. suggest that the energy release from the lithium burning shell also enhances transport of processed material into the convective zone, raising the surface lithium abundance. The high surface lithium abundance is only temporary, however, since the star returns to its normal structure after a lithium burning episode, and the fresh lithium is eventually destroyed as it passes through the deep regions of the convective zone.
D’Orazi et al. (2015) identified a lithium-rich giant close to the LFB in the globular cluster NGC 362, but cannot confirm whether the star is on the red giant branch or on the pre-zero-age horizontal branch. If the former, D’Orazi et al. suggest that the lithium could have been brought to the surface through enhanced mixing at the LFB bump, while if the latter, synthesis during the helium flash could have occurred. Ruchti et al. (2011) found eight lithium-rich metal poor giants in a survey of over 700 metal-poor giants, and determined that the composition of the lithium-rich stars is similar to that of normal stars. They suggest that the high lithium results either from extra mixing at the LFB or from cool bottom processing in the AGB phase. Kirby et al. (2012) argue that lithium enrichment through enhanced mixing following the luminosity function bump is a short-lived phase shared by all metal-poor red giants. They suggest that a high surface lithium phase that lasts 1% of a giant’s lifetime above the bump could explain the fraction of high lithium stars observed.
More recently, Kirby et al. (2016) reported on a survey of nearly 1800 RGB and AGB stars in 25 clusters. They provide clear criteria for designating a star as lithium-rich and found that only one in 500 cluster RGB stars are lithium-rich, while 1 in 60 AGB stars can be classified as lithium-rich. They reviewed scenarios to produce the lithium enhancement, including planet engulfment, self-enrichment through the Cameron-Fowler conveyor, and binary mass-transfer. Kirby et al. conclude that deep mixing at the helium core flash could explain the high lithium abundances in HB and AGB stars, and that binary mass transfer from post-core-flash stars could account for lithium-rich RGB stars.
We report here the detection of a prominent Li I 6707 Å feature in the low mass, metal-poor, red giant star vZ 1050 in the globular cluster M3. In Section 2 we describe our observations and data reduction, while in Section 3 we discuss our analysis methods and the resulting abundances of elements, including lithium, in vZ 1050. Scenarios for the origin of the high lithium abundance are reviewed in Section 4, and our conclusions are summarized in Section 5.
2 Observations and Data Reductions
The M3 giant vZ 1050 (J2000: 13h 43m 15.17s, +28∘ 21’ 10.61”) in the globular cluster M3 (von Zeipel 1908; also known as K666 from Kustner 1922 and SK 291 from Sandage & Katem 1982) was included in a sample of stars observed with the Hydra multi-fiber spectrograph on the WIYN 3.5 m telescope on Kitt Peak. These observations were described and analyzed by Johnson et al. (2005), although the star vZ 1050 was not included in their analysis, most likely because infrared photometry is not available for the star. The Hydra spectrum of vZ 1050 reveals a strong feature of Li I at 6707 Å . Followup observations of vZ 1050 were obtained with the 3.5 m telescope at the Apache Point Observatory in May, 2014, using the ARCES echelle spectrograph (Wang et al. 2003). These higher resolution, higher S/N ratio observations are analyzed here.
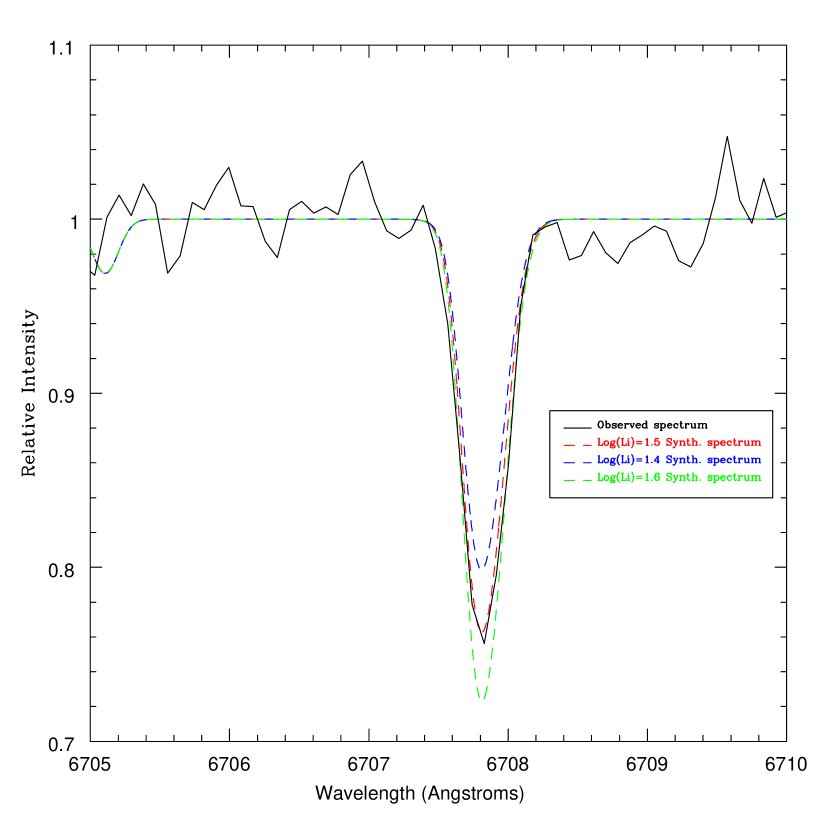
The ARCES echelle spectrograph provides wavelength coverage from 3500 Å to 10,000 Å with a resolving power of R = 31,500 (2.5 pixels) using the 1.6” x 3.2” slit. Two 3600s observations of vZ 1050 were obtained on 18 and 19 May 2014, for a total integration time of 7200 seconds. Images were bias corrected, flat-fielded, cleaned and extracted to one dimensional spectra, wavelength calibrated, continuum normalized, and combined to a single spectrum using IRAF222IRAF is distributed by the National Optical Astronomy Observatory, which is operated by the Association of Universities for Research in Astronomy, Inc., under cooperative agreement with the National Science Foundation.. At wavelengths longer than 5000 Å the signal-to-noise ratio of the final, reduced spectrum is typically 75 near the center of the orders, but declines to near 50 at the edges and to shorter wavelengths. The spectrum of vZ 1050 at the Li I feature is shown in Figure 1, along with synthetic spectra that will be discussed in the next section.
Tucholke et al. (1994) indicated that vZ 1050 is a 98% probable member of M3, and Pilachowski et al. (2000) reported a radial velocity of –150 km s-1, consistent with the star’s membership in M3. Photometry from Sandage and Katem (1982) provides a V magnitude for the star of V=14.23 0.031, with a B-V color of B-V=0.93 0.039. Tucholke et al. (1994) give a B magnitude of 15.16, consistent with the Sandage and Katem photometry. No K magnitude is available in SIMBAD. We adopt a distance modulus (m-M)V = 15.07 and a reddening E(B-V) = 0.01 from Harris (1996, updated 2010).
3 Analysis and Abundances
We determine the abundance of several elements in vZ 1050 under the assumption of local thermodynamic equilibrium using the MOOG spectrum synthesis program (Sneden 1973, 2014 version). We adopted the Yong et al. (2014) line list and gf values for the analysis. Equivalent widths were measured using the splot routine in IRAF and equivalent widths were used to determine the abundances of most species (exceptions are noted below). The equivalent widths for the spectral lines used are provided in Table 1, which also includes the gf values, line excitation potentials, and the wavelengths of the spectral lines used.
Model atmospheres for vZ 1050 were interpolated in the MARCS333The interpolation of models utilized code provided by Masseron (2006, http://marcs.astro.uu.se/software.php). grid (Gustafsson et al. 2008). Approximate initial atmospheric parameters were estimated from vZ 1050’s color and V magnitude and were refined by minimizing trends of abundance vs. excitation potential using Fe I lines and vs. equivalent width using Fe I lines. Fe I and II lines were used to fix the surface gravity. Ti I and Ti II lines could provide second estimate of the gravity, but in practice, the Ti I lines scatter widely and the number of reliable lines is small. The resulting Ti abundances from Ti I and Ti II lines are within a standard deviation. Changes of 100K in temperature and 0.2 km s-1 in microturbulence from the adopted values are sufficient to introduce noticeable trends.
The final adopted atmospheric parameters for vZ 1050 are Teff = 4800 100 K, log g = 1.8 0.3, [Fe/H] = -1.5 0.1, and vT = 1.1 0.2 km s-1, consistent with the star’s position in M3’s color magnitude diagram. Our derived abundances for vZ 1050 are given in Table 2, along with the statistical standard deviation of the measurements for each speccies and the number of lines used for each species. For species with two or fewer lines measured, we have estimated the uncertainty based on the dispersion for similar species.
3.1 Metallicity
The iron abundance of vZ 1050 was found to be [Fe/H] = –1.51 0.05 (standard error of the mean) from 71 Fe I lines. The abundance from 16 Fe II lines is similar: [Fe/H] = –1.48 0.05. Sneden et al. (2004) found an abundance of [Fe/H] = –1.58 0.06 from the Fe I lines and [Fe/H] = –1.45 0.03 from Fe II lines for their sample of 23 red giants observed with the Keck telescope. Our Fe I and Fe II abundances are consistent with those reported by Sneden et al., where determinations for individual stars range from –1.71[Fe/H]–1.50 for Fe I and from –1.50[Fe/H]–1.40 for Fe II.
Other metals analyzed include alpha elements Mg, Si, Ca, and Ti; the odd element Sc; and the transition metals V, Cr, Mn, Ni, and Zn. The alpha element abundances are similar to other M3 giants reported by Sneden et al. (2004), with [metal/Fe] ratios of [Ti I/Fe] = 0.37, [Ti II/Fe] = 0.22, [Ca/Fe] = 0.23, [Mg/Fe] = 0.11, and [Si/Fe] = 0.25. As in the Sneden sample, Sc is slightly deficient. The iron group metals scatter around [metal/Fe] = 0.0. In Figure 2, our derived [metal/Fe] ratios (filled circles with error bars) are plotted against atomic number along with the average [metal/Fe] values for the sample of stars studied by Sneden et al. (2004) (open circles). As shown in Figure 2, we derive similar abundances for most elements, within the range of our uncertainties.
3.2 Lithium
The lithium abundance can be determined from the Li I 670 Å doublet using spectrum synthesis. The strength of the Li I feature places vZ 1050 among the small population of Li-rich giants found in globular clusters. In the region of the Li feature at 6700 Å in the observed spectrum, the S/N ratio is 70. We adopted the Reddy et al (2002) line list for the Li region; this list includes several known features that may blend with the Li I feature, including CN, Sm II, V I, Cr I, Ce II, Ti I, and Ca I. The equivalent width of the Li I feature is 95 mÅ , significantly stronger than any of the possible blends, which make little contribution to the overall strength of the feature. Our best fit synthesized spectrum in Figure 2 indicates an LTE lithium abundance of A(Li) = 1.52 0.05. A second Li I feature at 6103 Å may be present in our spectrum, but at a temperature of Teff = 4800 K the 6103 Å feature too weak to measure. An upper limit of A(Li) = 1.5 is consistent with the observed noise in this spectral region. A 6Li/7Li ratio of 10% was assumed in fitting the Li I feature, and this abundance represents the total lithium abundance in vZ 1050. The resolution of our spectrum is not sufficient to measure the isotope ratio directly. Figure 2 also includes two additional synthetic spectra at values of A(Li)LTE = 1.4 (blue dashed) and 1.6 (green dashed). Changes in the input lithium abundance of the synthetic spectrum of more than 0.05 dex from our nominal value are clearly incompatible with the observed spectrum.
Corrections to the abundance of lithium for departures from local thermodynamic equilibrium (LTE) have been computed by Lind et al. (2009). For stars with atmospheric parameters similar to those of vZ 1050, the corrections are 0.08 dex, in the sense A(Li) = A(Li)NLTE-A(Li)LTE. Applying this correction to our LTE abundance gives an abundance A(Li)NLTE=1.600.17, taking into account the uncertainties in the model parameters as well as the observational uncertainties.
The Kirby et al. (2016) criterion identifies stars as lithium-rich if their abundances are above A(Li)NLTE = 1.1 at the absolute magnitude of vZ 1050. The relatively high abundance confirms that vZ 1050 is a second Li-rich giant in M3, in addition to the RGB star IV-101 (Kraft et al. 1999).
3.3 Oxygen
The oxygen abundance can be determined from the [O I] feature at 6300 Å using spectrum synthesis. In this region, the S/N ratio of our spectrum is 75. The region is sprinkled with telluric O2 and H2O features, but the radial velocity of M3 fortuitously shifts the [O I] feature to a clean region between telluric lines. Our stellar line list, derived from the Kurucz & Bell (1995) line list via Sneden’s “fixlines.f” program, includes Ni I feature at 6300.33 Å and the nearby Sc II feature at 6300.68 Å , as well as features of Fe, Mn, Ce, and Cr that are too weak to be seen in the synthetic spectrum.
Comparing the observed spectrum with synthetic spectra computed for a range of oxygen abundances, we derive a value of A(O) = 7.7 0.1 from our LTE, 1D analysis. This analysis was carried out using values of the carbon abundance [C/Fe] = –0.5, 0.0, and +0.5, with no change to the derived abundance of oxygen. The relatively high abundance of oxygen suggests that vZ 1050 is an oxygen-rich, first generation star.
3.4 Sodium
The sodium abundance serves as a proxy for determining whether vZ 1050 belongs to the first generation of stars formed in M3 or to a subsequent generation. Gratton et al. (2012) have shown that a weak sodium abundance is characteristic of first generation stars, while subsequent generations form with higher sodium abundances.
The sodium abundance in vZ 1050 has been determined from three spectral lines, 5688, 8183, and 8194 Å . The lines at 6154 and 6160 Å are too weak to measure at the S/N ratio of our spectrum, and the 5682 feature is unmeasurable due to a defect in the spectrum. Atomic line parameters for the 8183 and 8194 Å features, which are not included in the Yong et al. line list, were obtained from Dobrovolskas et al. (2014). Non-LTE corrections from Dobrovolskas et al. and Lind et al. (2011) were applied to the LTE abundances. The 8183 and 8194 Å features are particularly sensitive to NLTE effects, with corrections of –0.45 dex, while the 5688 Å feature is relatively less sensitive, with an NLTE correction of –0.15 dex. After the NLTE corrections are applied, the three features used are in close agreement and suggest the abundance of sodium is [Na/Fe] = –0.5 0.1, comparable to the lowest sodium abundances found by Johnson et al. (2005) for M3 giants444Johnson et al. employed NLTE corrections from Gratton et al. (2000). For comparison of vZ 1050 with other M3 giants, we have used the Johnson et al. LTE sodium abundances with the NLTE corrections from Lind et al. 2011)..
The low abundance of sodium in vZ 1050 confirms that it belongs to the first generation of stars formed in M3. In contrast, the lower oxygen abundance and higher sodium abundance of M3’s other Li-rich giant IV-101 (Kraft et al. 1999) suggest it belongs to a subsequent generation. Both stars are plotted with other M3 giants from Sneden et al. (2004) in Figure 3, showing [Na/Fe] vs. [O/Fe]. Note that to be consistent with published work, we have plotted the LTE abundance for [Na/Fe] without NLTE corrections. The two stars clearly arise from different populations in M3.
3.5 Heavy Elements
While our spectrum extends below 4000 Å, we have (mostly) restricted our line list to transitions above 5000 Å to avoid regions with low S/N ratio and heavy line blending. Specific features used for the determination of heavy element abundances are included in Table 1, and the derived abundances from an LTE equivalent width analysis are included in Table 2, along with the number of lines used.
Sneden et al. (2004) include determinations of Ba, La, and Eu abundances for 23 giants in M3. They find average abundances of [Ba/Fe] = +0.21, [La/Fe] = +0.09, and [Eu/Fe] = +0.54, with star-to-star variations of several tenths of a dex. Within uncertainties, the Ba, La, and Eu abundances we obtain are consistent with the spread of abundances observed by Sneden et al. (2004). On average, they found the barium and lanthanum abundances in M3 giants to be enhanced compared to field stars with the same metallicity.
In addition to Ba, La, and Eu, we have determined abundances for Sr (from Sr I 4607 Å), Y II, Ce II, Nd II, and Sm II. Ce, Nd, and Sm are all high, consistent with the abundances of Ba and La. The abundances of Sr and Y appear to be low, although the number of lines for these species is small. Overall, the neutron capture element abundances for vZ 1050 appear to fall within the normal range for M3 giants, and do not show a notable excess compared to other M3 giants. The normality of these elements hints that mass transfer from a former AGB companion undergoing thermal flashes is unlikely to be the source of the enhanced lithium.
3.6 Uncertainties
The sensitivity to errors in the atmospheric parameters listed in Table 3 was determined by varying each parameter by the amount we estimate to be the uncertainty in that parameter, and recalculating the abundance. The lithium abundance A(Li) is relatively sensitive to temperature, varying by 0.14 dex per 100 K change in temperature. Our results are relatively insensitive to errors in [Fe/H] and microturbulence. The abundances of Fe II and [O I] are modestly sensitive to the adopted surface gravity.
4 Results
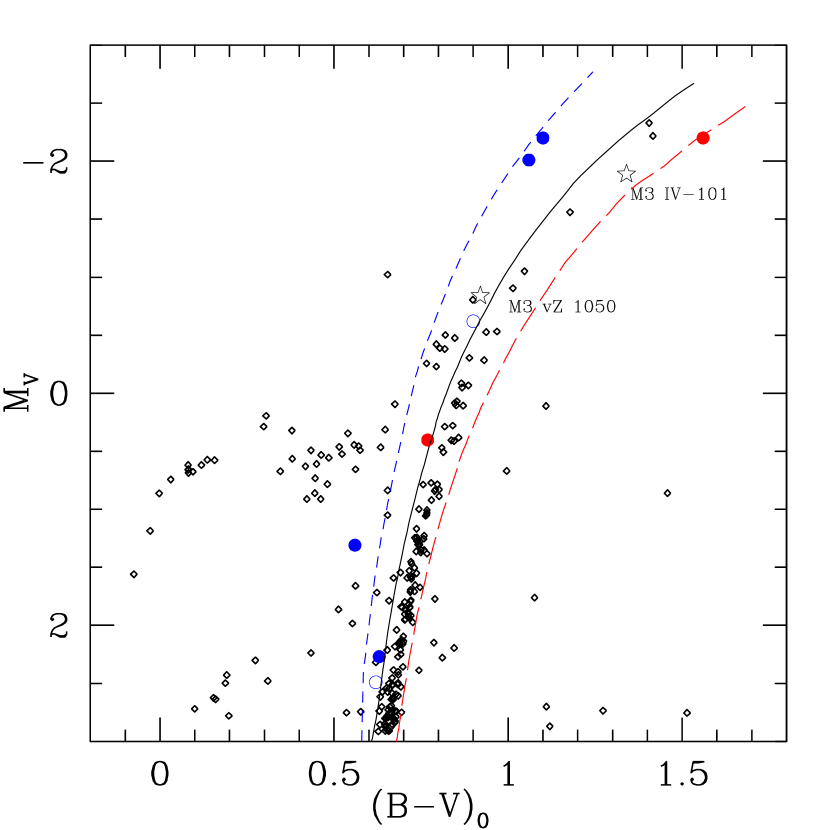
The star vz 1050 in M3 joins a relatively small group of lithium-rich giants known in globular clusters, including its sibling IV-101 in the same cluster (Kraft et al. 1999). In Figure 4, we plot the location of vZ 1050 in the MV,(B-V)0 color-magnitude diagram of M3, using photometric data for M3 giants from Rey et al. (2001). Since the Rey et al. fields do not include vZ 1050, its V magnitude and B-V color are taken from Sandage & Katem (1982). These authors indicate that the uncertainty on the B-V color of vZ 1050 is 0.039 mag, higher than its separation from the ridgeline of RGB stars. The absolute magnitudes and dereddened colors have been obtained using a distance modulus of m-M = 15.07 and reddening E(B-V) = 0.01 from Harris (1996, updated in 2010). The position of vZ 1050 relative to the red giant branch suggests the star is likely to be an asymptotic giant branch (AGB) star.
Also plotted in Figure 4 are the positions of the several previously known lithium-rich giants in globular clusters. Photometry for M3 IV-101 (Kraft et al. 1999) has been corrected using the same distance modulus and reddening as for vZ 1050. Photometry for NGC 362 giants 15370 (D’Orazi et al. 2015) and V2 (Frogel et al. 1983) has been corrected using a distance modulus m-M = 14.82 and reddening E(B-V) = 0.05 from the Harris Catalog (1996, 2010 edition). We note that Eggen (1972) found an amplitude of V = 0.8 mag and a range of (B-V) = 0.1 with a period of 90 days for this red variable star. For A-96 in NGC 4590 (Ruchti et al. 2011), we used a distance modulus m-M = 15.21 and E(B-V) = 0.05, again from the Harris Catalog, to plot the photometry of Alcaino (1977). Stars identified by Kirby et al. (2016) are also included.
For guidance, we have also plotted isochrones for metallicities of [Fe/H] = -2.2 (blue), [Fe/H]=–1.7 (black), and [Fe/H]–1.3 (red) from Bertelli et al. (2008). The isochrones are computed at Y=0.26 and with log (Age) = 10.15. For reference, Harris (1996, updated 2010) lists the metallicity of NGC 4590 to be [Fe/H]=–2.2, of NGC 362 to be [Fe/H]=–1.3, and of M3 to be [Fe/H]=–1.5.
Kirby et al. (2016) summarize the evolutionary state of the known lithium-rich globular cluster giants. Four lie on the lower RGB, while others may be upper RGB or AGB stars. As D’Orazi et al. (2015) note, star 15370 in NGC 362, with a lithium abundance A(Li) = 2.4, lies clearly on its cluster’s red giant branch, just above the LFB. NGC 362’s V2, NGC 4590’s A-96, and M3’s IV-101 all lie near the tips of their respective red giant branches. In contrast, vZ 1050, with A(Li)=1.5, lies blueward of M3’s RGB, and can be classified as a likely early AGB star. Kirby et al. (2016) find that only 0.2% of RGB stars are lithium-rich, while a much higher percentage, 1.6%, of AGB stars qualify as lithium-rich.
As discussed in Section 1, several pathways have been described in the literature to account for the relatively rare, lithium-rich giants in globular clusters. Kirby et al. (2012) argue that since 1% of cluster stars more luminous than the red giant LFB display Li abundances higher than predicted by stellar evolution models, all such red giants may evolve through a short-lived phase resulting from in situ lithium production, followed by rapid lithium depletion. Kirby et al. (2016) provide a more nuanced analysis, suggesting a scenario in which the higher fraction of lithium-rich AGB stars results from a common but short-lived enrichment phase associated with or following the helium flash. While the Cameron-Fowler conveyor provides a transport mechanism, the proximate cause of the required deep mixing remain vague. Kirby et al. suggest that the rarity of lithium-rich stars at earlier evolutionary phases can be explained if they result from mass transfer from more massive, and more evolved companions. The absence of any s-process enhancement in M3 vZ 1050, however, may not be consistent with this scenario.
5 Summary
In summary, the star vZ 1050 in the globular cluster M3 is found to be lithium-rich, with a lithium abundance of A(Li)NLTE = 1.6 0.05. The star’s radial velocity confirms its membership in the cluster, and its absolute magnitude and color suggest that vZ 1050 is ascending the red giant branch for the second time as an AGB star. The abundances of the alpha, transition metal, and neutron capture elements in the atmosphere of vZ 1050 are typical of the abundances of other M3 giants. The star does show a high oxygen and low sodium abundance compared to other M3 giants, however, consistent with vZ 1050 belonging to the first generation of stars formed in M3. The origin of its lithium enhancement likely results from the in situ operation of the Cameron-Fowler mechanism.
References
- Alcaino [1977] Alcaino, G. 1977, A&AS, 29, 9
- Bertelli et al. [2008] Bertelli, G., Girardi, L., Marigo, P., & Nasi, E. 2008, A&A, 484, 815.
- Boesgaard et al. [1998] Boesgaard, A. M., Deliyannis, C. P., Stephens, A., & King, J. R. 1998, ApJ, 493, 206
- Boothryod et al. [1995] Boothroyd, A. I., Sackmann, I-J., & Wasserburg, G. M. 1995, ApJ, 442, 21
- Brown et al. [1989] Brown, J. A., Sneden, C., Lambert, D. L., & Dutchover, E. Jr. 1989, ApJS, 71, 293
- Cameron & Fowler [1971] Cameron, A. G. W., & Fowler, W. A. 1971, ApJ, 164, 111
- Cyburt et al. [2008] Cyburt, R. H., Fields, B. D., & Olive, K. A. 2008, J. Cosmology Astropart. Phys, 11, 12
- Dobrovolskas et al. [2014] Dobrovolskas, V., Kucinskas, A., Bonifacio, P., Korotin, S. A., Steffen, M., Sbordone, L., Caffau, E., Ludwig, H.-G., Royer, F., and Prakapavic̆ius, D. 2014, A&A, 565, A121
- Domíguez et al. [2004] Domíguez, I., Abia, C., Straniero, O., Cristallo, S., & Pavlenko, Ya. V. 2004, A&A, 422, 1045
- D’Orazi et al. [2015] D’Orazi, V., Gratton, R. G., Angelou, G. C. et al. 2015, ApJ, 801:L32
- Eggen [1972] Eggen, O. J. 1973, ApJ, 172, 639
- Frogel et al. [1983] Frogel, J. A., Persson, S. E., & Cohen, J. G. 1983, ApJS, 53, 713
- Gratton et al. [2000] Gratton, R., Sneden, C., Carretta, E., & Bragaglia, A. 2000, A&A, 354, 169.
- Gratton et al. [2012] Gratton, R. G., Carretta, E., & Bragaglia, A. 2012, Astron. Astrophys. Rev. 20. 50
- Gustafsson et al. [2008] Gustafsson B., Edvardsson B., Eriksson K., Jorgensen U.G., & Nordlund, Å., & Plez B. 2008, A&A486, 951.
- Harris [1996] Harris, W. E. 1996, AJ, 112, 1487
- Johnson et a. [2005] Johnson, C. I., Kraft, R. P., Pilachowski, C. A., Sneden, C., Ivans, I. I., & Benman, G. 2005, PASP, 117, 1308
- Kirby et al. [2012] Kirby, E. N., Fu, X., Guhathakurta, P., & Deng, L. 2012, ApJ, 752, L16
- Kirby et al. [2016] Kirby, E. N., Guhathakurta, P., Zhang, A., Hong, J., Gui, M., Guo, R., Cohen, J. G., & Cunha, K. 2015, ApJ, 819, 135
- Koch et al. [2011] Koch, A., Lind, K., & Rich, R. M. 2011, ApJ, 738:L29
- Kraft et al. [1999] Kraft, R. P., Peterson, R. C., Guhathakurta, P., Sneden, C., Fulbright, J., & Langer, G. E. 1999, ApJ518, L53
- Kurucz& Bell [1995] Kurucz, R. L., & Bell, B. 1995, Atomic Line Data Kurucz CD-ROM No. 23, Cambridge, MA: Smithsonian Astrophysical Observatory
- Kustner [1922] Kustner, F. 1922, Veroff Univ.-Sternw. Bonn, No. 17
- Lind et al. [2009] Lind, K., Asplund, M., & Barklem, P. S. 2009, A&A, 503, 541
- Lind et al. [2011] Lind, K., Asplund, M., Barklem, P. S., & Belyaev, A. K. 2011, A&A, 528, 103
- Masseron [2006] Masseron, T. 2006, PhD. thesis, Obs. de Paris
- Monaco et al. [2012] Monaco, L., Villanova, S., Bonifacio, P., Caffau, E., Geisler, D., Marconi, G., Momany, Y, & Ludwig, H.G. 2012, A&A, 539, A157
- Palacios et al. [2001] Palacios, A., Charbonnel, C., & Forestini, M. 2001, A&A, 375, L9
- Pilachowski et al. [2000] Pilachowski, C. A., Sneden, C., Kraft, R. P., Harmer, D., & Willmarth, D. 2000, AJ, 119, 2895
- Reddy et al. [2002] Reddy, B. E., Lambert, D. L., Laws, C., & Gonzalez, G. 2002, MNRAS, 335, 1005
- Rey et al. [2001] Rey, S.-C., Yoon, S.J., Lee, Y.-W 2001, Chaboyer, B., & Sarajedini, A. 2001, AJ, 122, 3219
- Ruchti et al. [2011] Ruchti, G. R., Fulbright, J. P., Wyse, R. F. G., et al. 2011, ApJ, 743, 107
- Sackmann & Boothroyd [1999] Sackmann, I.-J., & Boothroyd, A. I. 1999, ApJ, 510, 217
- Sandage & Katem [1982] Sandage, A., & Katem, B. 1982, AJ, 87, 537
- Sbordone et al. [2010] Sbordone, L., Bonifacio, P., Caffau, E., et al. 2010, A&A, 522, A26
- Smith et al. [1999] Smith, V. V., Shetrone, M. D., & Keane, M. J. 1999, ApJ, 516:L73
- Sneden [1973] Sneden, C. 1973, ApJ, 184, 839
- Sneden et al. [2004] Sneden, C., Kraft, R. P., Guhathakurta, G., Peterson, R. C., & Fulbright, J. P. 2004, AJ, 127, 2162
- Tucholke et al. [1994] Tucholke, H.-J., Scholz, R.-D., & Broche, P. 1994, A&AS, 104, 161
- von Zeipel [1908] von Zeipel, H. 1908, Annales de l’Observatoire de Paris, 25, 1
- Wang et al. [2003] Wang, X., Wang, B., Puch, J., Miranda, F., Fisch, M. Anderson, J. E., Sergan, V., Bos, P. J. 2003, Proc. SPIE, 5162, 139
- Wasserburg et al. [1995] Wasserburg, G. J., Boothroyd, R. A., & Sackmann, I.J. 1995, ApJ, 447, L37
- Yong et al. [2014] Yong, D., Alves Brito, A., Da Costa, G. S., Alonso-Garcia, J., Karakas, A. I., Pignatari, M., Roederer, I. U., Aoki, W., Fishlock, C. K., Grundahl, F., & Norris, J. E. 2014, MNRAS, 439, 2638


| Wavelength | E.P. | EQW | ||
|---|---|---|---|---|
| Species | (Å ) | (eV) | Log gf | (mÅ ) |
| Fe I | 4839.55 | 3.27 | –1.84 | 27 |
| Fe I | 4892.87 | 4.22 | –1.21 | 13 |
| Fe I | 4917.24 | 4.19 | –1.27 | 32 |
| Fe I | 4924.77 | 2.28 | –2.29 | 66 |
| Fe I | 4961.92 | 3.64 | –2.34 | 12 |
| Fe I | 5014.94 | 3.94 | –0.32 | 63 |
| Fe I | 5044.21 | 2.85 | –2.03 | 49 |
| Fe I | 5060.08 | 0.00 | –5.45 | 60 |
| Fe I | 5217.39 | 3.21 | –1.18 | 59 |
| Fe I | 5242.49 | 3.63 | –0.98 | 42 |
| Fe I | 5243.78 | 4.26 | –1.01 | 24 |
| Fe I | 5253.46 | 3.28 | –1.63 | 35 |
| Fe I | 5288.53 | 3.69 | –1.53 | 21 |
| Fe I | 5364.86 | 4.44 | 0.21 | 63 |
| Fe I | 5367.48 | 4.41 | 0.43 | 54 |
| Fe I | 5398.29 | 4.45 | –0.68 | 29 |
| Fe I | 5522.45 | 4.21 | –1.45 | 10 |
| Fe I | 5525.54 | 4.23 | –1.15 | 18 |
| Fe I | 5560.22 | 4.44 | –1.07 | 24 |
| Fe I | 5618.64 | 4.21 | –1.32 | 20 |
| Fe I | 5662.51 | 4.18 | –0.59 | 52 |
| Fe I | 5701.56 | 2.56 | –2.22 | 63 |
| Fe I | 5717.84 | 4.29 | –0.94 | 32 |
| Fe I | 5731.77 | 4.26 | –1.08 | 21 |
| Fe I | 5753.12 | 4.26 | –0.71 | 34 |
| Fe I | 5775.09 | 4.22 | –1.14 | 14 |
| Fe I | 5806.73 | 4.61 | –0.91 | 12 |
| Fe I | 5816.37 | 4.55 | –0.62 | 29 |
| Fe I | 5852.23 | 4.55 | –1.17 | 16 |
| Fe I | 5862.37 | 4.55 | –0.50 | 46 |
| Fe I | 5916.25 | 2.45 | –2.99 | 31 |
| Fe I | 5930.19 | 4.65 | –0.29 | 33 |
| Fe I | 5934.67 | 3.93 | –1.15 | 50 |
| Fe I | 5956.71 | 0.86 | –4.60 | 51 |
| Fe I | 5976.79 | 3.94 | –1.33 | 36 |
| Fe I | 6003.02 | 3.88 | –1.08 | 41 |
| Fe I | 6007.97 | 4.65 | –0.82 | 20 |
| Fe I | 6008.57 | 3.88 | –0.96 | 58 |
| Fe I | 6027.06 | 4.08 | –1.23 | 28 |
| Fe I | 6056.01 | 4.73 | –0.42 | 27 |
| Fe I | 6079.02 | 4.65 | –0.95 | 28 |
| Fe I | 6082.72 | 2.22 | –3.57 | 26 |
| Fe I | 6089.57 | 4.58 | –1.28 | 21 |
| Fe I | 6151.62 | 2.18 | –3.30 | 45 |
| Fe I | 6157.73 | 4.08 | –1.29 | 28 |
| Fe I | 6200.32 | 2.61 | –2.44 | 56 |
| Fe I | 6229.23 | 2.84 | –2.85 | 19 |
| Fe I | 6240.65 | 2.22 | –3.23 | 35 |
| Fe I | 6246.33 | 3.60 | –0.73 | 55 |
| Fe I | 6270.23 | 2.86 | –2.46 | 44 |
| Fe I | 6301.51 | 3.65 | –0.72 | 77 |
| Fe I | 6322.69 | 2.59 | –2.43 | 61 |
| Fe I | 6336.82 | 3.68 | –0.92 | 65 |
| Fe I | 6344.15 | 2.43 | –2.92 | 44 |
| Fe I | 6355.03 | 2.84 | –2.40 | 40 |
| Fe I | 6380.75 | 4.19 | –1.37 | 22 |
| Fe I | 6411.66 | 3.65 | –0.60 | 79 |
| Fe I | 6498.94 | 0.96 | –4.70 | 70 |
| Fe I | 6518.37 | 2.83 | –2.46 | 42 |
| Fe I | 6575.02 | 2.59 | –2.73 | 48 |
| Fe I | 6593.88 | 2.43 | –2.42 | 76 |
| Fe I | 6608.04 | 2.28 | –3.96 | 16 |
| Fe I | 6609.12 | 2.56 | –2.69 | 46 |
| Fe I | 6703.58 | 2.76 | –3.01 | 27 |
| Fe I | 6726.67 | 4.61 | –1.10 | 21 |
| Fe I | 6750.16 | 2.42 | –2.62 | 68 |
| Fe I | 6806.86 | 2.73 | –3.14 | 29 |
| Fe I | 6839.83 | 2.56 | –3.35 | 24 |
| Fe I | 6843.66 | 4.55 | –0.85 | 20 |
| Fe I | 7223.66 | 3.02 | –2.27 | 41 |
| Fe II | 4993.35 | 2.81 | –3.56 | 21 |
| Fe II | 5132.67 | 2.81 | –3.95 | 17 |
| Fe II | 5264.81 | 3.34 | –3.21 | 40 |
| Fe II | 5325.56 | 3.22 | –3.18 | 23 |
| Fe II | 5414.08 | 3.22 | –3.61 | 12 |
| Fe II | 5425.26 | 3.20 | –3.27 | 18 |
| Fe II | 5534.85 | 3.25 | –2.75 | 44 |
| Fe II | 5991.38 | 3.15 | –3.56 | 16 |
| Fe II | 6149.25 | 3.89 | –2.73 | 16 |
| Fe II | 6247.56 | 3.89 | –2.33 | 29 |
| Fe II | 6369.46 | 2.89 | –4.21 | 20 |
| Fe II | 6416.93 | 3.89 | –2.70 | 19 |
| Fe II | 6432.68 | 2.89 | –3.58 | 32 |
| Fe II | 6456.39 | 3.90 | –2.10 | 42 |
| Fe II | 6516.08 | 2.89 | –3.38 | 45 |
| Fe II | 7711.72 | 3.90 | –2.54 | 31 |
| Na I | 5688.22 | 2.10 | –0.37 | 31 |
| Na I | 8183.26 | 2.10 | 0.23 | 77 |
| Na I | 8194.82 | 2.10 | 0.49 | 100 |
| Mg I | 5711.09 | 4.34 | –1.73 | 49 |
| Si I | 5690.43 | 4.93 | –1.87 | 20 |
| Si I | 5772.15 | 5.08 | –1.75 | 11 |
| Si I | 5948.55 | 5.08 | –1.23 | 35 |
| Si I | 6155.14 | 5.62 | –0.86 | 32 |
| Si I | 7415.96 | 5.62 | –0.71 | 39 |
| Ca I | 5260.39 | 2.52 | –1.72 | 17 |
| Ca I | 5261.71 | 2.52 | –0.58 | 58 |
| Ca I | 5512.99 | 2.93 | –0.45 | 25 |
| Ca I | 5581.98 | 2.52 | –0.56 | 61 |
| Ca I | 5590.13 | 2.51 | –0.57 | 53 |
| Ca I | 5601.29 | 2.52 | –0.52 | 52 |
| Ca I | 6161.29 | 2.52 | –1.27 | 21 |
| Ca I | 6166.44 | 2.52 | –1.14 | 28 |
| Ca I | 6169.04 | 2.52 | –0.80 | 40 |
| Ca I | 6169.56 | 2.52 | –0.48 | 62 |
| Ca I | 6471.67 | 2.52 | –0.69 | 54 |
| Ca I | 6499.65 | 2.52 | –0.82 | 55 |
| Ca I | 6717.69 | 2.71 | –0.52 | 65 |
| Sc II | 5239.82 | 1.45 | –0.70 | 36 |
| Sc II | 5526.82 | 1.77 | 0.20 | 67 |
| Sc II | 5657.88 | 1.51 | –0.28 | 63 |
| Sc II | 5669.04 | 1.50 | –1.00 | 26 |
| Sc II | 6245.62 | 1.51 | –1.05 | 32 |
| Ti I | 4820.41 | 1.50 | –0.44 | 37 |
| Ti I | 5009.66 | 0.02 | –2.26 | 27 |
| Ti I | 5016.17 | 0.85 | –0.57 | 58 |
| Ti I | 5022.87 | 0.83 | –0.43 | 62 |
| Ti I | 5147.48 | 0.00 | –2.01 | 34 |
| Ti I | 5219.71 | 0.02 | –2.29 | 24 |
| Ti I | 5662.16 | 2.32 | –0.11 | 16 |
| Ti I | 5866.46 | 1.07 | –0.84 | 31 |
| Ti I | 5922.12 | 1.05 | –1.47 | 25 |
| Ti I | 5937.81 | 1.07 | –1.89 | 11 |
| Ti I | 5941.75 | 1.05 | –1.52 | 14 |
| Ti I | 5953.16 | 1.89 | –0.33 | 20 |
| Ti I | 5965.83 | 1.88 | –0.41 | 19 |
| Ti I | 5978.55 | 1.87 | –0.50 | 20 |
| Ti I | 6743.12 | 0.90 | –1.63 | 19 |
| Ti II | 4865.62 | 1.12 | –2.81 | 39 |
| Ti II | 5154.08 | 1.57 | –1.92 | 59 |
| Ti II | 5185.91 | 1.89 | –1.50 | 58 |
| Ti II | 5336.79 | 1.58 | –1.63 | 68 |
| Ti II | 5381.03 | 1.59 | –2.08 | 58 |
| Ti II | 5418.78 | 1.58 | –2.11 | 51 |
| V I | 5627.64 | 1.08 | –0.37 | 21 |
| V I | 5670.86 | 1.08 | –0.42 | 23 |
| V I | 5727.06 | 1.08 | –0.01 | 25 |
| V I | 6081.45 | 1.05 | –0.58 | 16 |
| V I | 6090.22 | 1.08 | –0.06 | 22 |
| V I | 6119.53 | 1.06 | –0.32 | 13 |
| V I | 6199.19 | 0.29 | –1.28 | 19 |
| V I | 6216.36 | 0.28 | –0.81 | 20 |
| V I | 6251.82 | 0.29 | –1.34 | 12 |
| Cr I | 4651.29 | 0.98 | –1.48 | 62 |
| Cr I | 4718.42 | 3.20 | 0.09 | 19 |
| Cr I | 4724.41 | 3.09 | –0.73 | 14 |
| Cr I | 4801.03 | 3.12 | –0.13 | 12 |
| Cr I | 4936.34 | 3.11 | –0.22 | 12 |
| Cr I | 5348.33 | 1.00 | –1.29 | 69 |
| Mn I | 4754.04 | 2.28 | –0.09 | 59 |
| Mn I | 5420.37 | 2.14 | –1.46 | 16 |
| Ni I | 4904.42 | 3.54 | –0.19 | 37 |
| Ni I | 4935.83 | 3.94 | –0.34 | 16 |
| Ni I | 5578.73 | 1.68 | –2.67 | 40 |
| Ni I | 5593.75 | 3.90 | –0.79 | 11 |
| Ni I | 5805.23 | 4.17 | –0.60 | 10 |
| Ni I | 5847.01 | 1.68 | –3.44 | 15 |
| Ni I | 6007.31 | 1.68 | –3.34 | 14 |
| Ni I | 6108.12 | 1.68 | –2.49 | 48 |
| Ni I | 6175.37 | 4.09 | –0.53 | 15 |
| Ni I | 6176.82 | 4.09 | –0.26 | 16 |
| Ni I | 6177.25 | 1.83 | –3.60 | 11 |
| Ni I | 6586.32 | 1.95 | –2.79 | 27 |
| Ni I | 6767.78 | 1.83 | –2.11 | 68 |
| Zn I | 4722.16 | 4.03 | –0.37 | 38 |
| Zn I | 4810.53 | 4.08 | –0.15 | 37 |
| Sr I | 4607.33 | 0.00 | 0.28 | 15 |
| Y II | 5087.42 | 1.08 | –0.16 | 40 |
| Y II | 5200.42 | 0.99 | –0.57 | 26 |
| Y II | 5509.91 | 0.99 | –1.01 | 46 |
| Ba II | 4554.03 | 0.00 | 0.14 | 107 |
| Ba II | 5853.69 | 0.60 | –0.91 | 73 |
| La II | 5114.56 | 0.23 | –1.03 | 16 |
| Ce II | 4486.91 | 0.29 | –0.18 | 16 |
| Ce II | 4628.16 | 0.52 | 0.14 | 18 |
| Ce II | 5187.46 | 1.21 | 0.17 | 14 |
| Nd II | 4706.54 | 0.00 | –0.71 | 32 |
| Nd II | 4825.48 | 0.18 | –0.42 | 35 |
| Nd II | 4859.03 | 0.32 | –0.44 | 33 |
| Nd II | 4959.12 | 0.06 | –0.80 | 29 |
| Nd II | 5212.36 | 0.20 | –0.96 | 17 |
| Nd II | 5234.19 | 0.55 | –0.51 | 27 |
| Nd II | 5249.58 | 0.97 | 0.20 | 22 |
| Nd II | 5293.16 | 0.82 | 0.10 | 35 |
| Nd II | 5319.81 | 0.55 | –0.14 | 30 |
| Sm II | 4434.32 | 0.38 | –0.07 | 23 |
| Sm II | 4642.23 | 0.38 | –0.46 | 16 |
| Sm II | 4669.64 | 0.28 | –0.53 | 20 |
| Sm II | 4676.90 | 0.04 | –0.87 | 14 |
| Eu II | 6645.06 | 1.38 | 0.12 | 25 |
Note. — Table 1 is presented in its entirety in the electronic edition of the Publications. A portion is shown here for guidance regarding its form and content.
| Species | [m/H] | N | [m/Fe] | |
|---|---|---|---|---|
| Fe I | –1.51 | 0.19 | 71 | 0.00 |
| Fe II | –1.48 | 0.17 | 16 | 0.03 |
| O I | –1.0 | 0.1 | 1 | 0.5 |
| Na I (LTE) | –1.63 | 0.2 | 3 | –0.17 |
| Na I (NLTE) | –2.0 | 0.2 | 3 | –0.5 |
| Mg 1 | –1.40 | 0.2 | 1 | 0.11 |
| Si I | –1.26 | 0.08 | 5 | 0.25 |
| Ca I | –1.28 | 0.13 | 13 | 0.23 |
| Sc II | –1.62 | 0.20 | 5 | –0.11 |
| Ti I | –1.14 | 0.23 | 15 | 0.37 |
| Ti II | –1.29 | 0.13 | 6 | 0.22 |
| V I | –1.37 | 0.17 | 9 | 0.14 |
| Cr I | –1.40 | 0.40 | 6 | 0.11 |
| Mn I | –1.74 | 0.24 | 2 | –0.23 |
| Ni I | –1.53 | 0.13 | 13 | –0.02 |
| Zn I | –1.51 | 0.31 | 2 | 0.00 |
| Sr I | –1.69 | 0.3 | 1 | –0.18 |
| Y II | –1.71 | 0.24 | 3 | –0.20 |
| Ba II | –1.45 | 0.3 | 2 | 0.06 |
| La II | –1.09 | 0.3 | 1 | 0.42 |
| Ce II | –1.38 | 0.45 | 3 | 0.13 |
| Nd II | –1.04 | 0.12 | 9 | 0.47 |
| Sm II | –0.94 | 0.15 | 4 | 0.57 |
| Eu II | –0.75 | 0.4 | 1 | 0.76 |
| Teff 100 | log g0.50 | [M/H]0.10 | vt0.20 | |||
|---|---|---|---|---|---|---|
| Species | (K) | (cgs) | (dex) | (km s-1) | Obs. | Combined |
| [Fe/H]I | 0.10 | 0.03 | 0.02 | 0.11 | ||
| [Fe/H]II | 0.05 | 0.12 | 0.03 | 0.04 | 0.14 | |
| A(Li) | 0.14 | 0.1 | 0.17 | |||
| [O/H] | 0.14 | 0.11 | 0.01 | 0.1 | 0.20 | |
| [Na/H] | 0.07 | 0.01 | 0.2 | 0.21 |