The XXL survey XV: Evidence for dry merger driven BCG growth in XXL-100-GC X-ray clusters
Abstract
The growth of brightest cluster galaxies is closely related to the properties of their host cluster. We present evidence for dry mergers as the dominant source of BCG mass growth at in the XXL 100 brightest cluster sample. We use the global red sequence, H emission and mean star formation history to show that BCGs in the sample possess star formation levels comparable to field ellipticals of similar stellar mass and redshift. XXL 100 brightest clusters are less massive on average than those in other X-ray selected samples such as LoCuSS or HIFLUGCS. Few clusters in the sample display high central gas concentration, rendering inefficient the growth of BCGs via star formation resulting from the accretion of cool gas. Using measures of the relaxation state of their host clusters, we show that BCGs grow as relaxation proceeds. We find that the BCG stellar mass corresponds to a relatively constant fraction 1% of the total cluster mass in relaxed systems. We also show that, following a cluster scale merger event, the BCG stellar mass lags behind the expected value from the Mcluster - MBCG relation but subsequently accretes stellar mass via dry mergers as the BCG and cluster evolve towards a relaxed state.
keywords:
galaxies: cluster: general - galaxies: evolution - galaxies: interactions - galaxies: elliptical and lenticular, cD - X-rays: galaxies: clusters1 Introduction
Due to their dominance and location near the centre of clusters, brightest cluster galaxy (BCG) evolution is of great interest. In the current paradigm, BCGs are formed hierarchically by mergers with other cluster members. Observations of BCGs have shown that they follow a steeper size-luminosity scaling relation than other early-type galaxies. For their luminosity, BCGs are larger than expected from the bulk of early-type galaxies, indicating that dissipationless mergers play an important role in their formation (e.g.: Bernardi et al. 2007; Liu et al. 2008). Around , BCGs gain their identity as they unambiguously emerge as the dominant galaxy within a cluster (De Lucia et al. 2006). Although early theoretical (e.g.: Merritt 1984; Merritt 1985; Schombert 1987) and more recent observational work (Collins et al. 2009; Stott et al. 2010) favour a scenario where BCGs were almost entirely assembled at , work by McIntosh et al. (2008), Liu et al. (2009) and Edwards & Patton (2012) indicate that BCGs are still growing at the present epoch. Other work by Lidman et al. (2012), Burke & Collins (2013) and Liu et al. (2015) indicate that BCGs at still undergo major merger events and grow by a factor of from to the present epoch. Simulations have shown that most of the mass probably comes from a small () number of merging events (De Lucia & Blaizot 2007, Ruszkowski & Springel 2009). Observation of mass segregation in clusters (Dressler et al. 1997; Adami et al. 1998; Biviano et al. 2002; Lidman et al. 2013) and the presence of multiple bound companions around BCGs (Burke & Collins, 2013) show that clusters and the BCG environment are dynamically evolving in a way that readily makes stellar material available to BCGs.
BCG evolution is intimately linked to the host cluster evolution as BCG growth requires an influx of material from the cluster. There are two possible growth channels for BCGs: the accretion of stars via gas-poor, or dry, mergers and the formation of new stars in situ from accreted gas brought to the BCG by cooling flows or from a gas-rich, or wet, merger event. Mass growth via dry mergers can only be a major contributor to BCG mass evolution if kinematic processes in the cluster such as dynamical friction (Chandrasekhar 1943) make that mass available for accretion on to the BCG in timescales less than the Hubble time. Fabian (2012) report that most of the UV and IR luminosity of BCGs in cool core clusters seems to come from vigorous in situ star formation, presumably fuelled by residual cooling flows. BCG growth via such in situ star formation requires the host cluster to exist in a relaxed or undisturbed state as the formation of cooling flows could be easily disrupted by cluster merging events (e.g. Ricker & Sarazin 2001).
Feedback from a central active galactic nucleus can also disrupt cooling flows via the injection of energy into the intra cluster medium. The duty cycle of radio-mode feedback can be more than 60%, suppressing the amount of gas actually reaching the BCG (e.g. Bîrzan et al. 2012). Star formation resulting from cooling flows also requires a BCG to be situated close to the centroid of the X-ray emission in clusters for the gas to actually be accreted (Edwards et al. 2007; Bildfell et al. 2008; Rafferty et al. 2008).
Recent work also indicate that BCGs dominant growth source changes around . Webb et al. (2015) show that very IR-luminous BCGs are only found at and McDonald et al. (2016) find that star formation in BCGs is more significant at , even in dynamically disturbed clusters. Both papers, in addition to work done by Vulcani et al. (2016) and Liu et al. (2013) indicate that in situ star formation seems to dominate stellar mass growth at before being replaced by dry mergers at . Determining the source of BCG mass growth provides not only a direct indication of its own evolution but also of the history of its cluster environment.
To understand the relationship between BCGs and their host clusters requires a large sample of such systems, ideally drawn from a range of cluster mass and redshift, and selected according to a simple set of physical criteria. In this paper we investigate the properties of a large sample of clusters and BCGs drawn from the XXL survey. At more than 6 Ms total exposure time over two 25 deg2 fields, XXL is the largest XMM-Newton programme to date (Pierre et al. 2016, hereafter XXL paper I). The two XXL survey fields are referred to as XXL-N, centred on the XMM-LSS and CFHTLS W1 field, and XXL-S, centred on the Blanco Cosmology Survey field. Each consists of an overlapping mosaic of 10 ks XMM exposures.
The XXL survey offers a unique perspective on the evolution of low-to-intermediate mass X-ray clusters. Clusters and BCGs are not homogeneous, either at fixed mass or redshift. There are considerable variations in their properties which makes necessary the study of a numerically large sample. The large amount of optical, infrared and spectroscopic data available or obtained by XXL makes it possible to study a large and well-defined X-ray cluster sample up to . More importantly, it enables us to relate photometric and spectroscopic measures of BCGs to the relaxation state of the clusters. We use the sample of the 100 brightest XXL clusters111Available on CDS in catalogue IX/49/xxl100gc and via the Master Catalogue Database in Milan at: http://cosmosdb.iasf-milano.inaf.it/XXL/ for our work (XXL-100-GC; Pacaud et al. 2016, hereafter XXL paper II) and find that the relaxation state of clusters is very powerful tool to help follow and understand BCG growth.
The paper is organized as follows: in Section 2 we describe the 100 brightest clusters sample and the multi- data used; in Section 3 we present the BCG selection criteria and final sample; we present the various measurements performed on the sample in Section 4; we discuss our results in Section 5. A WMAP9 cosmology is used unless otherwise stated.
2 XXL-100-GC brightest clusters sample
2.1 Clusters
Galaxy clusters are identified from processed XMM images in the following manner: source extraction is performed by applying SExtractor (Bertin & Arnouts 1996) to wavelet-filtered XMM images. Surface photometry is then performed on selected sources using the custom Xamin pipeline with sources characterized by maximum-likelihood values of , and (Pacaud et al. 2006). The application of appropriate cuts through this detection parameter space generate respectively the C1 cluster sample, which is uncontaminated by misclassified sources or artefacts (Pacaud et al. 2006; Pacaud et al. 2007; Clerc et al. 2012; Clerc et al. 2014) and the C2 sample which displays 30-50% contamination (Pierre et al. 2006; Adami et al. 2011). The survey cluster selection function is expressed in terms of the surface brightness of model clusters realized within XMM images (Pacaud et al., 2006). A growth curve analysis is used to measure fluxes for the 200 brightest clusters within the XXL survey footprint (Clerc et al. 2012). The analysis employs local background estimation, nearby-source masking and interactive cluster centring. XXL-100-GC clusters are selected from this list with fluxes quoted in a 1′ radius circular aperture. The sample contain 51 clusters located in XXL-N and 49 in XXL-S (XXL paper II).
Cluster X-ray temperatures for the XXL-100-GC sample are presented in Giles et al. (2016) (hereafter XXL paper III). X-ray spectra of each cluster were extracted using an aperture of radius 300 kpc with a minimum of 5 counts per spectral bin in the 0.4-7.0 keV band. Temperatures are not core excised due to the limited PSF of XMM-Newton and lie mostly in the 1 KeV 6 KeV range.
Cluster weak lensing masses for the XXL-100-GC sample are presented in Lieu et al. (2016) (hereafter XXL paper IV). Masses are computed from an internal weak-lensing scaling relation. calibrated using a shear profile analysis of 38 XXL-100-GC clusters located within the footprint of the CFHTLenS shear catalog. Following Miller et al. (2013) and Velander et al. (2014), the authors build a shear profile from the ellipticity analysis of galaxies found to be behind the individual clusters in the CFHTLenS shear catalog. A Navarro, Frenk and White (NFW; Navarro et al. 1997) profile is fit to the shear profile and integrated out to r500,WL222Defined as the radius within which the average total mass density of a cluster equals 500 times the critical density of the Universe at the cluster redshift as obtained from the weak lensing analysis to obtain the values of weak lensing masses M500,WL for the clusters. The average scaling relation is then used to get both r500,MT and M500,MT, the mass within r500, for all XXL-100-GC clusters so that all masses are based on the scaling relation. For the sake of simplicity, we shall use r500 and M500 respectively to denote r500,MT and M500,MT.
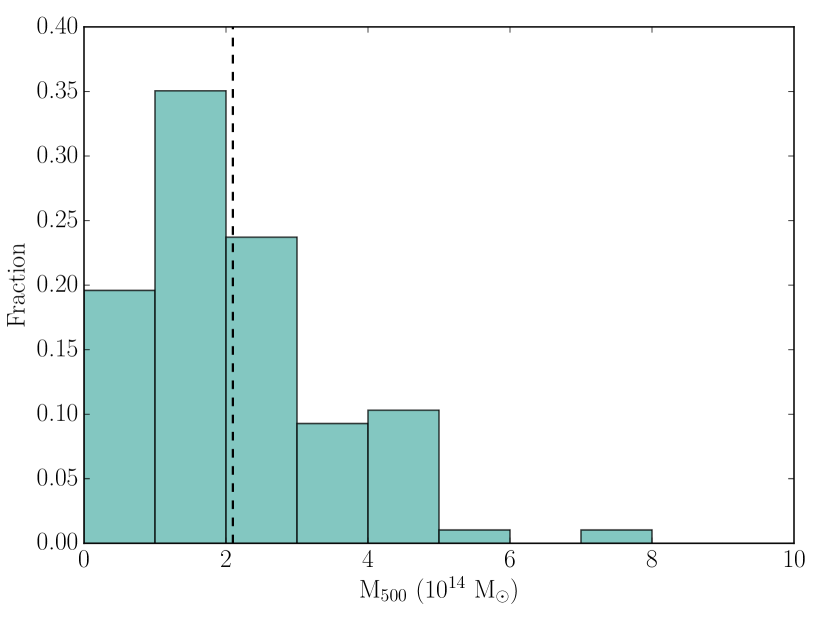
Figure 1 shows the normalized distributions of cluster masses for XXL-100-GC as obtained from the XXL paper IV relation.333Most colours used in figures in this work were optimized for readability using the ColorBrewer tool from www.ColorBrewer.org by Cynthia A. Brewer, Geography, Pennsylvania State University.. The average mass within r500 of XXL-100-GC clusters is M⊙, a value which is generally lower when compared to the average mass of other X-ray cluster samples such as REXCESS ( M⊙, Haarsma et al. 2010), LoCuSS444http://www.sr.bham.ac.uk/locuss/home.php ( M⊙, Smith et al. 2017, in preparation), CLASH ( M⊙, Merten et al. 2015) or HIFLUGCS ( M⊙, Reiprich & Böhringer 2002). Some care must be exercised when comparing XXL-100-GC to samples, not just of differing mass, but also of differing sample selection criteria. In this sense, comparing the properties of XXL-100-GC to an existing, yet lower redshift, flux-limited cluster sample such as HIFLUGCS (; Reiprich & Böhringer 2002) is of interest as it reproduces many of the selection biases inherent in flux- as compared to luminosity-based selection.
2.2 Multiwavelength data
XXL has been constructed as a multiwavelength survey and the complete list of XXL-PI and external programmes can be found in XXL paper I. The present work primarily employs optical and near-infrared photometric data as well as photometric and spectroscopic redshifts. The XXL-N field overlaps the W1 field from CFHTLS wide MegaCam survey (Gwyn 2012). All but five of the XXL-N clusters have ugriz photometry from MegaCam with a point-source i-band depth of 25 AB. The remaining five clusters are located in a northern extension of the CFHTLS W1 field known as the ABC field and have grz MegaCam photometry to the same depth as CFHTLS.
Galaxy magnitudes are taken from the i-band selected CFHTLS Wide catalogue (Gwyn 2012)555http://www.cadc-ccda.hia-iha.nrc-cnrc.gc.ca/en/megapipe/cfhtls/uc.html. MAG_AUTO magnitudes in the catalogue are computed with SExtractor 2.5.0 using the adaptative aperture described in Bertin & Arnouts (1996). Extensive testing by Bertin & Arnouts has shown that this aperture produces very consistent results for galaxies of any shape or ellipticity, missing on average 6% of the flux with only 2% variations rms. We correct for the missing flux and combine the variations with photometric errors to obtain consistent final total magnitudes in both CFHTLS and ABC fields.
W1 source photometric redshifts are taken from the latest CFHTLS-T0007 release (Ilbert et al. 2006; Coupon et al. 2009) and have a typical error of for i22.5.
Few sources in the ABC field have spectroscopic redshifts. Instead we combine photometry with the large number of sources with spectroscopic redshifts in the W1 field to train a Generalized Linear Models code in the ABC field (Elliott et al. 2015). The photometric redshifts are found by passing the grz photometry to the Python package CosmoPhotoz666http://cosmophotoz.readthedocs.org together with the photometry and spectroscopic redshifts of about a thousand sources in W1. This results in photometric redshifts with for sources with z23.0 in the ABC fields.
The XXL-S field is located in the sky area covered by the Blanco Cosmology Survey (BCS) with griz photometry (Desai et al. 2012). Although BCS data is shallower than CFHTLS with a point-source i-band depth of 24, the area is also part of the deeper Dark Energy Survey777http://www.darkenergysurvey.org/survey/des-description.pdf (DES), a 5000 deg2 field observed with the Dark Energy Camera (DECam; Flaugher et al. 2015) in grizY. While the coverage is still incomplete in the i-band, it is supplemented by deeper XXL-PI observations in the grz-band covering the Southern field with a z-band depth of (Desai et al. 2017, in preparation). DECam photometry is preferred whenever available. BCS magnitudes are taken from the survey catalogs described in Bleem et al. (2015). Similarly, DECam data is taken from the survey catalogs where total magnitudes are computed from PSF corrected model fitting photometry (see: Bertin 2011 and Mohr et al. 2012). Photometric redshifts for sources in the Southern field are part of the BCS data and were obtained by Menanteau et al. (2010) using the Benítez (2000) BPZ algorithm from BCS griz photometry. The typical photometric redshift error is for i22.5.
Spectroscopic redshifts for both XXL-N and XXL-S are drawn from a variety of sources. Targeted spectroscopy of individual clusters has been obtained as part of ESO Large Programme 191.A-0268. Further spectroscopy is available from the VIMOS Public Extragalacic Redshift Survey (VIPERS), a large and deep VIMOS (Le Fèvre et al. 2003) redshift survey focusing on the redshift range (Garilli et al. 2014, Guzzo et al. 2014) that partially overlaps with XXL-N. The Galaxy And Mass Assembly (GAMA) survey is another large spectroscopic data set that overlaps XXL-N, contributing low-resolution, high-completeness spectroscopy of galaxies in the XXL-N field to (Hopkins et al. 2012, Baldry et al. 2014, Liske et al. 2015). Data exchange with the VIPERS and GAMA teams has made available thousands of spectroscopic redshifts for this work. In addition, publicly available spectroscopic redshifts from SDSS DR12 (Gunn et al. 2006, Eisenstein et al. 2011, Dawson et al. 2013, Smee et al. 2013, Ahn et al. 2014) and the VIMOS VLT deep survey (Le Fèvre et al. 2005) are used where they overlap with XXL-N. Many smaller XXL programmes were undertaken to complement the spectroscopic redshifts in the Northern and Southern fields by focusing on known XXL clusters. Most of the spectra in the South have been obtained with the AAOmega spectrograph (Saunders et al. 2004; Smith et al. 2004) on the Anglo-Australian Telescope (Lidman et al., 2016). Table 1 lists basic information on the various sources of spectroscopic data.
| Instrument/Programme | Field | Resolution | Coverage | Typical texp |
|---|---|---|---|---|
| VIMOS/VIPERS | N | R=1200 | 16 deg2 | 2700s |
| VIMOS/VLT deep survey | N | R=230 | 0.61 deg2 | 16 200s |
| AAOmega/GAMA | N | R=1400 | 23.5 deg2 overlap with XXL | 3000-5000s |
| BOSS/SDSS DR12 | N | R=1300-3000 | All XXL-N | 2700s |
| AF2/XXL-PI | N | R=1200 | Individual clusters | 7200s / 14 400s |
| EFOSC2/XXL-PI | N+S | R=300 | Individual clusters | 2700s |
| FORS2/XXL-PI | N+S | R=600 | Individual clusters | 2400s |
| AAOmega/XXL-PI | S | R=1400 | 25 deg2 | 5000-10 000s |
Since we have access to such a large number of photometric and spectroscopic redshifts in both the North and South field, it is possible to evaluate and correct the redshift bias. Due to the inherent difficulty of associating the right template to a galaxy, photometric redshifts can show systematic offset from their spectroscopic counterpart. One has to correct for this effect to reliably associate galaxies with their host cluster. In XXL-100-GC data, this effect is larger at and . Assuming that spectroscopic redshifts are right, we build a redshift bias correction curve for each field from the sources that have both a spectroscopic and photometric redshift. We then apply the correction to all sources that only have a photometric redshift and use those corrected values for this work.
3 Brightest cluster galaxies
Given the availability of good quality multi-band photometry together with photometric and spectroscopic redshifts to , a simple set of criteria can be used to identify BCGs. For the present work, we define a BCG as:
-
The brightest galaxy in z-band,
-
within 0.5 r500 of the cluster X-ray centroid,
-
with a redshift that is consistent with that of the cluster as determined from all the redshifts available around the X-ray centroid.
A coarse selection of possible cluster members is first done using photometric redshifts. Galaxies within 0.5 r500 of a cluster X-ray centroid are considered possible members if their photometric redshift falls within:
where is the galaxy photometric redshift, is the cluster redshift and is the 1- error on the photometric redshift from the method used in the different fields ( for i22.5, for i22.5 and for z23.0). The brightest z-band galaxy from that selection is used as a candidate BCG. In 90% of these cases, visual inspection confirms that the selected BCG is a sensible choice. For the remaining 10% of systems, photometric redshifts are ignored and the BCG candidates are identified from photometry alone before being visually confirmed. Spectroscopic redshifts are available for all but 3 BCGs and of those with spectra all are confirmed to be 3000 km s-1 from their cluster redshift. Additionally, all of the BCGs identified from photometry alone have a spectroscopic redshift consistent with the host cluster.
Some XXL-100-GC clusters are excluded from this study for various reasons. XLSSC 088, XLSSC 092, XLSSC 110, XLSSC 501, XLSSC 526 and XLSSC 536 are excluded because the photometry of their identified BCG is possibly contaminated by obvious foreground objects along the line of sight. XLSSC 089, XLSSC 094 and XLSSC 102 are excluded due to the lack of redshifts available to confirm selections that are dubious. Two additional clusters, XLSSC 504 and XLSSC 508, are excluded due to possible contamination of their X-ray centroid from an AGN. XLSSC 052 and XLSSC 062 are excluded because they have only been observed by CFH12K in a few bands. Additional clusters are excluded because measurements of their mass or X-ray relaxation are unavailable. Our final sample consists of 85 clusters, 45 of which are in the Northern field and 40 in the Southern field. For the sake of simplicity, XXL-100-GC will refer to those 85 clusters for the remainder of the paper. BCG positions and some of their characteristics determined later in the paper are presented in Table LABEL:bcg_position.
4 Measurements
A range of measurements can be performed upon the sample to search for evidence of a particular source of BCG growth. We describe these in detail in the following sections and summarize them here. The position of the BCG in relation to the X-ray centroid of their host cluster is measured and an estimate of the X-ray emitting gas concentration is taken from Démoclès et al. (2017, in preparation). Both measures are employed as indicators of the relaxation state of the clusters. The quality of the photometry in the W1 field and the size of the BCG sample enables us to determine the average star formation history for the BCGs. From this model, we compute stellar masses for all XXL-100-GC BCGs. We use photometric and spectroscopic redshifts to identify individual members of a given cluster and measure the difference in magnitude between the BCG and bright cluster members as well as investigate evidence of luminosity segregation. We employ the results from a semi-analytic simulation of galaxy evolution to obtain an insight into the distribution of galaxy masses accreted by the BCG. Where available, H emission line fluxes are measured from SDSS DR12 spectroscopy and are employed to determine the level of ongoing star formation in BCGs. Finally, a global red-sequence for the XXL-100-GC cluster sample is constructed by applying appropriate - and distance modulus corrections to transform individual cluster member photometry to a common redshift. The distance of individual BCGs from the global red sequence is then employed to investigate the extent to which the star formation history of individual BCGs differs from the average properties of the cluster sample.
4.1 BCG offset from X-ray centroid
As the most massive galaxy within a cluster, the BCG migrates to the centre of the host cluster as a result of dynamical friction. As the X-ray emitting gas provides an effective observational tracer of the cluster potential, the offset between the X-ray centroid and a BCG can be used as an indicator of the relaxation state of a cluster. In a relaxed cluster the offset between the BCG position and the X-ray centroid should approach zero.
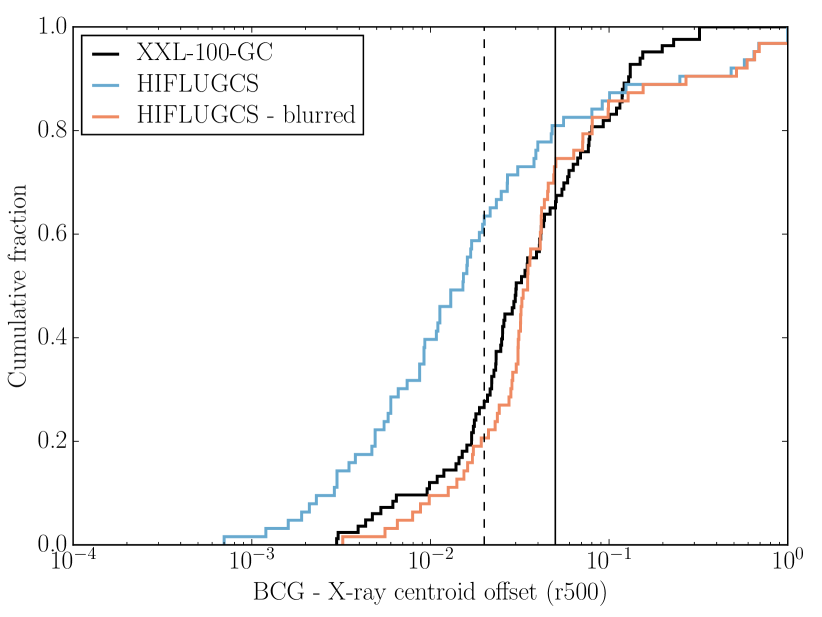
We combine X-ray centroid positions and values from XXL paper II with our BCG positions, to compute the centroid offset for the XXL-100-GC BCG sample in units of (listed in Table LABEL:bcg_position). Scaling the offsets by offers a suitable normalization method based on the mass distribution in each cluster. The extent of the XMM PSF results in an error of approximately (1-) respectively in RA and DEC in the measured X-ray centroid of moderately bright ( counts), extended sources (Faccioli et al. 2017, in preparation). Figure 2 illustrates the effect of this positional error in a comparison of the distribution of BCG offsets in the XXL-100-GC and HIFLUGCS (Zhang et al., 2011) surveys. Although it appears that the XXL-100-GC sample is lacking in low-offset BCGs compared to HIFLUGCS, we demonstrate that this difference is largely a result of the centroid uncertainty of XXL-100-GC clusters. Figure 2 displays the HIFLUGCS offset distribution transposed to the median redshift () of the XXL-100-GC sample and modified by a Rayleigh distribution with a scale parameter of (the quadratic combination of the error in both axis) applied to the X-ray centroid (red line). One can see that the effect of this is to scatter low-offset BCGs to higher offsets, bringing the distribution into closer agreement with the XXL-100-GC distribution.
Despite this position error, BCG offsets may still be employed to classify clusters as relaxed or unrelaxed. We select a threshold of as it is large enough to be unaffected by the X-ray centroid error over the full range of XXL-100-GC redshifts yet provides physically sensible results when applied in later analyses in this paper. In particular, the angular scale defined by for an example cluster at with kpc is two times larger than the angular error in the X-ray centroid. Clusters with a normalized BCG offset from the X-ray centroid lower than will be considered relaxed, while those with a larger offset will be considered unrelaxed. We note that we have experimented with varying this threshold, in particular setting the threshold for an unrelaxed cluster as . This selection did not change the qualitative nature of the results presented in this paper and resulted in a much smaller sample of clusters classified as unrelaxed (16 instead of 30). Physically, the important distinction therefore appears to be to separate clusters into low-offset, relaxed clusters and the rest.
4.2 X-ray gas concentration
Clusters that display very peaked central X-ray surface brightness profiles may be classified as cool-core clusters. Such cool cores in massive clusters are associated observationally with central concentrations of cool X-ray gas and optical emission line filaments which appear to be accreting onto the BCG (e.g. Crawford et al. 1999). Cool core clusters can be disrupted by cluster scale merging events as a result of the input of kinetic energy from the merger into the cluster ICM (e.g. Ricker & Sarazin 2001). Energy input to the central gas concentration raises it to a higher energy state within the cluster potential, i.e. moves it to larger clustercentric radius. In addition to cluster merging, an AGN outburst in the BCG could also disrupt the properties of a cool-core (e.g. Guo & Oh 2009). Although observed X-ray surface brightness profiles of clusters display considerable variation, they remain an effective indicator of the presence of cool core within a cluster.
For clusters observed at sufficiently high resolution, the central slope of the X-ray surface brightness profile can be used to estimate the gas concentration and the relaxation state. XXL-100-GC spatial resolution is limited by the relatively large PSF of XMM-Newton, making the measurement of the inner slope impractical for the whole sample. Instead we obtain the X-ray gas concentration measurements for XXL-100-GC from Démoclès et al. (2017, in preparation) who compute the parameter defined by Santos et al. (2008) as the ratio of the average surface brightness within 40 and 400 kpc. Santos et al. (2010) and Hudson et al. (2010) show that has a low scatter with cluster central cooling time, making it a reliable indicator of cluster relaxation.
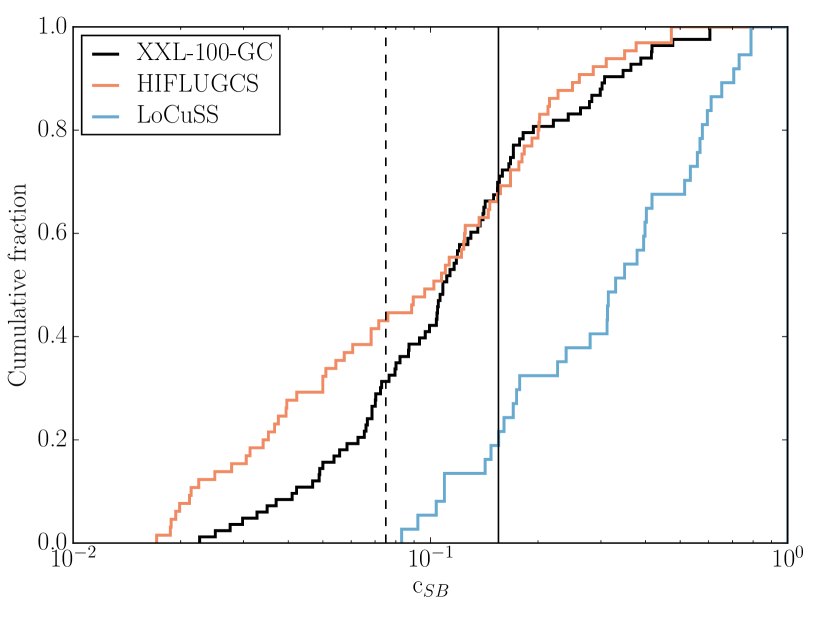
We test the robustness of the method used to measure the parameter in XXL-100-GC by applying the same procedure to mock X-ray images created from the cosmoOWLS simulation (Le Brun et al., 2014). CosmoOWLS is a large suite of smoothed particle hydrodynamics (SPH) simulations within a cosmological volume that include the effects of a variety of gas physics, such as gas cooling and feedback from supernovae and active galactic nuclei (AGN). Simulated X-ray images of 25 clusters spanning the whole range of with similar redshift and temperature distributions to XXL-100-GC were created. The simulated images were then folded through the XMM-Newton response and convolved with the PSF of the telescope. A realistic background was added to the images to create a mock XMM-Newton image similar to real XXL observations. Finally, the same method was applied to measure the concentration parameter of both the mock images and the original simulated data. The median value of is with a scatter of 0.13. Therefore, our method is able to recover the concentration of XXL clusters in a relatively unbiased manner albeit with limited precision. As a final check, in Figure 3 we compare the distribution of values measured for the XXL-100-GC sample to the HIFLUGCS sample (Hudson et al., 2010). Both samples are area-complete and flux-limited, yet with different mean redshifts, and display distributions that are qualitatively very similar. To highlight how different selection methods affect the resulting sample, an estimate (without PSF correction) of the values for the luminosity-selected LoCuSS sample is also shown (Démoclès, Smith & Martino, private communications).
4.3 BCG stellar masses
Estimating the stellar mass of a BCG requires knowledge of its star formation history. Following Lidman et al. (2012), we deduce an average star formation history (SFH) for the BCG sample. We then employ this global SFH to estimate the stellar masses of individual BCGs. As the MegaCam photometry in the W1 field is the most reliable, we derive the SFH of the sample using only these BCGs. This SFH model is then applied to the whole sample assuming that the BCGs in the BCS and DECam fields are physically identical on average to the ones in W1. Extinction in the W1 field is low ( z-mag and i-z colour) and is ignored as model uncertainties dominate. W1 photometry has a typical night to night scatter of 0.03 mag that is combined quadratically with each BCGs photometric uncertainty.
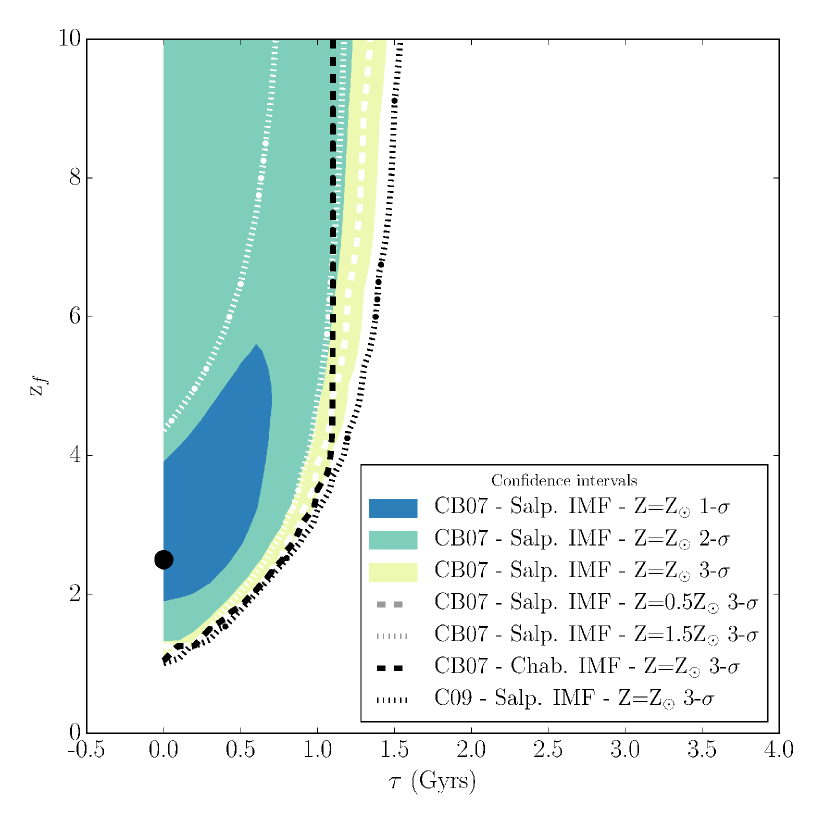
We determine the best-fitting SFH model for the XXL-100-GC sample by comparing model stellar populations of varying properties to the sample of BCG colours versus redshift. We employ the EzGal888http://www.baryons.org/ezgal/ Python package to produce the stellar population models and determine the model that best reproduces the observed i-z colours of the W1 BCGs sub-sample. This is achieved by identifying the lowest weighted value for a set of models with metallicity Z=0.5, 0.75, 1, 1.5 and 2.5 Z⊙. For each metallicity value, the best fitting model is sought by varying the timescale of an -folding model star formation rate between 0 and 10 Gyrs and the formation redshift (zf) between 1 and 5. The process is performed for both a Charlot-Bruzual (CB07) model (Bruzual & Charlot 2003; Charlot & Bruzual, in preparation) with a Salpeter initial mass function (IMF; Salpeter 1955) and a Chabrier IMF (Chabrier 2003). A family of Conroy (C09) models (Conroy et al. 2009) with Z=Z⊙ and a Salpeter IMF is also used to see if the choice of model greatly influences our final SFH.
Figure 4 displays the confidence intervals obtained for each set of models. The various models differ little in the parameter space enclosed by their 3- confidence interval and minimal values. We select a CB07 model described by a Salpeter IMF with Z=Z⊙, single stellar population (SSP) and =2.5 as our average star formation history because it has the lowest formal and this metallicity has a slightly more precisely defined 1- confidence interval. We prefer the use of a Salpeter IMF as Smith et al. (2015) demonstrate that a “bottom-heavy” IMF potentially provides a better description of the SFH of massive galaxies than a “bottom-light” Chabrier IMF. Our findings are slightly different than those reported by Lidman et al. (2012) yet overall agree at the 2- confidence level. Furthermore Lidman et al. (2012) also employ J-K colours to constrain the average star formation history, which is less sensitive to recent star formation than our i-z colours.
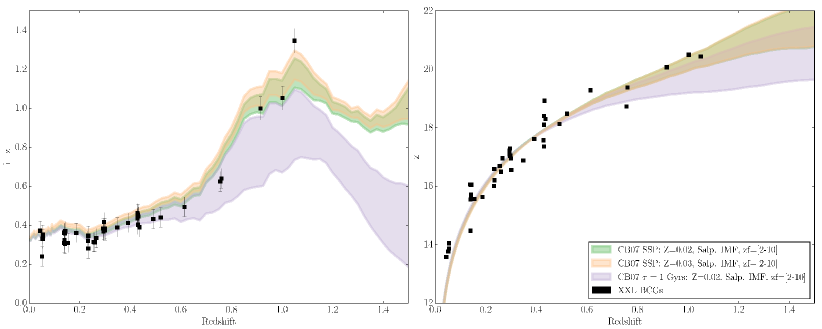
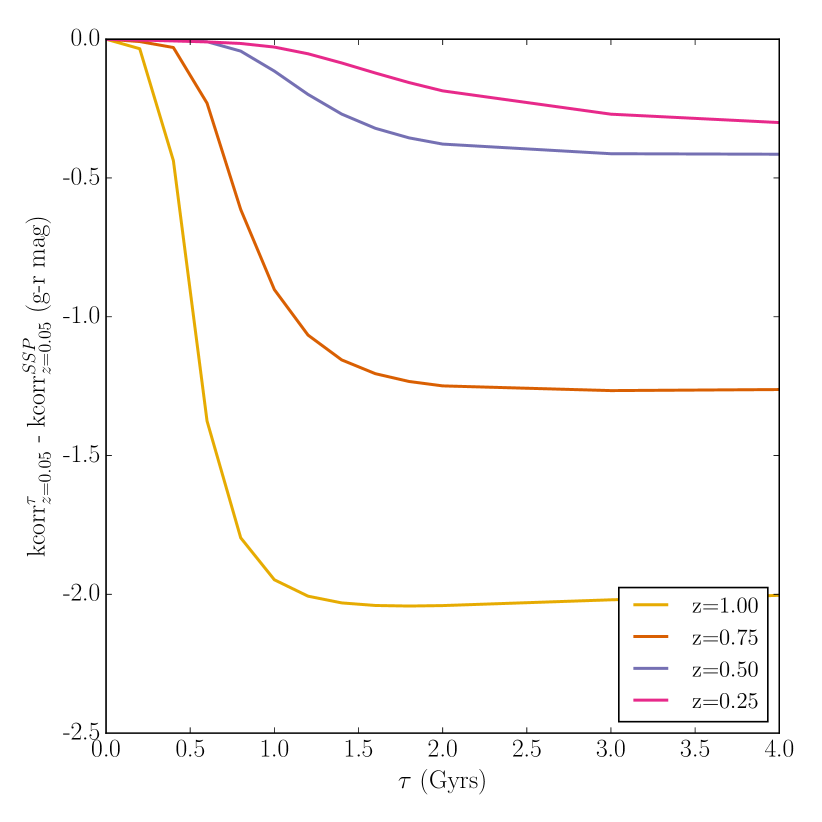
Figure 5 indicates how metallicity, star formation history and the redshift of formation affect the predicted values of colour and z-band magnitude. Maintaining the same star formation history, one notes that though metallicity variations act to offset the predicted colours they do not significantly alter the z-band magnitude, our proxy for stellar mass. A star formation history with a non-zero generates bluer galaxy colours at high redshift. Even a small positive value of is in tension with the colours observed for high-z BCGs in XXL-100-GC, pointing towards passive evolution since early times. We note that none of the models works completely, some BCGs being bluer in i-z than any of our model can reproduce.
Employing the best fitting model within our adopted cosmology, we apply a simple bisection algorithm to obtain the absolute z-band magnitude that best reproduces the observed magnitude of each BCG. DECam z-band magnitudes are used for BCGs in the XXL-S field. Stellar masses are obtained by applying a mass-to-light ratio appropriate for the SFH model to each BCG -band luminosity. The effect of switching between an assumed Chabrier or Kroupa IMF is to change the derived stellar masses equally over the XXL-100-GC sample without introducing any IMF-dependent evolution with redshift. The influence on the relations derived from BCG masses is also marginal. The uncertainties in Table LABEL:bcg_position represent the range of masses within the 1- confidence interval shown in Figure 4. As one can see from the shaded regions in Figure 5, model errors become more important at higher redshift. Because of this, model errors dominate mass uncertainties for all BCGs. Resulting mass uncertainties are , somewhat higher than the obtained with a similar method by Lidman et al. (2012) without model errors. Additionally, masses obtained from a reprocessing by the Portsmouth Group of SDSS DR12999http://www.sdss.org/dr12/spectro/galaxy_portsmouth/ following Maraston et al. (2013) are available for 30 BCGs. Values determined for our BCGs fall within 0.2 dex of the masses they report for a passive model with Salpeter IMF.
4.4 Mcluster - MBCG relation
It is generally accepted that more massive BCGs exist in more massive clusters. In the hierarchical scenario, as massive clusters grow by the accretion of less massive sub-units, recently accreted galaxies migrate to the centre of the cluster potential where they are themselves accreted by the BCG which itself grows in mass. The relationship between cluster and BCG mass may be expressed as a simple power law relationship of the form . Various measurements of the power law exponent for can be found in the literature for cluster samples typically limited in mass to M⊙. Stott et al. (2010) find a power law index of for a sample of 20 X-ray luminous clusters identified from either their X-ray emission or various optical methods. Stott et al. (2012) obtain an index of from 103 clusters chosen from the XCS first release by applying a redshift cutoff of . Finally, Lidman et al. (2012) combine data from Stott et al. (2010) and Stott et al. (2012) with a sample of SpARCS clusters identified as galaxy overdensities in deep IR observations to obtain an index of .
XXL-100-GC provides an important perspective on the relationship between BCG and cluster masses as it samples a range of clusters masses typically lower than those studied in the literature and because it includes additional diagnostic information on the relaxation state of each cluster. For the purpose of this analysis we assume that a relaxed cluster is either characterised by the presence of a cool-core, indicated by a high value of cSB, or a dynamically relaxed BCG, indicated by a low value of normalised offset from the centroid.
We therefore perform a number of fits to the slope of versus employing different assumptions. The best fit was obtained employing minimization and resampling the data 100,000 times assuming data uncertainties are normally distributed, taking the median index value and standard deviation. The results are indicated in Table 2 and in Figure 6. We perform an unweighted fit to the mass data points to provide a baseline description of the relationship. We also perform a fit employing cluster cSB values as a simple weighting function in order to weight the contribution of relaxed clusters in the relationship. A similar fit employing inverse cSB values weights the relationship toward unrelaxed clusters. Finally we also perform fits using only clusters with BCGs located a small or large offset radii to perform an alternative description of the relationship for relaxed or unrelaxed clusters respectively.
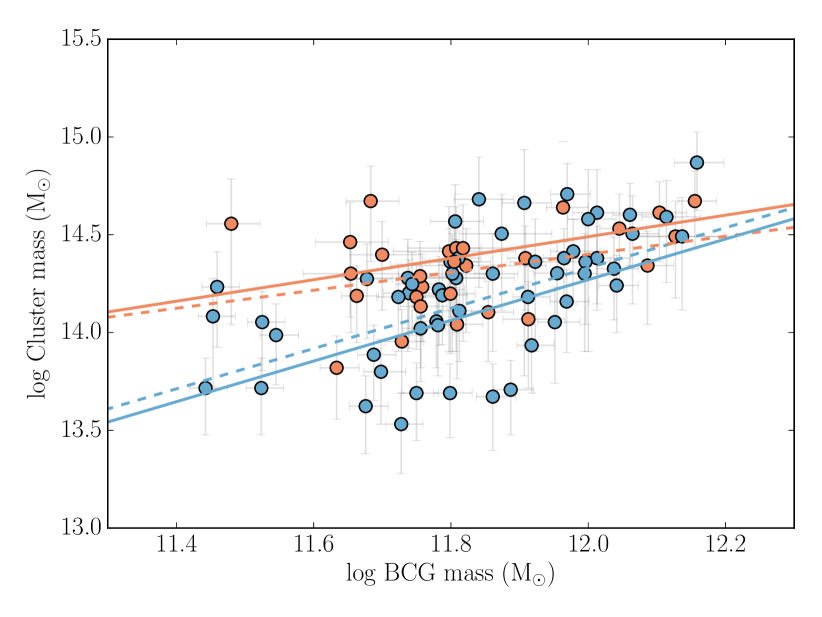
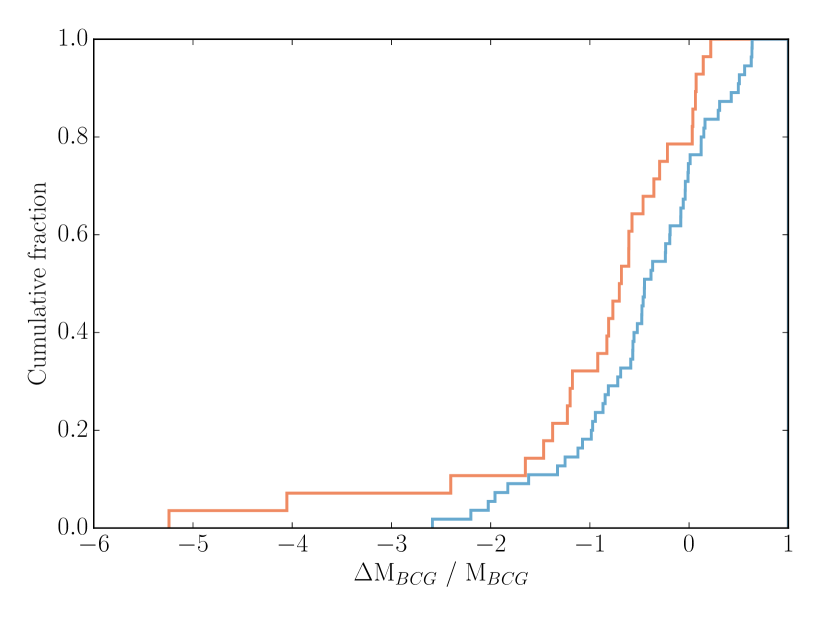
The fit results for BCGs located in relaxed clusters is consistent with the scenario where the BCG stellar mass is proportional to the total cluster mass. The fit normalisation is such that the BCG stellar mass represents an approximately constant 1% of the total cluster mass. The fit results also indicate that, at fixed cluster mass, BCGs in unrelaxed clusters are less massive than BCGs in relaxed clusters by up to 0.5 dex. This impression is characterized by the trend for BCGs in unrelaxed clusters to lie predominantly to the left of the versus relationship defined by relaxed clusters as shown in Figure 6. To test the significance of this trend, we define a simple normalized distance measure from the relaxed relation. For each BCG, we measure the distance between the expected BCG mass at the host cluster mass, normalized by the BCG mass (denoted ). In other words, the difference between the BCG mass and how massive is the BCG expected to be if it were in a relaxed cluster with its host cluster mass.
| Case | log | # | |
|---|---|---|---|
| All clusters | 0.84 | 4.33 | 85 |
| cSB weighted | 1.04 | 1.79 | - |
| (cSB)-1 weighted | 0.55 | 7.89 | - |
| BCG offset | 1.03 | 1.97 | 55 |
| BCG offset | 0.46 | 8.88 | 30 |
Figure 7 shows the cumulative distribution of BCGs mass lag measurement . A Shapiro test for normality reveals that BCGs located in relaxed clusters are normally distributed (although the mean is not zero) while the BCGs located in unrelaxed clusters are not and follow more closely a log-normal distribution. To compare the distributions, we employ an Anderson-Darling test. This nonparametric test is used to assess wether or not two samples come from the same distribution by computing the maximum deviation between their cumulative distribution. It is very similar to the Kolmogorov-Smirnov test but differs in that it is better suited to samples with different mean values or outliers. We find that we can reject the null hypothesis that the samples are drawn from the same distribution with 95% confidence (p-value), a value that goes up to 99.6% (p-value) if we compare clusters with offset lower than 0.05 to ones with offsets greater than 0.1.
4.5 m12 and the BCG merger history
The luminosity gap between the first and second brightest cluster members, m12, provides a measure of cluster galaxy evolution. The hierarchical accretion model of galaxy growth predicts that the BCG within a cluster should grow in mass faster than non-central, non-dominant galaxies as the BCG is located at the centre of the cluster potential to which less massive galaxies migrate via dynamical friction. Therefore, if BCGs grow via such accretion, one expects the luminosity gap to grow with every accreted galaxy (e.g. Smith et al., 2010; Raouf et al., 2014). Cluster-scale merger events can affect the evolution of m12 as they can add bright galaxies, reducing the luminosity gap.
To compute m12 for each cluster we first define cluster membership. Since have we only photometric redshifts for most non-BCG galaxies, we put stringent constraints on the membership classification to reduce contamination. We define a galaxy as a member of a given cluster if the cluster redshift is within the 1- range of the photometric redshift of the galaxy and the galaxy lies within of the X-ray centroid. If the galaxy has a spectroscopic redshift, it is used instead of the photometric redshift. A galaxy then has to be within 3000 km s-1 of the cluster to be considered a member. We then set the value of m12 as the difference in z-mag between the BCG and the second brightest member.
We apply a Spearman rank correlation test to determine the extent to which m12 is correlated with measurements of BCG mass and mass-lag across the XXL-100-GC sample. Noting that one also expects m12 to increase with time, we compute correlation values correcting for any partial correlation with redshift according to the formula:
where is the Spearman rank correlation between A and B, corrected for C. This test indicates that m12 is correlated positively with BCG mass and at 99.5% and 99.8% confidence level respectively and that m12 is a reliable tracer of BCG mass growth. Individual values of m12 can be found in Table LABEL:bcg_position.
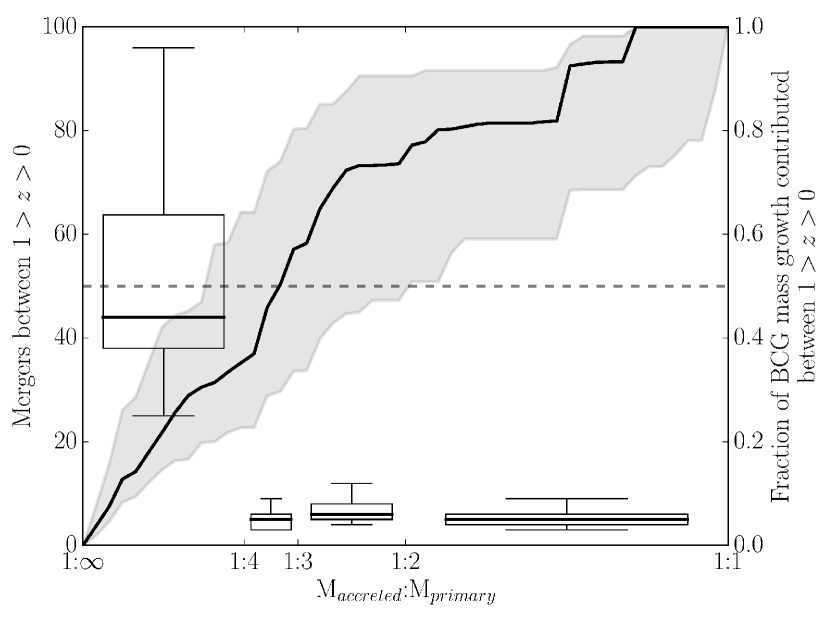
The value of m12 does not indicate the mass distribution of accreted galaxies. To address this question we consider the results on BCG growth taken from the Millennium Simulation (Springel et al. 2005) at using the DeLucia2006a semi-analytical galaxy models data presented in De Lucia & Blaizot (2007). These models were obtained from the Millennium database101010http://gavo.mpa-garching.mpg.de/portal/ (Lemson 2006). One hundred BCGs were randomly selected at from clusters with MM⊙, i.e. the average XXL-100-GC cluster mass. For each BCG we obtain the merger tree between and (Lemson & Springel 2006).
Figure 8 shows the distribution of the number of mergers in bins of mass ratio for the 100 BCGs in addition to the fractional contribution to the BCG mass. From the Figure it is clear that one-half of the BCG mass is each contributed from mergers at mass ratios greater than and less than a value of . Although there is a certain amount of scatter about the mean relationship displayed in Figure 8, the results from simulations appear to be in broad agreement with those of Burke & Collins (2013) obtained with HST imaging of BCGs and their bound companions around .
4.6 Luminosity segregation
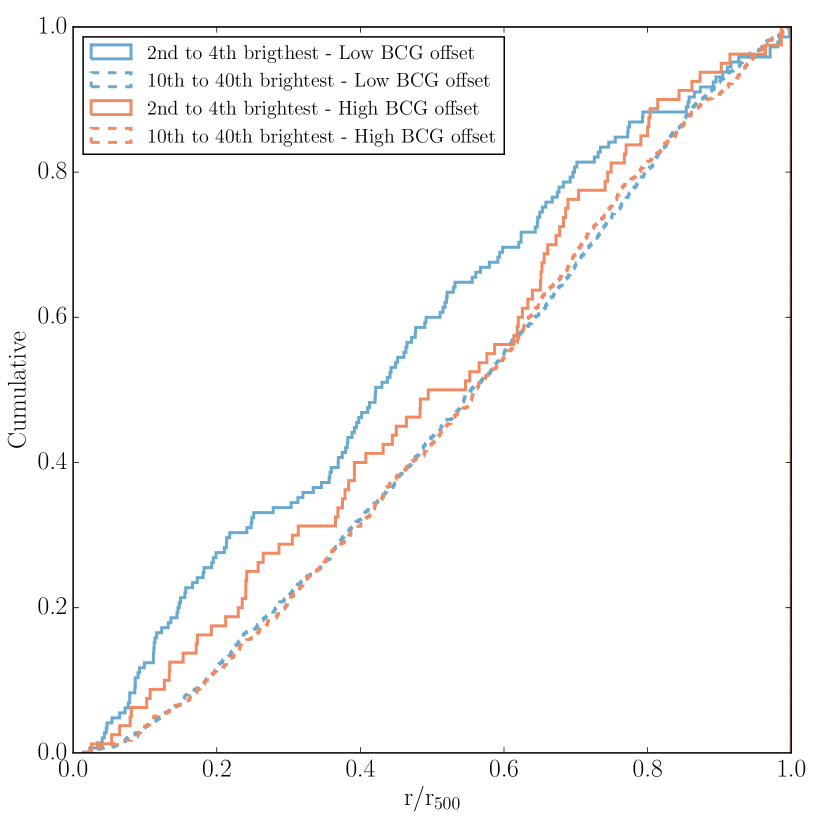
An alternative diagnostic of the hierarchical accretion of cluster galaxies is to consider their luminosity segregation. A prediction of this hypothesis is that the central regions of a galaxy cluster should be overabundant in bright galaxies relative to faint as brighter (i.e. more massive) galaxies are expected to migrate faster to the cluster centre under the influence of dynamical friction. One further expects that this overabundance of bright galaxies will be more marked in relaxed clusters compared to those which are unrelaxed.
The luminosity segregation method proposed by Lidman et al. (2013) compares the cumulative spatial distribution of bright galaxies to faint ones. They employ a two sample KS test on the two distributions and find a significant difference in the radial distribution of faint and bright galaxies yet note that this result is very sensitive to the arbitrary maximum radius to which the calculation is performed. Unlike Lidman et al., we know the value of for all the clusters and use it as the maximum radius. Although still arbitrary, the use of as the maximum radius used in the same calculation applied to the XXL-100-GC sample does at least provide a consistent and physically-motivated maximum radius for each cluster.
We compare the cumulative radial distribution of bright and faint cluster members in XXL-100-GC clusters. We define bright galaxies as the 2nd, 3rd and 4th brightest members. Faint galaxies are defined as the 10th to 40th brightest members. Figure 9 shows the cumulative distributions of faint and bright galaxies within for the relaxed and unrelaxed clusters. A two-sample Anderson-Darling test reveals that the radial distribution of bright galaxies in unrelaxed clusters (red) is not very different than that of faint ones (p-value, 30 clusters). However, in relaxed clusters (blue) a significant difference exists (p-value, 55 clusters).
4.7 H star formation
Brightest cluster galaxies typically appear as passively evolving stellar populations. However, observed stellar masses grow by a factor between and the present epoch (Lidman et al., 2012). Active star formation in BCGs is observed and in the literature has been interpreted as evidence for inflows of cool gas within the cluster potential (e.g. Donahue et al. 1992; Edge et al. 1992; O’Dea et al. 2010). Evidence of active star formation associated with an infall of gas from cooling flows is also observed by Sanderson et al. (2009) in the spectra of some BCGs in the LoCuSS sample. We assess the presence of active star formation in the sample of XXL-100-GC BCGs by focussing on a sub-sample of 30 BCGs in the Northern field with for which H emission fluxes have been measured by the SDSS Portsmouth group from dust extinction-corrected DR12 data (Thomas et al. 2013).
Although the spectra have high signal-to-noise ratio (SNR), only half of the BCGs show H emission detection with a line SNR down to an observed flux of erg cm-2 s-1. Using the classical H flux to SFR conversion from Osterbrock & Ferland (2005) and the stellar masses we determined in Section 4.3, we confirm that none of the BCGs in XXL-N shows a sSFR greater than yr-1. While the exact value of the star formation rate expected for a passive BCG is unclear, observations and simulations provide some guidance. Zwart et al. (2014) use 1.4GHz VLA data from a selected sample of galaxies in the VIDEO survey to deduce a sSFR of yr-1 for elliptical galaxies with . Henriques et al. (2012) find a sSFR of yr-1 for similar masses and redshift in simulations.
We therefore conclude that none (less than 3%) of XXL-100-GC BCGs display evidence for enhanced star formation above that expected for field ellipticals of comparable mass and redshift. It is important to note that we do not possess any spectroscopic emission line constraint on the current SFR in XXL-100-GC BCGs.
4.8 Red sequence offset
The analysis of XXL-100-GC BCG stellar masses (Section 4.3) and H emission line fluxes at (Section 4.7) indicate that these BCGs display low specific star formation rates. However, we note that because of a combination of the wavelength coverage of SDSS spectroscopy and the fact that the majority of BCGs are located at , these tests are weighted towards the properties of low redshift BCGs within the XXL-100-GC sample. There are 19 BCGs at , meaning we are left uninformed on possible star formation in a fifth of the sample. This section tries to address this with an alternative test of star formation in XXL-100-GC BCGs based on the magnitude of BCG colour offsets from their host cluster red sequences. As Figure 10 indicates, the -correction applied to galaxies at greater redshift is more sensitive to deviations from the assumption that BCG spectra are described by an old, passively evolving single stellar population (SSP).
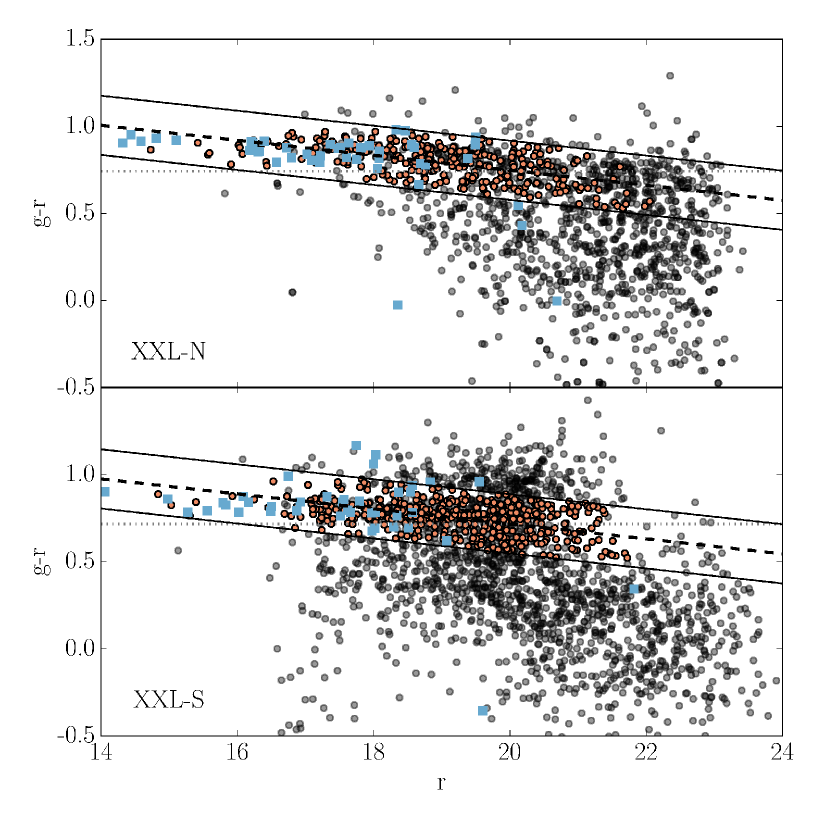
We separately create a single stacked colour magnitude diagram for all cluster member galaxies located within each of the XXL-N and XXL-S fields. We apply a -correction based upon the best-fitting star formation history obtained in Section 4.3 and a distance modulus correction to stack all member galaxy photometry at an assumed . Member galaxies are selected employing the criteria outlined in Section 4.5. We determine the location of the stacked cluster red sequence on each colour magnitude diagram employing an iterative process. Firstly, considering only galaxies with M, we fit a simple double Gaussian distribution to the colour distribution of member galaxies and define the red sequence cutoff as the color at which the contribution of blue and red galaxies are equal. We then fit a linear red sequence from those galaxies redder than this cutoff and, using the criterion for blue galaxies from Butcher & Oemler (1984), we refine the red sequence by re-selecting red galaxies as the ones for which colour falls within of the linear fit. This process is repeated until it converges and the slope in XXL-S is fixed to be the same as the one in XXL-N. Doing so makes the red sequence in XXL-S slightly steeper but limits the contribution of the large number of dubious galaxies in the field that may be caused by the larger photometric errors in this field. Figure 11 shows the resulting colour-magnitude diagram (corrected to SDSS ) of all member galaxies from both fields after - and distance modulus correction.
The resulting distribution of BCG offsets from the stacked red sequence in each field is consistent with a Gaussian distribution of zero mean. In both XXL-N and XXL-S, the distribution has a standard deviation : a relatively small deviation that indicates that most BCGs lie close to the red sequence. It is perhaps no surprise that the XXL-100-GC BCGs lie at low colour offset from the red sequence: these represent the bulk of the systems for which we have good quality spectroscopy and to which the SFH analysis applied in Section 4.3 is most sensitive.
As mentioned previously, earlier analyses indicate that XXL-100-GC BCGs have passively evolving SFHs. However, Figure 10 indicates that the -correction applied to transform a BCG at to the colour-magnitude plane is very sensitive to deviations from an assumed old, co-eval SSP model. SSP models computed assuming Gyrs fall within our confidence limits displayed in Figure 4. One can therefore employ the absence of BCGs with and large colour offsets from the stacked red sequence as evidence that these systems are also consistent with SSP models possessing Gyrs. In fact, out of the 19 BCGs at , we find only one with an offset that can only be explained with a Gyrs: XLSSC 546. It is unfortunate that this system lacks a spectroscopic redshift which might indicate the presence of active star formation. However, a closer inspection of the X-ray contours of XLSSC 546 reveals that the BCG sits within one of two X-ray peaks observed in the cluster, suggesting the cluster is disturbed and possibly experiencing a merger event.
5 Discussion
We have determined that, within the sub-sample of relaxed XXL-100-GC clusters, the BCG stellar mass is linearly related to the cluster weak lensing mass. We compute a value of and respectively for the power-law index of the Mcluster - MBCG relation for XXL-100-GC clusters which appear relaxed either via their weighting or based upon low BCG offset (). These index values are generally lower than reported in the literature and may be due to three considerations: 1) the XXL-100-GC sample extends to lower mass clusters, 2) we explicitly differentiate between relaxed and unrelaxed systems and 3) flux-selected samples like XXL-100-GC and HIFLUGCS contain a larger fraction of disturbed systems compared to luminosity selected cluster samples. Lower cluster mass correlates with lower member galaxy velocity dispersions (Willis et al., 2005). As the cluster velocity dispersion approaches that of the BCG, the effective merger cross section increases rapidly (e.g. Makino & Hut, 1997). This assertion is supported by various analysis (e.g.: Gonzales et al. 2007; Leauthaud et al. 2012; Coupon et al. 2015; Ziparo et al. 2016) that indicate that BCGs contribute a greater fraction of the total cluster stellar luminosity in lower mass clusters, as expected if stellar mass is more efficiently accreted by the BCG.
Perhaps more important than the exact value of the slope of the Mcluster - MBCG relation is the result that relation is statistically different for relaxed and unrelaxed clusters. The relation for clusters with a disturbed BCG is much shallower at and respectively for clusters weighted by inverse or for large BCG offset (). This indicates that, when a cluster gains mass via a merger, the BCG stellar mass initially lags behind the value expected for a dominant galaxy in a cluster with the mass of the merged host. The effect of a cluster-scale merger is therefore more readily detectable via the increased cluster mass (inferred from the ICM temperature) rather than the stellar mass of the BCG.
Although star formation in BCGs can be caused by the infall of gas from cooling flows, XXL-100-GC clusters display low central gas concentrations. Within XXL-100-GC we have used spectroscopic observations of the H line as a direct star formation indicator for a third of the sample. We find no H-determined sSFRs above the value observed in similar mass, passive galaxies in the field.
Furthermore, the analysis of BCG offsets from the global cluster red sequence indicates that only one high redshift BCG in XXL-100-GC, located in a potentially merging cluster, shows evidence for a stellar population described by a declining star formation rate of timescale Gyrs. In fact, the almost complete absence of active star formation observed in the BCG population motivates our choice of a single stellar population model to describe the SFH of XXL-100-GC BCGs. The population of XXL-100-GC BCGs therefore appears to be homogeneously passive irrespective of the relaxation state of the parent cluster. This realisation is in agreement with results from Webb et al. (2015) and McDonald et al. (2016) indicating that dry mergers are the dominant source of growth in BCGs at . Another important factor at play is that XXL-100-GC clusters are less massive on average than their LoCuSS and CLASH counterparts. Liu et al. (2012) show that the incidence of star formation in BCGs increases with cluster richness and X-ray luminosities, both cluster mass proxies. In agreement with what we report in this work, XXL-100-GC clusters should host BCGs with significantly lower star formation on average than those in the LoCuSS and CLASH sample.
Figure 9 indicates that bright galaxies have a dominant contribution at low radii in clusters with a BCG offset of . In this case, an Anderson Darling test between bright and faint galaxies indicates that we can exclude that they come from the same distribution at 99.99%. The same test applied clusters with a BCG offset of cannot exclude the null hypothesis. The test suggests that, as the cluster evolves, so does the galaxy distribution. This is important as such infalling bright galaxies could present a major source of BCG stellar mass growth via major mergers as they contribute typically half of the BCG growth according to Burke & Collins (2013) and our results from Section 4.5. However, we note that the statistical significance varies according to what we define as a bright or faint galaxy. Nevertheless, the results generally indicate the presence of mass segregation.
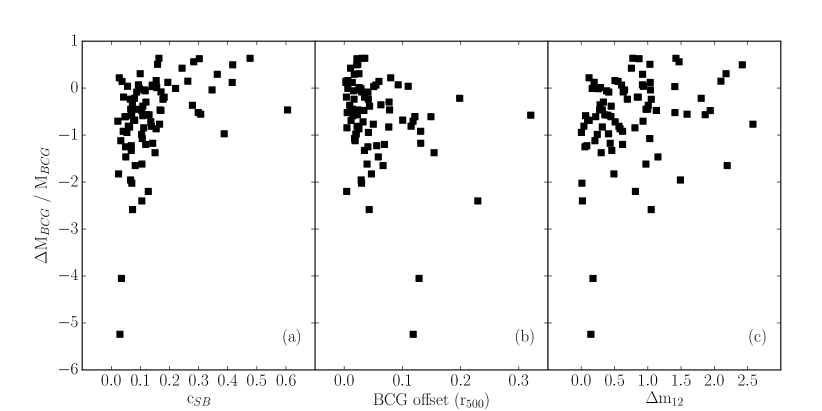
In Figure 12, we attempt to combine a number of observational measures to generate an overview of BCG evolution in galaxy clusters. The leftmost panel of Figure 12 reveals that we observe no XXL-100-GC BCGs with a high mass lag (negative values) in clusters where the X-ray gas is very relaxed. The BCG is clearly gaining stellar mass and reducing the inferred mass lag before the bulk of the X-ray gas can settle in the cluster potential. This point is relevant as the XXL-100-GC BCGs show essentially no evidence for active star formation. This in turn indicates an absence of significant gas accretion as the gas remains disturbed on timescales longer than stellar mass accretion to the BCG.
The middle panel of Figure 12 shows that the BCG grows in stellar mass relative to the total cluster mass as the BCG moves toward the centre of the X-ray emitting gas (which we interpret as the centre of the cluster potential). A range of trajectories appear to converge toward the upper left corner of the diagram (zero mass lag), indicating a certain amount of scatter in the stellar mass growth history of individual BCGs. However, despite this scatter, the absence of points in the lower left region of the diagram indicates that there exist no relaxed clusters in which the BCG displays a significant mass lag.
The right panel in Figure 12 indicates that the stellar mass in the BCG grows relative to the second brightest cluster galaxy (a similar trend is observed whether one employs the 2nd, 3rd or 4th brightest galaxy as a reference) as it also grows relative to the total cluster mass. The analysis of luminosity segregation contained in Section 4.6 indicates that bright galaxies in relaxed clusters are preferentially located at low cluster centric radius compared to both bright galaxies in unrelaxed clusters and faint galaxies in all clusters. We interpret this result as the effect of dynamical friction operating undisturbed in relaxed clusters. The accretion of such bright, infalling galaxies onto XXL-100-GC BCGs provides a compelling statistical explanation for the trend of versus mass lag shown in the right panel of Figure 12 and appears to agree well with simulations which indicate that major mergers might contribute 50% on average of the stellar mass growth in BCGs at .
Finally, BCGs at low-, intermediate- and high-z all broadly cover the same regions of Figure 12. This impression can be further verified by the application of a Spearman rank correlation test. For all indicators (, BCG offset and ), we find no significant difference in the correlation with BCG mass lag when performing a regular test compared to a partial test correcting for redshift. This would appear to indicate that, although the merger rate of clusters may vary in a secular fashion with cluster mass and redshift, the physical response of the BCG to these stochastic events is independent of redshift.
Conclusion
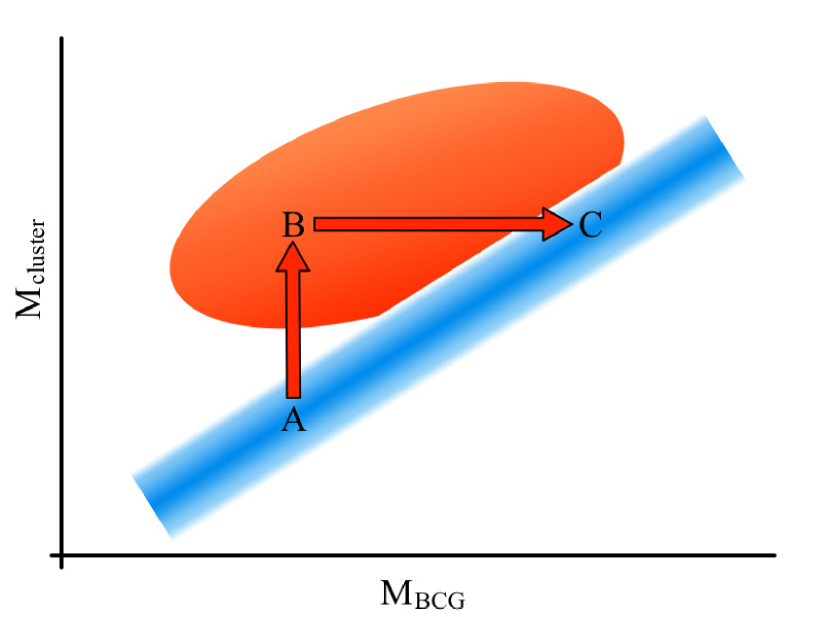
The story told by XXL-100-GC can be summarized by a cartoon presented in Figure 13. In this scenario, an idealized cluster is initially relaxed and the BCG mass is such that it lies at point A, in agreement with the relationship . Following a cluster-scale merger event, the cluster mass increases and the ICM of the merged cluster is shock heated to the virial temperature of the new system. Any cool core system present is disrupted and the BCG is displaced from the centre of the cluster potential. At this moment, the system is located at point B in Figure 13: the ICM temperature reflects the total mass of the system but the BCG now lags in mass relative to the cluster. As the cluster begins to relax, the BCG and other bright galaxies preferentially migrate to the cluster centre under the influence of dynamical friction. These bright galaxies ultimately merge with the BCG, both increasing the BCG stellar mass relative to the cluster and increasing the value of . At this instance in time the cluster approaches point C on Figure 13.
Despite the outline above several questions remain: Can the rate of BCG stellar mass accretion be quantified by searching for morphological evidence of merging in high-spatial resolution images of BCGs (e.g. Liu et al., 2015)? In addition, how does the relationship between Mcluster and MBCG, which is observed to steepen in cluster samples of greater mass (Stott et al. 2010; Lidman et al. 2012; Stott et al. 2012), depend upon the inferred relaxation state? At what cluster mass does cooling-flow induced BCG star formation become an important mechanism for BCG stellar mass growth (e.g. Sanderson et al., 2009)? A sensible extension to this work would therefore be to study the properties of BCG mass lags in a sample of clusters of higher typical mass than XXL-100-GC.
Acknowledgments
XXL is an international project based around an XMM-Newton Very Large Programme surveying two 25 deg2 extragalactic fields at a depth of erg cm-2 s-1 in the [0.5-2] keV band for point-like sources. The XXL website is http://irfu.cea.fr/xxl.
This paper uses data from observations obtained with MegaPrime/MegaCam, a joint project of CFHT and CEA/IRFU, at the Canada-France-Hawaii Telescope (CFHT) which is operated by the National Research Council (NRC) of Canada, the Institut National des Science de l’Univers of the Centre National de la Recherche Scientifique (CNRS) of France, and the University of Hawaii. This work is also based in part on data products produced at Terapix available at the Canadian Astronomy Data Centre as part of the Canada-France-Hawaii Telescope Legacy Survey, a collaborative project of NRC and CNRS.
This research uses data from the VIMOS VLT Deep Survey, obtained from the VVDS database operated by Cesam, Laboratoire d’Astrophysique de Marseille, France.
Based in part on data acquired through the Australian Astronomical Observatory
This paper uses data from the VIMOS Public Extragalactic Redshift Survey (VIPERS). VIPERS has been performed using the ESO Very Large Telescope, under the ”Large Programme” 182.A-0886. The participating institutions and funding agencies are listed at http://vipers.inaf.it.
GAMA is a joint European-Australasian project based around a spectroscopic campaign using the Anglo-Australian Telescope. The GAMA input catalogue is based on data taken from the Sloan Digital Sky Survey and the UKIRT Infrared Deep Sky Survey. Complementary imaging of the GAMA regions is being obtained by a number of independent survey programmes including GALEX MIS, VST KiDS, VISTA VIKING, WISE, Herschel-ATLAS, GMRT and ASKAP providing UV to radio coverage. GAMA is funded by the STFC (UK), the ARC (Australia), the AAO, and the participating institutions. The GAMA website is http://www.gama-survey.org/.
Funding for SDSS-III has been provided by the Alfred P. Sloan Foundation, the Participating Institutions, the National Science Foundation, and the U.S. Department of Energy Office of Science. The SDSS-III web site is http://www.sdss3.org/.
Based in part on data acquired through the Australian Astronomical Observatory, under programs A/2013A/018 and A/2013B/001,and on observations at Cerro Tololo Inter-American Observatory, National Optical Astronomy Observatory (NOAO Prop. IDs 2013A-0618 and 2015A-0618), which is operated by the Association of Universities for Research in Astronomy (AURA) under a cooperative agreement with the National Science Foundation. This project used data obtained with the Dark Energy Camera (DECam), which was constructed by the Dark Energy Survey (DES) collaboration.
This paper uses data from observations made with the William Herschel Telescope operated on the island of La Palma by the Isaac Newton Group in the Spanish Observatorio del Roque de los Muchachos of the Instituto de Astrofísica de Canarias.
The Millennium Simulation databases used in this paper and the web application providing online access to them were constructed as part of the activities of the German Astrophysical Virtual Observatory (GAVO).
O.M. is grateful for the financial support provided by the NEWFELPRO fellowship project in Croatia.
References
- Adami et al. (1998) Adami C., Biviano A., Mazure A., 1998, A&A, 331, 439
- Adami et al. (2011) Adami C., et al., 2011, A&A, 526, A18
- Ahn et al. (2014) Ahn C. P., et al., 2014, ApJSS, 211, 17
- Baldry et al. (2014) Baldry I. K., et al., 2014, MNRAS, 441, 2240
- Benítez (2000) Benítez N., 2000, ApJ, 536, 571
- Bernardi et al. (2007) Bernardi M., Hyde J. B., Sheth R. K., Miller C. J., Robert R. C., 2007, AJ, 133, 1741
- Bertin (2011) Bertin E., 2011, ASPC, 442, 435
- Bertin & Arnouts (1996) Bertin E., Arnouts S., 1996, A&AS, 117, 393
- Bildfell et al. (2008) Bildfell C., Hoekstra H., Babul A., Mahdavi A., 2008, MNRAS, 389, 1637
- Bîrzan et al. (2012) Bîrzan L., Rafferty D. A., Nulsen P. E. J., McNamara B. R., Röttgering H. J. A., Wise M. W., Mittal R., 2012, MNRAS, 427, 3468
- Biviano et al. (2002) Biviano A., Katgert P., Thomas T., Adami C., 2002, A&A, 387, 8
- Bleem et al. (2015) Bleem L. E., Stalder B., Brodwin M., Busha M. T., Gladders M. D., High F. W., Rest A., Wechsler R. H., 2015, ApJSS, 216, 20
- Bruzual & Charlot (2003) Bruzual G., Charlot S., 2003, MNRAS, 344, 1000
- Burke & Collins (2013) Burke C., Collins C. A., 2013, MNRAS, 434, 2856
- Butcher & Oemler (1984) Butcher H., Oemler A. J., 1984, ApJ, 285, 426
- Chabrier (2003) Chabrier G., 2003, PASP, 115, 763
- Chandrasekhar (1943) Chandrasekhar S., 1943, ApJ, 97, 255C
- Clerc et al. (2014) Clerc N., et al., 2014, MNRAS, 444, 2723
- Clerc et al. (2012) Clerc N., Pierre M., Pacaud F., Sadibekova T., 2012, MNRAS, 423, 3545
- Collins et al. (2009) Collins C. A., et al., 2009, Nature, 458, 603
- Conroy et al. (2009) Conroy C., Gunn J. E., White M., 2009, ApJ, 699, 486
- Coupon et al. (2009) Coupon J., et al., 2009, A&A, 500, 981
- Coupon et al. (2015) Coupon J., et al., 2015, MNRAS, 449, 1352
- Crawford et al. (1999) Crawford C. S., Allen S. W., Ebeling H., Edge A. C., Fabian A. C., 1999, MNRAS, 306, 857
- Dawson et al. (2013) Dawson K. S., et al., 2013, AJ, 145, 10
- De Lucia & Blaizot (2007) De Lucia G., Blaizot J., 2007, MNRAS, 375, 2
- De Lucia et al. (2006) De Lucia G., Springel V., White S. D. M., Croton D., Kauffmann G., 2006, MNRAS, 366, 499
- Desai et al. (2012) Desai S., et al., 2012, ApJ, 757, 83
- Donahue et al. (1992) Donahue M., Stocke J. T., Giola I. M., 1992, ApJ, 385, 49
- Dressler et al. (1997) Dressler A., et al., 1997, ApJ, 490, 577
- Edge et al. (1992) Edge A. C., Stewart G. C., Fabian A. C., 1992, MNRAS, 258, 177
- Edwards et al. (2007) Edwards L. O. V., Hudson M. J., Balogh M. L., Smith R. J., 2007, MNRAS, 379, 100
- Edwards & Patton (2012) Edwards L. O. V., Patton D. R., 2012, MNRAS, 425, 287
- Eisenstein et al. (2011) Eisenstein D. J., et al., 2011, AJ, 142, 72
- Elliott et al. (2015) Elliott J., de Souza R. S., Krone-Martins A., Cameron E., Ishida E. E. O., Hilbe J., 2015, Astron. & Comp., 10, 61
- Fabian (2012) Fabian A. C., 2012, ARA&A, 50, 455
- Flaugher et al. (2015) Flaugher B., et al., 2015, AJ, 150, 150
- Garilli et al. (2014) Garilli B., et al., 2014, A&A, 562, A23
- Giles et al. (2016) Giles P. A., et al., 2016, A&A, 592, A3 (XXL paper III)
- Gonzales et al. (2007) Gonzales A. H., Zaritsky D., Zabuldoff A. I., 2007, ApJ, 666, 147
- Gunn et al. (2006) Gunn J. E., et al., 2006, AJ, 131, 2332
- Guo & Oh (2009) Guo F., Oh S. P., 2009, MNRAS, 400, 1992
- Guzzo et al. (2014) Guzzo L., et al., 2014, A&A, 566, A108
- Gwyn (2012) Gwyn S. D. J., 2012, AJ, 143, 38
- Haarsma et al. (2010) Haarsma D. B., et al., 2010, ApJ, 713, 1037
- Henriques et al. (2012) Henriques B. M. B., White S. D. M., Lemson G., Thomas P. A., Guo Q., Marleau G.-D., Overzier R. A., 2012, MNRAS, 421, 2904
- Hopkins et al. (2012) Hopkins A. M., et al., 2012, MNRAS, 430, 2047
- Hudson et al. (2010) Hudson D. S., Mittal R., Reiprich T. H., Nulsen P. E. J., Andernach H., Sarazin C. L., 2010, A&A, 513, 37
- Ilbert et al. (2006) Ilbert O., et al., 2006, A&A, 457, 841
- Le Brun et al. (2014) Le Brun A. M. C., McCarthy I. G., Schaye J., Ponman T. J., 2014, MNRAS, 441, 1270
- Le Fèvre et al. (2003) Le Fèvre O., et al., 2003, Proc. SPIE 4841, Instrument Design and Performance for Optical/Infrared Ground-based Telescopes, 1670
- Le Fèvre et al. (2005) Le Fèvre O., et al., 2005, A&A, 439, 845
- Leauthaud et al. (2012) Leauthaud A., et al., 2012, ApJ, 744, 159
- Lemson (2006) Lemson G., 2006, astro-ph/0608019
- Lemson & Springel (2006) Lemson G., Springel V., 2006, Astronomical Data Analysis Software and Systems XV, ASP Conf. Ser. Vol. 351, Cosmological Simulations in a Relational Database: Modelling and Storing Merger Trees
- Lidman et al. (2012) Lidman C., et al., 2012, MNRAS, 427, 550
- Lidman et al. (2013) Lidman C., et al., 2013, MNRAS, 433, 825
- Lidman et al. (2016) Lidman C., et al., 2016, PASA, 33, 1
- Lieu et al. (2016) Lieu M., et al., 2016, A&A, 592, A4 (XXL paper IV)
- Liske et al. (2015) Liske J., et al., 2015, MNRAS, 452, 2087
- Liu et al. (2013) Liu F. S., et al., 2013, ApJ, 769, 147
- Liu et al. (2015) Liu F. S., Lei F. J., Meng X. M., Jiang D. F., 2015, MNRAS, 447, 1491
- Liu et al. (2009) Liu F. S., Mao S., Deng Z. G., Xia X. Y., Wen Z. L., 2009, MNRAS, 396, 2003
- Liu et al. (2012) Liu F. S., Mao S., Meng X. M., 2012, MNRAS, 423, 422
- Liu et al. (2008) Liu F. S., Xia X. Y., Mao S., Wu H., Deng Z. G., 2008, MNRAS, 385, 23
- McDonald et al. (2016) McDonald M., et al., 2016, ApJ, 817, 86
- McIntosh et al. (2008) McIntosh D. H., Guo Y., Hertzberg J., Katz N., Mo H. J., van den Bosch F. C., Yang X., 2008, MNRAS, 388, 1537
- Makino & Hut (1997) Makino J., Hut P., 1997, ApJ, 481, 83
- Maraston et al. (2013) Maraston C., et al., 2013, MNRAS, 435, 2764
- Menanteau et al. (2010) Menanteau F., et al., 2010, ApJSS, 191, 340
- Merritt (1984) Merritt D., 1984, ApJ, 276, 26
- Merritt (1985) Merritt D., 1985, ApJ, 289, 18
- Merten et al. (2015) Merten J., Meneghetti M., Postman M., Umetsu K., Zitrin A., et al., 2015, ApJ, 806, 4
- Miller et al. (2013) Miller L., et al., 2013, MNRAS, 429, 2858
- Mohr et al. (2012) Mohr J. J., et al., 2012, Proc. SPIE, Software and Cyberinfrastructure for Astronomy II, 8451
- Navarro et al. (1997) Navarro J. F., Frenk C. S., White S. D., 1997, ApJ, 490, 493
- O’Dea et al. (2010) O’Dea K. P., et al., 2010, ApJ, 719, 1619
- Osterbrock & Ferland (2005) Osterbrock D. E., Ferland G. J., 2005, Astrophysics of Gaseous Nebulae and Active Galactic Nuclei. University Science Books, Herndon, VA
- Pacaud et al. (2006) Pacaud F., et al., 2006, MNRAS, 372, 578
- Pacaud et al. (2007) Pacaud F., et al., 2007, MNRAS, 382, 1289
- Pacaud et al. (2016) Pacaud F., et al., 2016, A&A, 592, A2 (XXL paper II)
- Pierre et al. (2007) Pierre M., Chiappetti L., Pacaud F., et al., 2007, MNRAS, 382, 279
- Pierre et al. (2006) Pierre M., et al., 2006, MNRAS, 372, 591
- Pierre et al. (2016) Pierre M., et al., 2016, A&A, 592, A1 (XXL paper I)
- Rafferty et al. (2008) Rafferty D. A., McNamara B. R., Nulsen P. E. J., 2008, ApJ, 687, 899
- Raouf et al. (2014) Raouf M., Khosroshahi H. G., Ponman T. J., Dariush A. A., Molaeinezhad A., Tavasoli S., 2014, MNRAS, 442, 1578
- Reiprich & Böhringer (2002) Reiprich T. H., Böhringer H., 2002, ApJ, 567, 716
- Ricker & Sarazin (2001) Ricker P. M., Sarazin C. L., 2001, ApJ, 561, 621
- Ruszkowski & Springel (2009) Ruszkowski M., Springel V., 2009, ApJ, 696, 1094
- Salpeter (1955) Salpeter E., 1955, ApJ, 121, 161
- Sanderson et al. (2009) Sanderson A. J. R., Edge A. C., Smith G. P., 2009, MNRAS, 398, 1698
- Sanderson et al. (2009) Sanderson A. J. R., Edge A. C., Smith G. P., 2009, MNRAS, 398, 1698
- Santos et al. (2008) Santos J. S., Rosati P., Tozzi P., Böhringer H., Ettori S., Bignamini A., 2008, A&A, 483, 35
- Santos et al. (2010) Santos J. S., Tozzi P., Rosati P., Böhringer H., 2010, A&A, 521, 64
- Saunders et al. (2004) Saunders W., et al., 2004, Proc. SPIE 5492, Ground-based Instrumentation for Astronomy, 389
- Schombert (1987) Schombert J. M., 1987, ApJSS, 64, 643
- Smee et al. (2013) Smee S. A., et al., 2013, AJ, 146, 32
- Smith et al. (2004) Smith G. A., et al., 2004, Proc. SPIE 5492, Ground-based Instrumentation for Astronomy, 410
- Smith et al. (2010) Smith G. P., et al., 2010, MNRAS, 409, 169
- Smith et al. (2015) Smith R. J., Lucey J. R., Conroy C., 2015, MNRAS, 449, 3441
- Springel et al. (2005) Springel V., et al., 2005, Nature, 435, 629
- Stott et al. (2010) Stott J. P., et al., 2010, ApJ, 718, 23
- Stott et al. (2012) Stott J. P., et al., 2012, MNRAS, 422, 2213
- Thomas et al. (2013) Thomas D., et al., 2013, MNRAS, 431, 1383
- Velander et al. (2014) Velander M., et al., 2014, MNRAS, 437, 2111
- Vulcani et al. (2016) Vulcani B., et al., 2016, ApJ, 816, 86
- Webb et al. (2015) Webb T. M. A., et al., 2015, ApJ, 814, 96
- Willis et al. (2005) Willis J. P., et al., 2005, MNRAS, 363, 675
- Zhang et al. (2011) Zhang Y.-Y., Andernach H., Caretta C. A., Reiprich T. H., Böhringer H., Puchwein E., Sijacki D., Girardi M., 2011, A&A, 526, A105
- Ziparo et al. (2016) Ziparo F., et al., 2016, A&A, 592, A9 (XXL paper X)
- Zwart et al. (2014) Zwart J. T. ., Jarvis M. J., Deane R. P., Bonfield D. G., Knowles K., Madhanpall N., Rahmani H., Smith D. J. B., 2014, MNRAS, 439, 1459
1 Department of Physics and Astronomy, University of Victoria, 3800 Finnerty Road, Victoria, BC, V8P 1A1, Canada
2 School of Physics and Astronomy, University of Birmingham, Birmingham B152TT, United Kingdom
3 Australian Astronomical Observatory, PO BOX 915, North Ryde, 1670, Australia
4 Université Aix-Marseille, CNRS, LAM (Laboratoire d’Astrophysique de Marseille) UMR 7326, 13388, Marseille, France
5 Argelander-Institut für Astronomie, University of Bonn, Auf dem Hügel 71, 53121 Bonn, Germany
6 Service d’Astrophysique AIM, CEA Saclay, F-91191 Gif sur Yvette, France
7 Max-Planck-Institut für extraterrestrische Physik, Giessenbach- straße, D-85748 Garching, Germany
8 H.H. Wills Physics Laboratory, University of Bristol, Tyndall Avenue, Bristol, BS8 1TL, UK
9 ESA, Villafranca del Castillo, Spain
10 Department of Astronomy, University of Florida, Gainesville, FL 32611, USA
11 Astrophysics Research Institute, Liverpool John Moores University, IC2, Liverpool Science Park, 146 Brownlow Hill, Liverpool L3 5RF, United Kingdom
12 INAF - Observatory of Rome, via Frascati 33, 00040 Monteporzio Catone, Rome, Italy
13 INAF, IASF Milano, via Bassini 15, I-20133 Milano, Italy
14 Faculty of Physics, Ludwig Maximilian Universität, München, Germany
15 Dipartimento di Fisica e Astronomia, Universita‘ di Bologna, Viale Berti Pichat 6/2, I-40127 Bologna, Italy
16 Institut d’Astrophysique Spatiale (IAS), bat. 121, 91405 Orsay Cedex, France
17 INAF, Osservatorio Astronomico di Brera, Merate, Italy
18 INAF, Osservatorio Astronomico di Padova, Vicolo dell’Osservatorio, 5, 35122, Padova, Italy
19 Department of Physics and Astronomy, Macquarie University, Sydney, NSW 2109, Australia
20 Main Astronomical Observatory, Academy of Sciences of Ukraine, 27 Akademika Zabolotnoho St., 03680 Kyiv, Ukraine
21 Department of Physics, University of Zagreb, Bijenicka cesta 32, HR-10000 Zagreb, Croatia
22 Universität Hamburg, Hamburger Sternwarte, Gojenbergsweg 112, 21029 Hamburg, Germany
23 Max-Planck Institut fuer Kernphysik, Saupfercheckweg 1, 69117 Heidelberg, Germany
24 Astronomical Observatory, Taras Shevchenko National University of Kyiv, Observatorna str. 3, 04053 Kyiv, Ukraine
25 Department of Astronomy, University of Geneva, ch. d’Écogia 16, CH-1290 Versoix
Appendix A BCG data
| Name | zcluster | M500 | r500 | BCG ra | BCG dec | zBCG | BCG offset | BCG mass | |||
|---|---|---|---|---|---|---|---|---|---|---|---|
| M⊙ | Mpc | J2000 | J2000 | (”) | r500 | M⊙ | z mag | ||||
| (1) | (2) | (3) | (4) | (5) | (6) | (7) | (8) | (9) | (10) | (11) | |
| XLSSC 001 | 0.614 | 25 | 0.777 | 36.2388 | -3.8147 | 0.617 | 7.6 | 0.067 | 5.01 | 2.19 | |
| XLSSC 003 | 0.836 | 19 | 0.643 | 36.9092 | -3.2992 | 0.838 | 1.3 | 0.015 | 6.42 | 0.07 | |
| XLSSC 006 | 0.429 | 41 | 0.982 | 35.4380 | -3.7674 | 0.429 | 17.4 | 0.100 | 12.70 | 0.10 | |
| XLSSC 010 | 0.330 | 17 | 0.751 | 36.8432 | -3.3609 | 0.330 | 3.9 | 0.025 | 6.06 | 1.94 | |
| XLSSC 011 | 0.054 | 17 | 0.831 | 36.5403 | -4.9682 | 0.050 | 3.4 | 0.004 | 2.88 | 0.81 | |
| XLSSC 022 | 0.293 | 11 | 0.671 | 36.9181 | -4.8586 | 0.295 | 3.8 | 0.025 | 6.01 | 0.65 | |
| XLSSC 023 | 0.328 | 11 | 0.655 | 35.1895 | -3.4333 | 0.328 | 7.5 | 0.054 | 6.44 | 0.61 | |
| XLSSC 025 | 0.265 | 16 | 0.751 | 36.3530 | -4.6791 | 0.264 | 1.8 | 0.010 | 6.13 | 1.01 | |
| XLSSC 027 | 0.295 | 17 | 0.768 | 37.0187 | -4.8499 | 0.294 | 25.8 | 0.149 | 5.73 | 0.22 | |
| XLSSC 029 | 1.050 | 22 | 0.626 | 36.0174 | -4.2240 | 1.050 | 3.8 | 0.050 | 6.64 | 2.58 | |
| XLSSC 036 | 0.492 | 24 | 0.801 | 35.5286 | -3.0540 | 0.496 | 5.4 | 0.041 | 10.30 | 1.05 | |
| XLSSC 041 | 0.142 | 10 | 0.670 | 36.3782 | -4.2385 | 0.143 | 1.4 | 0.005 | 3.51 | 1.41 | |
| XLSSC 050 | 0.141 | 23 | 0.897 | 36.4372 | -3.2091 | 0.142 | 93.0 | 0.258 | 5.28 | 0.37 | |
| XLSSC 054 | 0.053 | 11 | 0.723 | 36.3185 | -5.8870 | 0.054 | 3.3 | 0.005 | 3.35 | 0.81 | |
| XLSSC 055 | 0.232 | 21 | 0.843 | 36.4555 | -5.8962 | 0.233 | 5.9 | 0.026 | 10.90 | 1.04 | |
| XLSSC 056 | 0.348 | 22 | 0.824 | 33.8676 | -4.6781 | 0.347 | 18.3 | 0.110 | 12.20 | 0.94 | |
| XLSSC 057 | 0.153 | 13 | 0.734 | 34.0505 | -4.2394 | 0.154 | 8.2 | 0.030 | 6.49 | 0.63 | |
| XLSSC 060 | 0.139 | 47 | 1.136 | 33.6712 | -4.5673 | 0.140 | 54.6 | 0.118 | 14.30 | 0.93 | |
| XLSSC 061 | 0.259 | 11 | 0.678 | 35.4848 | -5.7588 | 0.259 | 4.2 | 0.025 | 8.94 | 2.18 | |
| XLSSC 072 | 1.002 | 19 | 0.613 | 33.8500 | -3.7256 | - | 1.9 | 0.025 | 5.46 | 0.58 | |
| XLSSC 083 | 0.430 | 37 | 0.943 | 32.7350 | -6.1985 | 0.429 | 4.8 | 0.030 | 6.40 | 0.01 | |
| XLSSC 084 | 0.430 | 36 | 0.945 | 32.7621 | -6.2130 | 0.432 | 18.6 | 0.119 | 3.02 | 0.15 | |
| XLSSC 085 | 0.428 | 41 | 0.976 | 32.8697 | -6.1963 | 0.429 | 2.9 | 0.018 | 10.30 | 1.03 | |
| XLSSC 087 | 0.141 | 8 | 0.619 | 37.7208 | -4.3478 | 0.141 | 3.4 | 0.014 | 4.87 | 1.04 | |
| XLSSC 090 | 0.141 | 4 | 0.507 | 37.1222 | -4.8565 | 0.142 | 4.4 | 0.022 | 4.74 | 2.42 | |
| XLSSC 091 | 0.186 | 51 | 1.149 | 37.9215 | -4.8825 | 0.185 | 17.2 | 0.047 | 9.32 | 0.49 | |
| XLSSC 093 | 0.429 | 23 | 0.810 | 31.7002 | -6.9471 | 0.429 | 6.0 | 0.042 | 6.30 | 0.00 | |
| XLSSC 096 | 0.520 | 48 | 1.000 | 30.9709 | -5.0279 | 0.521 | 6.9 | 0.043 | 6.93 | 1.05 | |
| XLSSC 097 | 0.760 | 32 | 0.794 | 33.3426 | -6.0990 | 0.695 | 4.3 | 0.041 | 7.48 | 0.06 | |
| XLSSC 098 | 0.297 | 20 | 0.801 | 33.1144 | -6.0751 | 0.296 | 5.3 | 0.034 | 7.26 | 1.13 | |
| XLSSC 099 | 0.391 | 46 | 1.032 | 33.2196 | -6.2033 | 0.361 | 5.7 | 0.029 | 8.07 | 1.49 | |
| XLSSC 100 | 0.915 | 26 | 0.694 | 31.5473 | -6.1920 | 0.915 | 6.0 | 0.069 | 6.27 | 0.62 | |
| XLSSC 101 | 0.756 | 31 | 0.788 | 32.1957 | -4.4310 | 0.753 | 21.0 | 0.198 | 13.40 | 1.80 | |
| XLSSC 103 | 0.233 | 27 | 0.913 | 36.8866 | -5.9644 | 0.232 | 13.7 | 0.056 | 6.42 | 0.08 | |
| XLSSC 104 | 0.294 | - | 1.038 | 37.3287 | -5.8872 | 0.291 | 31.6 | 0.135 | 6.75 | 0.12 | |
| XLSSC 105 | 0.429 | 47 | 1.024 | 38.4158 | -5.5109 | 0.452 | 23.3 | 0.129 | 4.82 | 0.18 | |
| XLSSC 106 | 0.300 | 24 | 0.856 | 31.3676 | -5.7324 | 0.302 | 61.1 | 0.320 | 8.10 | 0.40 | |
| XLSSC 107 | 0.436 | 16 | 0.711 | 31.3541 | -7.5945 | 0.439 | 2.1 | 0.017 | 5.48 | 0.35 | |
| XLSSC 108 | 0.254 | 13 | 0.705 | 31.8335 | -4.8252 | 0.255 | 8.9 | 0.051 | 7.15 | 1.41 | |
| XLSSC 109 | 0.491 | 23 | 0.787 | 32.2967 | -6.3453 | 0.487 | 3.0 | 0.023 | 8.37 | 0.32 | |
| XLSSC 111 | 0.299 | 40 | 1.017 | 33.1124 | -5.6265 | 0.300 | 5.0 | 0.022 | 11.50 | 0.57 | |
| XLSSC 112 | 0.139 | 9 | 0.653 | 32.5093 | -5.4678 | 0.138 | 24.5 | 0.093 | 5.35 | 0.92 | |
| XLSSC 113 | 0.050 | 5 | 0.560 | 30.5610 | -7.0082 | 0.051 | 1.7 | 0.003 | 3.34 | 0.19 | |
| XLSSC 114 | 0.234 | 44 | 1.070 | 30.4207 | -5.0302 | - | 16.8 | 0.059 | 9.19 | 1.15 | |
| XLSSC 115 | 0.043 | 12 | 0.740 | 32.6798 | -6.5797 | 0.043 | 30.3 | 0.035 | 2.84 | 0.46 | |
| XLSSC 502 | 0.141 | 5 | 0.532 | 348.4413 | -53.4368 | 0.140 | 5.0 | 0.023 | 6.29 | 1.47 | |
| XLSSC 503 | 0.336 | 10 | 0.642 | 350.6469 | -52.7470 | 0.334 | 3.8 | 0.029 | 5.70 | 0.26 | |
| XLSSC 505 | 0.055 | 9 | 0.661 | 352.2513 | -52.2364 | 0.055 | 6.7 | 0.011 | 8.27 | 0.76 | |
| XLSSC 507 | 0.566 | 12 | 0.612 | 353.3732 | -52.2537 | 0.569 | 7.4 | 0.080 | 8.18 | 0.12 | |
| XLSSC 509 | 0.633 | 29 | 0.806 | 356.4538 | -54.0466 | 0.635 | 26.7 | 0.230 | 4.50 | 0.02 | |
| XLSSC 510 | 0.395 | 15 | 0.711 | 357.5395 | -55.3331 | 0.395 | 2.3 | 0.018 | 5.29 | 1.59 | |
| XLSSC 511 | 0.130 | 5 | 0.545 | 357.7522 | -55.3704 | 0.133 | 3.7 | 0.016 | 2.77 | 0.38 | |
| XLSSC 512 | 0.402 | 26 | 0.848 | 352.4831 | -56.1357 | 0.402 | 2.3 | 0.014 | 9.51 | 1.00 | |
| XLSSC 513 | 0.378 | 34 | 0.936 | 349.2161 | -54.8990 | 0.377 | 21.7 | 0.121 | 11.10 | 0.45 | |
| XLSSC 514 | 0.169 | 7 | 0.582 | 351.3990 | -54.7208 | 0.169 | 12.0 | 0.060 | 4.30 | 0.55 | |
| XLSSC 515 | 0.101 | 5 | 0.540 | 351.4173 | -54.7419 | 0.100 | 6.7 | 0.023 | 5.62 | 1.03 | |
| XLSSC 517 | 0.699 | 20 | 0.698 | 350.4494 | -55.9704 | 0.697 | 1.1 | 0.012 | 6.34 | 0.12 | |
| XLSSC 518 | 0.177 | 5 | 0.535 | 349.8214 | -55.3243 | 0.177 | 3.9 | 0.022 | 7.71 | 0.87 | |
| XLSSC 519 | 0.270 | 6 | 0.555 | 353.0194 | -55.2123 | 0.270 | 2.3 | 0.017 | 4.99 | 0.92 | |
| XLSSC 520 | 0.175 | 17 | 0.805 | 352.5017 | -54.6188 | 0.176 | 0.8 | 0.003 | 11.00 | 2.10 | |
| XLSSC 521 | 0.807 | 31 | 0.775 | 352.1791 | -55.5669 | 0.807 | 0.4 | 0.004 | 13.70 | 0.84 | |
| XLSSC 522 | 0.395 | 15 | 0.711 | 351.6401 | -55.0199 | 0.395 | 10.3 | 0.078 | 5.62 | 0.28 | |
| XLSSC 523 | 0.343 | 19 | 0.779 | 350.5019 | -54.7499 | 0.345 | 3.0 | 0.019 | 4.76 | 0.21 | |
| XLSSC 524 | 0.270 | 16 | 0.754 | 353.0646 | -54.7032 | 0.269 | 11.4 | 0.063 | 6.30 | 0.28 | |
| XLSSC 525 | 0.379 | 24 | 0.832 | 349.3403 | -53.9612 | 0.371 | 6.9 | 0.044 | 9.22 | 0.45 | |
| XLSSC 527 | 0.076 | 24 | 0.926 | 349.5734 | -55.9839 | 0.076 | 13.3 | 0.021 | 6.47 | 0.41 | |
| XLSSC 528 | 0.302 | 23 | 0.839 | 349.6818 | -56.2034 | 0.303 | 3.2 | 0.017 | 9.91 | 0.69 | |
| XLSSC 529 | 0.547 | 23 | 0.769 | 349.7037 | -56.2865 | 0.548 | 15.6 | 0.131 | 6.38 | 0.62 | |
| XLSSC 530 | 0.182 | 11 | 0.686 | 348.8342 | -54.3440 | 0.190 | 5.7 | 0.026 | 6.04 | 0.29 | |
| XLSSC 531 | 0.391 | 38 | 0.966 | 349.8752 | -56.6495 | 0.390 | 3.6 | 0.020 | 10.00 | 0.24 | |
| XLSSC 532 | 0.392 | 19 | 0.772 | 352.9477 | -52.6657 | 0.391 | 11.0 | 0.077 | 5.69 | 0.32 | |
| XLSSC 533 | 0.107 | 15 | 0.789 | 351.7243 | -52.6971 | 0.108 | 46.0 | 0.115 | 4.60 | 0.04 | |
| XLSSC 534 | 0.853 | 27 | 0.725 | 350.1089 | -53.3587 | 0.853 | 12.5 | 0.131 | 6.57 | 0.43 | |
| XLSSC 535 | 0.172 | 14 | 0.756 | 351.5538 | -53.3162 | 0.171 | 1.7 | 0.006 | 9.30 | 0.51 | |
| XLSSC 537 | 0.515 | 39 | 0.934 | 354.0297 | -53.8766 | 0.517 | 3.4 | 0.023 | 13.00 | 1.86 | |
| XLSSC 538 | 0.332 | 20 | 0.804 | 354.6477 | -54.6242 | 0.332 | 6.8 | 0.041 | 9.88 | 0.41 | |
| XLSSC 539 | 0.184 | 5 | 0.520 | 355.7959 | -55.8814 | 0.182 | 5.4 | 0.030 | 7.26 | 0.78 | |
| XLSSC 540 | 0.414 | 20 | 0.776 | 355.6308 | -56.3532 | 0.411 | 4.9 | 0.035 | 9.01 | 0.86 | |
| XLSSC 541 | 0.188 | 18 | 0.805 | 355.4330 | -55.9637 | 0.188 | 8.2 | 0.032 | 5.54 | 0.51 | |
| XLSSC 542 | 0.402 | 74 | 1.202 | 353.1145 | -53.9744 | 0.405 | 8.7 | 0.039 | 14.40 | 0.97 | |
| XLSSC 543 | 0.381 | 14 | 0.689 | 354.8637 | -55.8407 | 0.383 | 10.1 | 0.077 | 5.70 | 0.33 | |
| XLSSC 544 | 0.095 | 15 | 0.788 | 349.8155 | -53.5330 | 0.096 | 2.7 | 0.006 | 8.17 | 0.17 | |
| XLSSC 546 | 0.792 | 20 | 0.668 | 352.4201 | -53.2489 | 0.860 | 13.6 | 0.154 | 4.51 | 0.30 | |
| XLSSC 547 | 0.371 | 32 | 0.920 | 351.4277 | -53.2768 | 0.370 | 2.1 | 0.010 | 11.60 | 0.98 | |
| XLSSC 550 | 0.109 | 3 | 0.480 | 352.2079 | -52.5770 | 0.107 | 8.5 | 0.035 | 5.34 | 1.42 | |