Efficient and Accurate Robustness Estimation for Large Complex Networks
Sebastian Wandelt1, Xiaoqian Sun1,*
1 National Key Laboratory of CNS/ATM, Beihang University, Beijing, China
* sunxq@buaa.edu.cn
Abstract
Robustness estimation is critical for the design and maintenance of resilient networks, one of the global challenges of the 21st century. Existing studies exploit network metrics to generate attack strategies, which simulate intentional attacks in a network, and compute a metric-induced robustness estimation. While some metrics are easy to compute, e.g. degree centrality, other, more accurate, metrics require considerable computation efforts, e.g. betweennes centrality. We propose a new algorithm for estimating the robustness of a network in sub-quadratic time, i.e., significantly faster than betweenness centrality. Experiments on real-world networks and random networks show that our algorithm estimates the robustness of networks close to or even better than betweenness centrality, while being orders of magnitudes faster. Our work contributes towards scalable, yet accurate methods for robustness estimation of large complex networks.
1 Introduction
Man-made networks exhibit highly similar statistical characteristics, while displaying substantial non-trivial topological features [2, 7]. During the last decades, empirical studies have shed light on the topology of air transportation networks [19], electrical power grids [1], the Internet backbone [21], inter-bank networks [8], etc. Most of these networks carry a well-recognized resistance towards random failures [4] but are particularly susceptible to intentional attacks, which target relatively important nodes in the network, e.g. specific nodes that are highly connected, so-called hubs [3]. If such attacks occur, networks disintegrate rapidly. Famous examples of recent extensive, wide-ranging network failures include European air traffic disruption caused by Icelandic volcano Eyjafallajökull [9], large-scale power outages in the United States [5, 6], Internet-based computer attack spreading [18], and cross-continental supply-chain shortages in the Japanese tsunami aftermath [13]. Such disruptions cause high economic costs [11] and, thus, analyzing and improving network resilience remains one of the critical challenges.
In order to measure the robustness of a network, a notion of network robustness was proposed in [17]. Given a network with nodes, the robustness is defined as , where is the size of the giant component (GC size) after removing nodes. The value of depends significantly on the underlying attacking strategy, i.e. the order in which node removals occur. Studies on network robustness usually select a single network metric, e.g. degree, betweenness, or collective influence [15], to generate a ranking for inducing the order. This approach has several limitations.
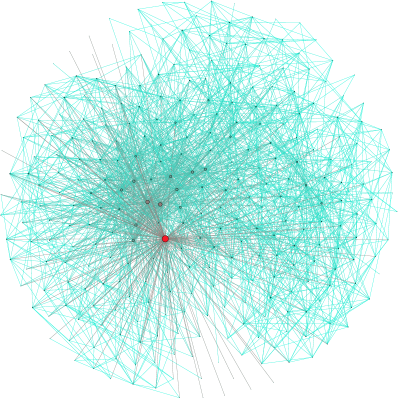
1) The obtained value reflects the robustness against a particular attacking strategy, for instance, by attacking high-degree nodes first. In Figure 1, we show a visualization of the celegansneural network together with the evolution of the network’s robustness (measured by GC size) while being attacked according to different rankings. We can observe a wide range of results; yielding significantly different robustness estimations of the network. In general, one is interested in the worst-case robustness, represented by the minimum R value. Note that it can be even more effective to eliminate a combination of hubs and central, but less-well-connected, nodes [14, 16] or other nodes identified by artificial intelligent techniques [20].
2) Different network metrics have significantly different computational requirements. For instance, computing the betweenness of all nodes in the network, a strategy which has been shown rather effective for attacking complex networks, needs at least time quadratic in the number of nodes. This makes it very difficult to obtain good attacks (leading to smaller R values) for very large networks with millions of nodes. For instance, the computation of betweenness values in a network with 100,000 nodes takes almost one day on today’s consumer computers; and doubling the size of the network further quadruples the execution time.
3) A fixed ranking assumes that an attack of length is a good prefix for an attack of length . This is often not the case, as our simple example in Figure 2 shows.
4) Last but not least, existing studies often employ a fixed-length interval sampling strategy for computing the size of the giant component less than times; in order to avoid further increases on time complexities. This static sampling yields to overestimated network robustness, particularly for large vulnerable networks.
In this paper, we propose a new technique (QRE=Quick Robustness Estimation) for estimating the robustness of a network, as expressed by , in subquadratic time. We assign the importance of nodes by exploiting approximate betweenness centrality, which estimates the centrality of nodes by sampling a sub-collection of node pairs. Furthermore, we iteratively adapt sampling intervals fitting the shape of the robustness curves, yielding an increasingly improved solution after each iteration. Experiments on real-world networks and random networks show that QRE estimates R-values close to or even better than interactive betweenness centrality, while having attractive computational properties. Our work contributes towards scalable, yet accurate methods for robustness estimation of complex networks.
2 Methods
We propose QRE, an algorithm for estimating the robustness of a network, which needs less than quadratic time in the number of nodes. Conceptually, our algorithm consists of two stages:
2.1 Initial sample shaping by degree
We obtain a first approximation of the network robustness by splitting the interval into X equi-length sub-intervals. For each such sub-interval, we attack nodes according to the decreasing degree. The metric is recomputed for each interval. From these results, we obtain the GC size for 100 sampled points in , at to , with to . We derive a step-function from these samples as , where , such that is maximal with and . We materialize this curve as a list of elements and compute the preliminary of the network as .
2.2 Improvement by approximate betweenness
We split the interval into 100 equi-depth sub-intervals, according to the curve obtained by . This often leads to significantly different sample points than equal-length intervals obtained in Step 1). For each such sub-interval, we iteratively compute an attack according to the decreasing approximate betweenness of a node. In order to approximate the betweenness, we perform betweenness sampling with Y node pairs [12]. From these results, we obtain the GC size for 100 sampled points in , at to , with to . We combine these new samples with the previously materialized curve (representing the best known attacks so far) as follows: , where , such that is maximal with and . The of the network is updated as . Step 2) is repeated for times.
2.3 Time Complexity
This first step is performed in steps, while the second step is performed in . For our experiments, we chose X=100, which guarantees a precision of two digits for the obtained R values. Furthermore, we let . In this way, we obtain an overall sub-quadratic time complexity of .
3 Results
3.1 Evaluation Setup and Data Sources
We report the results of our evaluation on 15 real-world networks and two types of random networks. All experiments were executed on a server with with 32 cores and 320 GB RAM, running Fedora 21 (Linux 4.1.13-100.fc21.x86_64). Each competitor was implemented in a single-threaded fashion, using the network library NetworKit111Available at https://networkit.iti.kit.edu/. All datasets are available to download from either the UCI Network Data Repository 222Available at https://networkdata.ics.uci.edu/index.php or the Stanford Large Network Dataset Collection 333Available at https://snap.stanford.edu/data/, and have been studied extensively. They cover a variety of network structures and network scales, ranging from a dozen of nodes (dolphins, lesmis) to more than a million of nodes (com-youtube.ungraph, roadNet-CA). Moreover, we have performed experiments with two types of random networks (Barabási-Albert and Erdös-Renyi).
| Network | —N— | —L— | Est. R | Time in s |
|---|---|---|---|---|
| dolphins | 62 | 159 | 0.18 | 0.07 |
| lesmis | 77 | 254 | 0.12 | 0.09 |
| polbooks | 105 | 441 | 0.20 | 0.17 |
| adjnoun | 112 | 425 | 0.23 | 0.27 |
| football | 115 | 613 | 0.32 | 0.23 |
| celegansneural | 297 | 2148 | 0.25 | 0.79 |
| polblogs | 1490 | 16715 | 0.15 | 10.59 |
| netscience | 1589 | 2742 | 0.04 | 0.93 |
| power | 4941 | 6594 | 0.04 | 25.50 |
| hep-th | 8361 | 15751 | 0.07 | 67.34 |
| astro-ph | 16706 | 121251 | 0.13 | 1076.38 |
| twitter_combined | 81306 | 2420765 | 0.09 | 65666.80 |
| web-BerkStan | 685230 | 7600595 | ||
| com-youtube.ungraph | 1134890 | 2987624 | ||
| roadNet-CA | 1965206 | 5533214 |
3.2 Robustness estimations for real-world networks
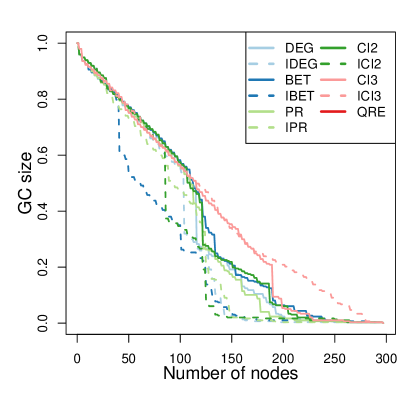
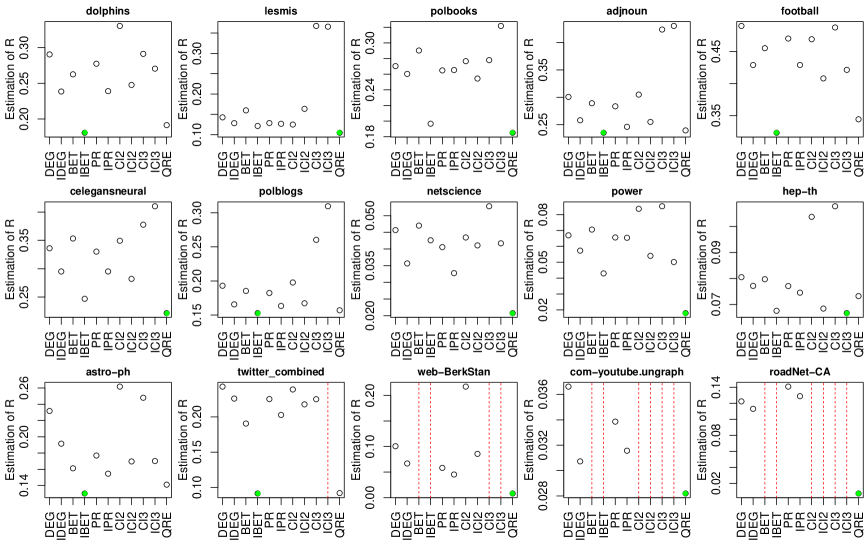
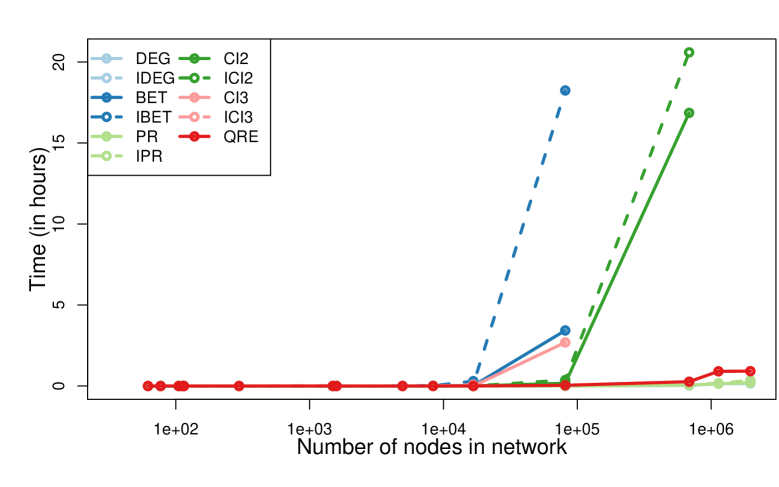
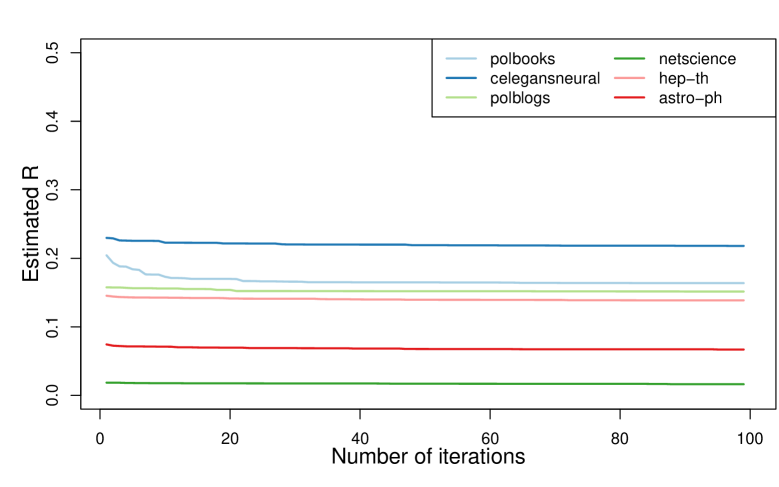
In Figure 3, we present the estimated robustness (R values) for all 15 networks computed by different techniques: DEG (=degree), BETW (betweenness), PR (pagerank), CI2 (collective influence [15] with ball size 2), CI3 (collective influence with ball size 3), and QRE (the approach proposed in this study). The symbol ’I’ in front of a technique’s name indicates an interactive attack, where the node ranking is recomputed after attacking a prefix of nodes. It can be seen that QRE computes the minimum R value for the majority of cases (8/15), followed by interactive betweenness (6/15). In Figure 4, we report the running times using the 11 techniques on real-world networks. Smaller networks with less than few hundred nodes can be analyzed by all techniques within a few seconds. However, as the size of the network grows, several of them do not scale well anymore. IBET needs already 18 hours for twitter_combined with approx. 80000 nodes. Collective influence with ball size 2 needs 16-20 hours for dataset web-BerkStan; Collective influence with ball size 3 scales even worse, since more neighbors need to be traversed. The simple techniques based on degree and pagerank scale well with the number of nodes, outperforming QRE slightly. In Figure 5, we compare the size of the giant component against a number of attacked nodes for the three most interesting techniques: Static degree (fast to compute), Interactive betwenneess (small R values, but time consuming), and QRE (trade-off). In Figure 6, we evaluate the influence of the number of iterations on the value of a network. Usually, after a few number of iterations, the value is not decreased further significantly.

3.3 Robustness estimations for random networks
We have performed additional experiment with two random graph models: Barabási-Albert and Erdös-Renyi. In Figure 7, we report the estimated robustness of 100 artificial networks, for interactive betweenness (IBET) and our novel technique (QRE). There exists a strong correlation between both scores, indicating that QRE accurately estimates the robustness even for random networks. In few cases, for networks with , IBET finds even better attacks than QRE.

4 Discussion
Our robustness estimation technique, QRE, scales up to large networks with millions of nodes and edges, since the overall time complexity is in , where is the number of nodes in the network. Based on our experiments with real-world and artificial networks, we conclude that QRE fills a nice sweet spot between fast, yet ineffective degree centrality and slow, yet highly effective betweenness centrality. The results of our study show that efficient, yet accurate robustness estimation is possible even for very large networks. We believe that this work contributes to a better understanding of real-world network robustness in face of big data. Moreover, we envision that our technique can be extended to analyze robustness of networks of networks [10].
5 Acknowledgment
The authors would like to acknowledge very fruitful discussions with Shlomo Havlin (Bar-Ilan University) and Massimiliano Zanin (Innaxis Foundation & Research Institute) which significantly improved this manuscript.
References
- 1. R. Albert, I. Albert, and G. L. Nakarado. Structural vulnerability of the north american power grid. Physical Review E, 69(2):025103, 2004.
- 2. R. Albert and A.-L. Barabási. Statistical mechanics of complex networks. Rev. Mod. Phys., 74:47–97, Jan 2002.
- 3. R. Albert, H. Jeong, and A.-L. Barabási. Error and attack tolerance of complex networks. Nature, 406:378–382, 2000.
- 4. L. A. N. Amaral, A. Scala, M. Barthélemy, and H. E. Stanley. Classes of small-world networks. Proceedings of the National Academy of Sciences, 97(21):11149–11152, 2000.
- 5. G. Andersson, P. Donalek, R. Farmer, N. Hatziargyriou, I. Kamwa, P. Kundur, N. Martins, J. Paserba, P. Pourbeik, J. Sanchez-Gasca, et al. Causes of the 2003 major grid blackouts in north america and europe, and recommended means to improve system dynamic performance. Power Systems, IEEE Transactions on, 20(4):1922–1928, 2005.
- 6. J. Ash and D. Newth. Optimizing complex networks for resilience against cascading failure. Physica A: Statistical Mechanics and its Applications, 380:673–683, 2007.
- 7. A. Barrat, M. Barthélemy, R. Pastor-Satorras, and A. Vespignani. The architecture of complex weighted networks. Proceedings of the National Academy of Sciences, 101(11):3747–3752, 2004.
- 8. M. Boss, H. Elsinger, M. Summer, and S. Thurner. Network topology of the interbank market. Quantitative Finance, 4(6):677–684, 2004.
- 9. P. Brooker. Fear in a handful of dust: aviation and the icelandic volcano. Significance, 7(3):112–115, 2010.
- 10. J. Gao, D. Li, and S. Havlin. From a single network to a network of networks. National Science Review, 1(3):346–356, 2014.
- 11. J. Gao, X. Liu, D. Li, and S. Havlin. Recent progress on the resilience of complex networks. Energies, 8(10):12187, 2015.
- 12. R. Geisberger, P. Sanders, and D. Schultes. Better approximation of betweenness centrality. In Proceedings of the Meeting on Algorithm Engineering & Expermiments, pages 90–100. Society for Industrial and Applied Mathematics, 2008.
- 13. Y. Kim, Y.-S. Chen, and K. Linderman. Supply network disruption and resilience: A network structural perspective. Journal of Operations Management, 33:43–59, 2015.
- 14. I. A. Kovács and A.-L. Barabási. Network science: Destruction perfected. Nature, 524(7563):38–39, 2015.
- 15. F. Morone and H. A. Makse. Influence maximization in complex networks through optimal percolation. Nature, 524:65–68, 2015.
- 16. T. Nie, Z. Guo, K. Zhao, and Z.-M. Lu. New attack strategies for complex networks. Physica A: Statistical Mechanics and its Applications, 424:248–253, 2015.
- 17. C. M. Schneider, A. A. Moreira, J. S. Andrade, S. Havlin, and H. J. Herrmann. Mitigation of malicious attacks on networks. Proceedings of the National Academy of Sciences, 108(10):3838–3841, 2011.
- 18. S. H. Strogatz. Exploring complex networks. Nature, 410(6825):268–276, 2001.
- 19. X. Sun and S. Wandelt. Network similarity analysis of air navigation route systems. Transportation Research Part E: Logistics and Transportation Review, 70(0):416 – 434, 2014.
- 20. S. Wandelt, X. Sun, and X. Cao. Computationally efficient attack design for robustness analysis of air transportation networks. Transportmetrica A: Transport Science, 11(10):939–966, 2015.
- 21. S.-H. Yook, H. Jeong, and A.-L. Barabási. Modeling the internet’s large-scale topology. Proceedings of the National Academy of Sciences, 99(21):13382–13386, 2002.