Globally Homogenous Mixture Components and Local Heterogeneity of Rank Data
Abstract
The traditional methods of finding mixture components of rank data are mostly based on distance and latent class models; these models may exhibit the phenomenon of masking of groups of small sizes; probably due to the spherical nature of rank data. Our approach diverges from the traditional methods; it is directional and uses a logical principle, the law of contradiction. We discuss the concept of a mixture for rank data essentially in terms of the notion of global homogeneity of its group components. Local heterogeneities may appear once the group components of the mixture have been discovered. This is done via the exploratory analysis of rank data by taxicab correspondence analysis with the nega coding: If the first factor is an affine function of the Borda count, then we say that the rank data are globally homogenous, and local heterogeneities may appear on the consequent factors; otherwise, the rank data either are globally homogenous with outliers, or a mixture of globally homogenous groups. Also we introduce a new coefficient of global homogeneity, GHC. GHC is based on the first taxicab dispersion measure: it takes values between 0 and 100%, so it is easily interpretable. GHC measures the extent of crossing of scores of voters between two or three blocks seriation of the items where the Borda count statistic provides consensus ordering of the items on the first axis. Examples are provided.
Key words: Preferences; rankings; Borda count; global homogeneity coefficient; nega coding; law of contradiction; mixture; outliers; taxicab correspondence analysis; masking.
1 Introduction
Rankings of the elements of a set is a common daily decision making activity, such as, voting for a political candidate, choosing a consumer product, etc. So there is a huge literature concerning the analysis and interpretation of preference rankings data. However, if we trace back in time, we find that de Borda (1781) was the first author, who outlined a simple well thought method based on a solid argument. Borda, as a member of the French Academy of Sciences, criticised the plurality method of choosing a new academy member and suggested, what is known as the Borda count(BC) rule, to fully rank order (seriate) the candidates based on the preferences of the judges. BC has generated a large litterature, and this paper makes full use of it as much needed.
Let denote a set of alternatives/candidates/items, and a set of voters/individuals/judges. In this paper we consider the linear orderings/rankings/preferences, in which all objects are rank-ordered according to their levels of desirability by the voters. We denote a linear order by a sequence , where means that the alternative is preferred to the alternative Let be the set of all linear orders on the cardinality of is . A voting profile is a function from to , that is,
We denote by the set of permutations of the elements of the set The Borda score is a function from to where for a linear ordering , Borda assigned to the element the score of , because is preferred to ( other alternatives, or equivalently it is the th most preferred alternative. We denote , where is a matrix having rows and columns, and designates the Borda score of the th judge’s preference of the th alternative. The average Borda score of the elements of is where is a column vector of ’s having coordinates. Borda’s count rule (BC) seriates/orders the elements of the set according to their average scores: means alternative is preferred to alternative .
We define the reverse Borda score to be a function from to where for a linear order , we assign to the element the score of We denote , where is a matrix having rows and columns, and designates the reverse Borda score of the th judge’s preference of the th alternative. The average reverse Borda score of the elements of is
We note that
and
1.1 Example 1: Croon’s political goals data
This example has two aims: First to make the notation clear; second to show that traditional well established methods for rank data, such as distance and latent class based, may mask groups of small sizes in mixture models. Table 1 introduces a well known data set first analyzed by Croon (1989); the data derive from a german survey of 2262 rankings of four political items concerning Inglehart (1977)’s theory of postmodernism. The four items are: () maintaining order in the nation; () giving people more to say in important government decisions; () fighting rising prices; () protecting freedom of speech. Inglehart advanced the thesis that there is a shift in political culture in Europe; that is, some younger Europeans have different political values than their fathers: He named the elder Europeans as materialists, because after the first and second world wars, they valued mostly material security item () and domestic order item (); while he named some of the younger generation as postmaterialists, because they valued much more human rights and political liberties item () and democracy item (). So in this example , , and the voting profile is displayed in the first two columns of Table 1; similarly, Table 1 displays the Borda scores and the reverse Borda scores . The average BC score and the average reverse BC score show that, the 2262 voters generally rank materialist items postmaterialist items .
| Table 1: Political Goals Data set of 2262 rankings of four | |||||||||
| items concerning Inglehart’s theory of postmodernism. | |||||||||
| Item | observed | Borda scores | reverse Borda scores | ||||||
| ordering | frequency | A | B | C | D | A | B | C | D |
| ABCD | 137 | 3 | 2 | 1 | 0 | 0 | 1 | 2 | 3 |
| ABDC | 29 | 3 | 2 | 0 | 1 | 0 | 1 | 3 | 2 |
| ACBD | 309 | 3 | 1 | 2 | 0 | 0 | 2 | 1 | 3 |
| ACDB | 255 | 3 | 0 | 2 | 1 | 0 | 3 | 1 | 2 |
| ADBC | 52 | 3 | 1 | 0 | 2 | 0 | 2 | 3 | 1 |
| ADCB | 93 | 3 | 0 | 1 | 2 | 0 | 3 | 2 | 1 |
| BACD | 48 | 2 | 3 | 1 | 0 | 1 | 0 | 2 | 3 |
| BADC | 23 | 2 | 3 | 0 | 1 | 1 | 0 | 3 | 2 |
| BCAD | 61 | 1 | 3 | 2 | 0 | 2 | 0 | 1 | 3 |
| BCDA | 55 | 0 | 3 | 2 | 1 | 3 | 0 | 1 | 2 |
| BDAC | 33 | 1 | 3 | 0 | 2 | 2 | 0 | 3 | 1 |
| BDCA | 59 | 0 | 3 | 1 | 2 | 3 | 0 | 2 | 1 |
| CABD | 330 | 2 | 1 | 3 | 0 | 1 | 2 | 0 | 3 |
| CADB | 294 | 2 | 0 | 3 | 1 | 1 | 3 | 0 | 2 |
| CBAD | 117 | 1 | 2 | 3 | 0 | 2 | 1 | 0 | 3 |
| CBDA | 69 | 0 | 2 | 3 | 1 | 3 | 1 | 0 | 2 |
| CDAB | 70 | 1 | 0 | 3 | 2 | 2 | 3 | 0 | 1 |
| CDBA | 34 | 0 | 1 | 3 | 2 | 3 | 2 | 0 | 1 |
| DABC | 21 | 2 | 1 | 0 | 3 | 1 | 2 | 3 | 0 |
| DACB | 30 | 2 | 0 | 1 | 3 | 1 | 3 | 2 | 0 |
| DBAC | 29 | 1 | 2 | 0 | 3 | 2 | 1 | 3 | 0 |
| DBCA | 52 | 0 | 2 | 1 | 3 | 3 | 1 | 2 | 0 |
| DCAB | 35 | 1 | 0 | 2 | 3 | 2 | 3 | 1 | 0 |
| DCBA | 27 | 0 | 1 | 2 | 3 | 3 | 2 | 1 | 0 |
| 1.97 | 1.10 | 2.05 | 0.88 | ||||||
| 1.03 | 1.90 | 0.95 | 2.12 | ||||||
Table 2 provides a statistical summary of four methods of data analysis of Table 1. The first method suggested by Inglehart is deductive and supervised; it opposes to the other three methods, which are inductive, unsupervised and aim to validate Inglehart’s theory of postmaterialism, see also Moors and Vermunt (2007). The other three methods are mixture models and they attempt to see if this data set confirms Inglehart’s theory of postmaterialism. The first one is by Croon (1989), who used a stochastic utility (SU) based latent class model; the second one by Lee and Yu (2012), who used a weighted distance-based Footrule mixture model; and the third one is based on taxicab correspondence analysis (TCA), which is the topic of this paper. Here, we provide some details on the statistics displayed in Table 2.
a) Inglehart (1977) apriori classified the respondents into three groups: materialists, postmaterialists and mixed. His method of classification is based on partial rankings based on the first two preferred choices. Here, we discuss each group separately.
Materialists are defined by their response patterns , where the pair of materialist items are always ranked above the pair of postmaterialist items ; they make of the voters. In the ideal case we expect to have the average BC scores for the four items to be: and the corresponding observed values, displayed in Table 2, are (very near to the ideal ones): and
Postmaterialists are defined by response paterns ( ), where the pair of postmaterialist items are always ranked above the pair of materialist items ; they make of the voters. The comparison of ideal and observed average BC scores, displayed in Table 2, show that: is very near to while is somewhat near to .
The last group is named ’mixed’ by Inglehart and is composed of the remaining sixteen response patterns; they make of the voters. In the ideal case we expect to have the average BC scores for the four items to be: the corresponding observed values, displayed in Table 2, are (somewhat near to the ideal ones): and
Furthermore, based on the global homogeneity coefficient GHC in %: and Inglehart’s mixed group is not globally homogenous; that is why we did not calculate its GHC index. The development of the GHC index and its interpretation will be done in section 3.
It is important to note that, the underlying hypothetical conceptual-structural model for this data is a mixture composed of three specific groups (materialist, postmaterialist and mixed), which are explicitly characterized by Inglehart.
b,c) Given that, Croon’s SU model and Lee and Yu’s weighted distance-based Footrule mixture model produced globally very similar groups, we present them together. A summary of Croon’s analysis can also be found in Skrondal and Rabe-Hesketh (2004, p.404-406), Lee and Yu (2012) and in Alvo and Yu (2014, p.228-232). Sections b and c of Table 2 are taken from Alvo and Yu (2014, p. 230), who present a summary and a comparison of results from Croon (1989) and Lee and Yu (2012). The interpretation of the estimated parameters of the SU model in Table 2 is similar to the average Borda score: for each group the score shows the intensity of the preference for that item in an increasing order. There are two kinds of estimated parameters in Lee and Yu’s weighted distance-based Footrule mixture model: the modal response pattern for each group is shown in the last column; and the weight of an item , which reflects our confidence in the ranked position of the item in the modal response pattern, the higher value representing higher confidence. Both methods find a mixture of three groups similar in contents: the first two groups represent materialists with and of the voters for the weighted footrule mixture model, and and of the voters for the SU mixture model; and the third group represents postmaterialists with of the voters for the weighted footrule mixture model, and for the SU mixture model. Lee and Yu (2012)’s conclusion is:” Based on our grouping, we may conclude that Inglehart’s theory is not appropriate in Germany”. This assertion shows that, the two well established traditional methods masked the existence of the mixed group as put forth by Inglehart.
d) Our approach, based on taxicab correspondence analysis (TCA), which is an L1 variant of correspondence analysis (CA), discovers a mixture of three globally homogenous groups as advocated by Inglehart: Materialists with of the voters, postmaterialists with , and mixed with of the voters. Furthermore, there is an outlier response pattern () representing of the voters. So contrary to Lee and Yu (2012)’s assertion, our results validates Inglehart’s theory of postmodernism for this data set. Probably, this is due mainly to the fact that TCA is a directional method specially useful for spherical data: Rank data with all its permutations is spherical by nature ( graphically, it is represented by a permutahedron; see Marden (2005, Figure 2.4, page 11) or Benzécri (1980, p.303). Furthermore, based on the global homogeneity coefficient GHC in %: , and We see that the materialist voters form much more globally homogenous group than the voters in the mixed group; and the voters in mixed group are much more homogenous than the voters in the postmaterialist group. Furthermore, our analysis clearly shows why the postmaterialists (they have three ’poles of attractions’ as defined by Marden (1995, ch. 2) or Benzécri (1966, 1980)) are much more heterogenous than the materialists (they have two poles of attractions). More details on the local heterogeneities of each group will be presented later on in section 4.
| Table 2: A summary of results derived from four methods of analysis | ||||||
|---|---|---|---|---|---|---|
| of Political Goals Data set. | ||||||
| a) Inglehart’s a priori classification | ||||||
| Group | sample% | |||||
| materialist | ||||||
| postmaterialist | ||||||
| mixed | ||||||
| b) Croon’s SU mixture model | ||||||
| Group | sample% | |||||
| materialist 1 | ||||||
| materialist 2 | ||||||
| postmaterialist | ||||||
| c) Lee and Yu’s weighted distance-based Footrule mixture model | ||||||
| Group | sample% | Modal ordering of items | ||||
| materialist 1 | ||||||
| materialist 2 | ||||||
| post-materialist | ||||||
| d) Mixtures by taxicab correspondence analysis with nega coding | ||||||
| Group | sample% | |||||
| materialist | ||||||
| postmaterialist | ||||||
| mixed | ||||||
| Outlier | ||||||
1.2 Organisation of this paper
The traditional methods of finding mixture components of rank data are mostly based on distance and latent class models; these models may mask groups of small sizes; probably due to the spherical nature of rank data. In this paper, our apparoach diverges from the traditional methods, because we discuss the concept of a mixture for rank data essentially in terms of its globally homogenous group components. We use the law of contradiction to identify globally homogenous components. For instance, by TCA we were able to discover that the data set in Table 1 is a mixture of three globally homogenous group components (materialist, postmaterialist and mixed); furthermore, each group component can be summarized by its average Borda Count (BC) score as its consensus ranking; this is the first step in our procedure. In the second step, we look at local heterogeneities if there are any, given the globally homogenous component. This two step procedure produces finer visualization of rank data; it is done via the exploratory analysis of rank data by taxicab correspondence analysis with the nega coding. Also we introduce a new coefficient of global homogeneity, GHC. GHC is based on the first taxicab dispersion measure: it takes values between 0 and 100%, so it is easily interpretable. GHC measures the extent of crossing of scores of voters between 2 or 3 blocks seriation of the items where the Borda count statistic provides consensus ordering of the items on the first axis. Furthermore, to our knowledge, this is the first time that a tangible method has been proposed that identifies explicitly outliers in a rank data: neither the recently written monograph by Alvo and Yu (2014), nor the much cited monograph of Marden (1995) discuss the important problem of identification of outliers in rank data. We mention two publicly available written packages in R, that we used, RankClustr by Jacques, Grimonprez and Biernacki (2014), and Pmr (probability models for ranking data) by Lee and Yu (2013).
The contents of this paper are organized as follows: Section 2 reviews the TCA approach for rank data; section 3 develops the new global homogeneity coefficient GHC; section 4 presents the analysis of some well known rank data sets by TCA; and finally in section 5 we conclude with some remarks.
We just want to mention that there is a large litterature in social choice theory or social welfare theory studying the properties of the BC. Here, we mention some important contributions according to our personal readings. Young (1974) presents a set of four axioms that characterize uniquely BC; see also among others, Saary (1990a) and Marchant (1998). Saari (1990b) distinguishes two levels of susceptiblity of manipulation of voting theories: ’macro’- where a large percentage of voters-, and ’micro’- where a small percentage of voters - attempt to change the results of the elections. In data analysis, a macro manipulation is equivalent to the existence of a mixture of groups of voters. While, a micro manipulation is equivalent to the existence of few outliers in the globally homogenous set of voters . Further, Saari concludes that among all positional voting systems, BC is the least susceptible to micro manipulation; this assertion seems fully true in this paper. Saari (1999) proves that BC is the only positional voting method that satisfies the property of Reversal Symmetry, which states that if everyone reverses all their preferences, then the final outcome should also be reversed. This property plays an important role in the nega coding of a rank data set before the application of TCA. Choulakian (2014) incorporates the BC to interpret the first principal factor of taxicab correspondence analysis (TCA) of a nega coded rank data, see Theorem 1 in the next section. Additionally, this essay further extends and complements the ideas of global homogeneity and local heterogeneities for rank data.
2 Taxicab correspondence analysis of nega coded rank data
Results of this section are taken from Choulakian (2006, 2014). We start with an overview of TCA of a contingency table; then review the corresponding results concerning rank data.
2.1 Taxicab Correspondence analysis: An overview
Let be a contingency table cross-classifying two nominal variables with rows and columns, and be the associated correspondence matrix with elements where is the sample size. We define as usual , the vector the vector , and a diagonal matrix having diagonal elements and similarly Let
In TCA we compute the following quadruplets for the two spaces, for : in the row space of and in the column space of . Given that in CA and TCA, the row and column spaces are dual to each other, we name the pair of vectors ( and th principal axes, the pair ( and th basic vectors of coordinates, the pair ( and th vectors containg TCA factor scores, and the nonnegative scalar the th TCA dispersion measure. The relations among the seven terms will be described in the next two subsections.
TCA is computed in 2 steps: In the first step we compute the taxicab singular value decomposition (TSVD) of as a function of for which is a stepwise matrix decomposition method based on a particular matrix norm, see below equation (3). In the 2nd step, we reweight the pair of basic vectors by respective weights of the columns, and the rows, to obtain the vectors of factor scores for .
2.2 Taxicab singular value decomposition
Let be the residual data matrix at the th iteration, where, for TSVD consists of maximizing the norm of the linear combination of the columns of the matrix subject to norm constraint, where the norm of a vector is defined to be and is the norm; more precisely, it is based on the following optimization problem
| (1) |
or equivalently, it can also be described as maximization of the norm of the linear combination of the rows of the matrix
| (2) |
Equation (1) is the dual of (2), and they can be reexpressed as matrix operator norms
which is a well known and much discussed matrix norm related to the Grothendieck problem; the inequality in Theorem 2 section 3 of this paper sheds further insight into Grothendieck’s theorem; see Pisier (2012) for a comprehensive and interesting history of Grothendieck’s theorem with its many variants.
Equation (3) characterizes the robustness of the method, in the sense that, the weights affected to the columns (similarly to the rows by duality) are uniform The th principal axes, and are computed by
| (4) |
and
| (5) |
It is evident that for
| (6) |
where represents a column vector of ones of length The two principal axes and are named trivial, and they are used only to center the rows and the columns of .
Let represent the th TSVD coordinates of the rows of by projecting the rows of on the principal axis , and represent the th TSVD coordinates of the columns of by projecting the columns of on the principal axis . These are given by
| (7) |
and
| (8) |
In particular, by (6,7,8), we have for
Equations (7) are named transition formulas, because and and , and are related by
| (9) |
where and if otherwise.
To obtain the th TSVD row and column coordinates and and corresponding principal axes and , we repeat the above procedure on the residual dataset
| (10) |
We note that the because by (6) through (9)
| (11) |
which, by induction, implies that for
and in particular we see that for
| (12) |
that is, the basic vectors and are centered.
The data reconstitution formula for the correspondence matrix as a function of the basic vectors for associated with the dispersion measures is
| (13) |
In TCA of both basic vectors and for satisfy the equivariability property, as a consequence of equations (8,12) , see Choulakian (2008a). This means that and are balanced in the sense that
In TSVD, the optimization problems (3), (4) or (5) can be accomplished by two algorithms. The first one is based on complete enumeration (3); this can be applied, with the present state of desktop computing power, say, when The second one is based on iterating the transitional formulas (7), (8) and (9), similar to Wold’s (1966) NIPALS (nonlinear iterative partial alternating least squares) algorithm, also named criss-cross regression by Gabriel and Zamir (1979). The criss-cross nonlinear algorithm can be summarized in the following way, where is a starting value:
Step 1: , and
Step 2: and
Step 3: If go to Step 1; otherwise, stop.
This is an ascent algorithm, see Choulakian (2016); that is, it increases the value of the objective function at each iteration. The convergence of the algorithm is superlinear (very fast, at most two or three iterations); however it could converge to a local maximum; so we restart the algorithm times using each row of as a starting value. The iterative algorithm is statistically consistent in the sense that as the sample size increases there will be some observations in the direction of the principal axes, so the algorithm will find the optimal solution.
2.3 Taxicab correspondence analysis
A simple reweighting of the basic coordinates for produces the vectors that contain TCA factor scores of the rows and the columns
| (15) |
and (8) becomes
| (16) |
Similar to CA, TCA satisfies an important invariance property: columns (or rows) with identical profiles (conditional probabilities) receive identical factor scores. Moreover, merging of identical profiles does not change the result of the data analysis: This is named the principle of equivalent partitioning by Nishisato (1984); it includes the famous distributional equivalence property of Benzécri, which is satisfied by CA.
By (13 and 15), one gets the data reconstitution formula in TCA (the same formula as in CA) for the correspondence matrix as a function of the factor coordinates for associated with the eigenvalues
| (17) |
The visual maps are obtained by plotting the points for or for for
Correspondence analysis (CA) admits a chi-square distance interpretation between profiles; there is no chi-square like distance in TCA. Fichet (2009) described it as a general scoring method.
In the sequel we suppose that the theory of correspondence analysis (CA) is known. The theory of CA can be found, among others, in Benzécri (1973, 1992), Greenacre (1984), Gifi (1990), Le Roux and Rouanet (2004), Murtagh (2005), and Nishisato (2007); the recent book, by Beh and Lombardi (2014), presents a panoramic review of CA and related methods.
Further results on TCA can be found in Choulakian et al. (2006), Choulakian (2008a, 2008b, 2013), Choulakian and de Tibeiro (2013), Choulakian, Allard and Simonetti (2013), Choulakian, Simonetti and Gia (2014), and Mallet-Gauthier and Choulakian (2015).
2.4 Nega coding for rank data
In the sequel, we use the same notation as in Choulakian (2014). Let for and represent the Borda scores for rank data, where takes values Similarly, represent the reverse borda scores. We note that and contain the same information. To incorporate both in one data set, there are two approaches in correspondence analysis literature. In the first approach we vertically concatenate both tables, that is, we double the size of the coded data set by defining … In the second approach, we summarize by its column total, that is, we create a row named then we vertically concatenate to , thus obtaining
where The size of is Choulakian (2014) discussed the relationship between TCA of and TCA of We will consider only the application of TCA to , because this will show if the rank data set is globally homogenous or heterogenous. So let
be the correspondence table associated with Note that is a matrix of size and is a row vector of size . We denote the sequence of principal axes, and the associated basic vectors, TCA vectors of principal factor scores and dispersion measures by
for
and . The following theorem is fundamental, and it
relates the average BC score of items, to the first
principal TCA factor score .
Theorem 1 (): (This is Theorem 2 in Choulakian (2014) ): Properties a, b, c are true iff , where is the first principal axis of the columns of
a) The first principal column factor score of the items is an affine function of the average BC score that is,
b) The first nontrivial TCA dispersion measure equals twice taxicab norm of the row vector
c) Consider the residual matrix then
that is, the nega row is the null row vector.
Note that in Theorem 1 we have eliminated sign-indeterminacy of the first principal axis, by fixing
Property a implies that the first principal factor score of the items, can be interpreted as the Borda ranking of the items. Property b shows that the nega row of accounts for 50% of the first nontrivial taxicab dispersion Property c shows that the residual matrix does not contain any information on the heavyweight nega row. Properties b and c imply that the first nontrivial factor is completely determined by the nega row, which plays a dominant heavyweight role, see Choulakian (2008a). Such a context in CA is discussed by Benzécri (1979) using asymptotic theory, and in dual scaling by Nishisato (1984), who names it forced classification.
The importance of applying TCA to nega coded dataset, Rnega, and not to the original data set R stems from the following two considerations: First, if there are two columns in R such that for and then the columns and have identical profiles, and by the invariance property of TCA they can be merged together, which will be misleading. Second, as discussed by Choulakian (2014), the interpretation of TCA maps of Rnega is based on the law of contradiction, which will be used recursively to find the mixture components.
2.5 The law of contradiction
Let be a statement and and its negation; then the law of contradiction states that and oppose each other: they can not both hold together, see for instance Eves (1990). We shall use the law of contradiction as a basis for the interpretation of the maps produced by TCA of Rnega in the following way. First, we recall that there are items, and we represented the Borda score of an item by the voter for and , by and its reverse Borda score by By the law of contradiction, and oppose each other; which in its turn also implies that and oppose each other because the contains or they are not associated at all if . We let
to represent the first TCA vector of factor scores of the rows. For the interpretation of the results by TCA of Rnega we can have the following two complementary scenarios:
Scenario 1 happens when
| (Scen1) |
then by the law of contradiction, the first principal dimension is interpretable and it shows the opposition between the Borda scores of the items to their reverse Borda scores summarized by . If Scenario 1 happens, then we will say that the data set is globally homogenous, because all voters have positive first TCA factor scores; that is, they are directionally associated because for all Now by Property c of Theorem 1, the nega row disappears and do not contribute to the higher dimensions; thus the higher dimensions will exhibit either random noise or local heterogeneities of the voters represented by their response patterns.
Scenario 2 is the negation of Scenario 1, it corresponds to
| (Scen2) |
then the results of TCA of Ynega are not interpretable by the law of contradiction: because some voters, say belonging to the subset V are directionally associated with the nega; so to obtain interpretable results as described in Scenario 1, we eliminate the subset of voters V1, and repeat the analysis till we obtain Scenario 1. If the number of deleted voters in V1 is small, we consider them outliers; otherwise, they constitute another group(s) of voters.
We have the following
Definition 1: If Scen1 holds, then we name the rank data R or Rnega globally homogenous.
It is of basic importance to note that using Rnega, only globally homogenous data are interpretable by the law of contradiction.
3 Global homogeneity coefficient GHC
Rank data is much more structured than ratings data; and this aspect will be used to propose a global homegeneity coefficient (GHC) of rank data. We recall that
is the nega coded rank data and
its associated correspondence matrix. We note the following facts:
Fact 1: The row sum of the elements of are: for rows and for the nega row (or th row). From which we get the total sum of elements of to be . So, the marginal relative frequency of the th row is for , and, the marginal relative frequency of the nega row is .
Fact 2: The column sum of the elements of are: for columns So, the marginal relative frequency of the th column is for
Fact 3: Using Facts 1 and 2, we see that the first residual matrix
has elements of :
| (18) | |||||
and
Equation (18) states that is row centered with respect to average ranking , because for and ; it is also column centered.
We have the following
Proposition 1: For a globally homogenous rank data, .
The proofs of new results are in the appendix.
Young (1974) presented a set of four axioms that characterize uniquely BC rule. His Axiom 4, named Faithfulness, states that when there is only one voter, if the relation that he uses to express his preferences is so simple that one result seems the only reasonable one, the result of the method must be that one. The Faithfulness axiom was the inspiration of this section. By the invariance property of TCA, that is, merging of identical profiles does not change the results of the data analysis, a faithfully homogenous group is equivalent to the existence of one response pattern , and its Borda score values for a complete linear order of items can be represented by , without loss of generality by reordering of the items. Then the nega coded correspondence table, will have only two rows and columns
and will be of rank 1; that is, there will be only one principle factor, for which we note its taxicab dispersion measure by for a fixed finite integer value of The following result gives the value of explicitly.
Theorem 2 (Faithfully homogenous group):
a) For or for , then
where we define
b) The first and only factor score of the two rows are and
c) The first and only factor score of the th item is for In particular, we see that and for are equispaced. So for an odd number of items for , we have
Let denote the cardinality of a set , that is, the number of elements in . The next definition formalizes the partition of a set of items obtained in Theorem 1.
Definition 2: For a globally homogenous rank data set, we define a partition of a set of items to be faithful if a) For an even number of items and the first TCA axis divides the set of items into 2 blocks such that where and
b) For an odd number of items for the first TCA axis divides the set of items into 3 blocks where and, and
Remarks 1
a) The BC for a faithfully homogenous group is , and the Pearson correlation corr( as in Theorem 1a.
b) Theorem 2 concerns only one group. Theorem 4 generalizes Theorem 2 to multiple faithfully homogenous subgroups; however in the multiple case only parts a and b of Theorem 2 are satisfied and not part c. The maximum number of multiple faithfully homogenous subgroups is for or and which represents the number of within (intra) block permutations of the rankings.
The next result shows that is an upper bound for the first TCA dispersion measure
Theorem 3: For a globally homogenous rank data set we have
Definition 3: Based on Theorem 3 we define for a globally homogenous rank data the following global homogeneity coefficient
takes values between 0 and 100. In real applications we seldom find the value of . However, it may approach 100% as in the Potato’s rank data set considered later on.
Theorem 4: if and only if there is a faithful partition of the items and the Borda scores of all voters are intra (within) block permutations.
Corollary 1: if and only if for .
The following result complements Proposition 1.
Corollary 2: For a globally homogenous rank data, for .
Definition 4: A voter is named faithful if its first factor score
In the next subsection we explain these results.
3.1 Interpretation of GHC
-
•
We consider the following artificial example with two voters and eight items.
| items | ||||||||
| A | B | C | D | E | F | G | H | |
| voter 1 | 7 | 6 | 5 | 4 | 3 | 2 | 1 | 0 |
| voter 2 | 4 | 5 | 6 | 7 | 3 | 1 | 0 | 2 |
| nega | 3 | 3 | 3 | 3 | 8 | 11 | 13 | 12 |
| 5.5 | 5.5 | 5.5 | 5.5 | 3 | 1.5 | 0.5 | 1 | |
We have: and So Figure 1 displays the TCA biplot. The first axis subdivides the items into two faithful blocks and additionaly, the ordering of the items on the first axis is given by the Borda count where we see that We also note that the two voters are faithful and their rankings are intra block permutations (in italics and in bold). The second axis will represent local heterogeneity by opposing in particular item A to item D.

-
•
We consider a similar artificial example with inter block crossings highlighted with bold characters and italics.
| items | ||||||||
| A | B | C | D | E | F | G | H | |
| voter 1 | 7 | 6 | 5 | 4 | 3 | 2 | 1 | 0 |
| voter 2 | 7 | 6 | 5 | 4 | 3 | 2 | 1 | 0 |
| voter 3 | 7 | 5 | 6 | 3 | 4 | 1 | 0 | 2 |
| nega | 0 | 4 | 5 | 10 | 11 | 16 | 19 | 19 |
| 21/3 | 17/3 | 16/3 | 11/3 | 10/3 | 5/3 | 2/3 | 2/3 | |
For this example we have: , and So Figure 2 displays the TCA biplot. We note: First, the first axis subdivides the items into 2 faithful blocks and additionaly, the ordering of the items on the first axis is given by the Borda count where we see that Second, voters 1 and 2 are confounded, because they have the same profile; further so voters 1 and 2 are faithful. Third, which is smaller in value than because voter 3 scores cross the two faithful blocks: score 4 has crossed the block to the block and score 3 has crossed the block to the block . The second axis will represent local heterogeneity or random error.

-
•
As an application of Theorem 4, we consider Inglehart’s a priori classification summarized in part a in Table 2. We mentioned that, Inglehart’s materialist group, composed of 4 response patterns, has and the postmaterialist group, also composed of other 4 response patterns, has also ; there is no value of GHC for the mixed group, because the mixed group is not globally homogenous. Let us consider Inglehart’s materialist group where the pair of materialist items are always ranked above the pair of postmaterialist items ; from Table 1 we have (where we permuted the positions of items C and B):
items A C B D ACBD, 309 3 2 1 0 ACDB, 255 3 2 0 1 CABD, 330 2 3 1 0 CADB, 294 2 3 1 0 we see that the subsets and form a faithful 2 blocks partition of the four items with no crossing between the blocks, so Theorem 4 applies and
-
•
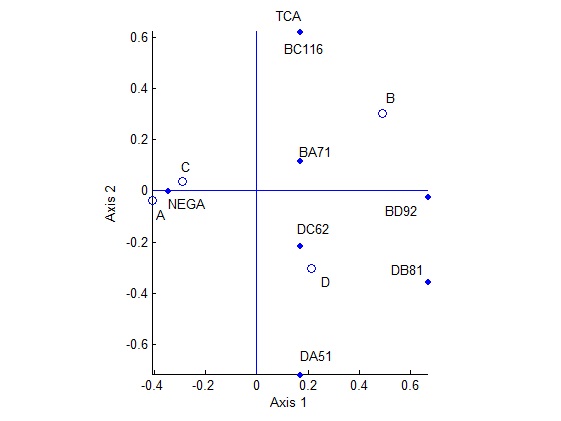
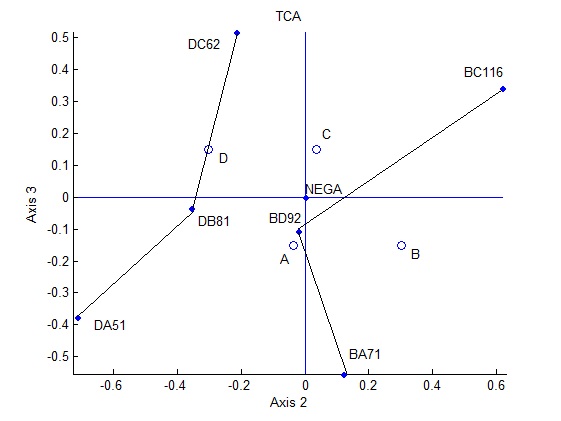
We consider the following four orderings found in Table 1 with their frequencies: , , and where ABCD137 represents the ordering with its frequency of 137. Figure 3 displays the TCA biplot. We can summarize the data analysis by the following observations concerning the first axis: First, by Definition 1 the rank data is globally homogenous, because the factor scores of the 4 response patterns are positive on the first axis. Second, item opposes to the items so the partition of the items is not faithful. Evidently, this means that all voters ranked item A as their first choice; however there is considerable heterogeneity concerning the rankings of the other 3 items these local heterogeneities will appear on the second and third axes (not shown). Third, for and while by Theorem 2, so . This example shows that the condition for is not sufficient for

-
•
The above discussion shows that: GHC takes into account the following two aspects of rank data: a) How the items are partitioned into blocks by the first axis. b) The extent of crossing of scores of voters among the partitioned blocks, where the Borda count statistic provides consensus ordering of the items on the first axis. means that the 2 or 3 blocks are faithful and for all voters their orderings of the items are intra block permutations with no crossing between the blocks.
Example 1: We consider TCA of the Potatos rank data set, found in Vitelli et al. (2015, Table A2); it has assessors and potatos. The first four TCA dispersion measures are: , and ; by Theorem 2, so , which is very high. Figure 4 displays the TCA biplot of the assessors (as points) and the true ranks of the potatos as provided in their paper. First, on the first axis we observe a faithful partition of the 20 potatos into 2 blocks: ten potatos T11 to T20 are found on the left side of the first axis, and ten potatos T1 to T10 are found on the right side of the first axis. However, potatos numbered 5 to 10 are not correctly ranked (the true ranks of the 3 pairs , and are permuted). The distribution of the majority of the true ranks of the potatos on the first axis seem uniform. Second: the first factor score of the assessors for has values (4 times), (2 times), (3 times) and (3 times), which are highly clustered around . These values show that only three assessors are faithful; the other 9 assessors’ scores have some inter block crossings; by examining the signs of , the crossings happened between the subsets of items and , which are near the origin; and this is the reason that did not attain its upper value of 100% but it approached it. Third, given that the rank data is globally homogenous, the BC vector reflects the consensus linear ordering of the potatos on the first axis, because by Theorem 1a, Fourth, the data is almost unidimensional, because approaches 0 and this is apparent in Figure 1. In conclusion, we can say that this is a nice ideal real data set almost faithfully homogenous with some random sampling error.

4 Examples
The notion of global homogeneity and local heterogeneity will further be explained by analyzing few real data sets. First we provide some details concerning part d of Table 2. For the other data sets we provide just essential aspects.
4.1 Example 1: Croon’s political goals data continued
Here we describe the six consecutive steps for the analysis of the rank data set in Table 1. We recall the the description of the four items: () maintaining order in the nation; () giving people more to say in important government decisions; () fighting rising prices; () protecting freedom of speech.
Step 1: TCA of the full data set
Figure 5 displays the biplot of the complete data set, where to each response pattern its observed frequency is attached; for instance the first response pattern in Table 1, with observed frequency of 137, is labeled as ABCD137 in the biplot. By the law of contradiction Figure 4 is not interpretable, because there are 16 response patterns associated with NEGA; we recall that the point NEGA contains the negations of all response patterns. Note that the 8 response patterns that appear on the second axis have very small negative values on the first axis. So we eliminate these 16 response patterns, which have negative first factor scores, and apply TCA to the remaining 8 response patterns in Step 2.

Step 2: TCA of the subset composed of 8 response patterns
The application of TCA to the nega coded subset of weighted 8 response patterns produces the following TCA dispersion values: and . Figures 6 and 7 summarize the data. Figure 6 represents the biplot of the principal plane of the 8 response patterns; it has very clear interpretation.
a) The first factor opposes the NEGA row to the 8 response patterns which represent the materialists : The 8 response patterns form a globally homogenous group of voters, and they represent of the voters in the sample; further they can be summarized by their average BC score, because by Theorem 1a, Note that contains the first factor coordinates of the four items plotted in Figure 6. by Theorem 2, so the global homogeneity coefficient of this group is , which is relatively high. On the first axis we observe the faithful partition of the items into 2 blocks, and ; but the first factor scores of the voters have two values, and . This implies that the response patterns CADB294, CABD330, ACDB255 and ACBD309 are faithful; while there are inter block crossings of scores of the response patterns CDAB70, CBAD117, ADCB93 and ABCD137. This last assertion is evident.

b) The NEGA point contributes only to the first axis; and by Theorem 1c, it is eliminated from the higher axes: In Figure 7 it is found at the origin.
c) Given that the 2nd and 3rd TCA dispersion values are almost equal and relatively high, and , it is worthwhile to examine the principle plane made up of axes 2 and 3, represented in Figure 7: It is evident that there are two principle branches dominated by items A and C respectively; these two branches represent local heterogeneities, in the sense that item C opposes to item A on both axes, which are both qualified as materialist items. The two groups Postmaterialist1 and Postmaterialist2 in Table 2, which appeared as individual groups in Croon’s SU mixture model and Lee and Yu’s weighted distance based model, are the two local branches (subdivisions) of the materialists in the TCA approach. These two branches are similar to Marden (1995, chapter 2)’s ”the poles of attraction” for items A and C.

Step 3: TCA of the 16 response patterns
We apply TCA to the 16 remaining response patterns that were associated with the NEGA point in Figure 5, and we get Figure 8, which by the law of contradiction is not interpretable: So we eliminate the 6 response patterns, which are associated with the NEGA point in Figure 8; and apply TCA to the remaining 10 response patterns in Step 4 (Step 4 is similar to Step 2).

Step 4: TCA of the 10 response patterns
TCA dispersion measures for this case are: and . Figures 9 and 10 totally reflect the data. Figure 9 has the following interpretation: a) The first factor represents the postmaterialists with which is low for the following two reasons: the partition of the four items into two blocks, and is unfaithful by the first axis and there are a lot of inter-block crossings by the response patterns
.

b) In Figure 10, the points NEGA and item A are found on the origin: They do not contribute to principal axes 2 and 3.
c) In Figure 10 there are three principle branches dominated by items B, D and C, respectively; these three branches represent local heterogeneities, but the two branches starting with B (giving people more to say in important government decisions) and D (protecting freedom of speech) are more important than the smaller branch starting with item C (fighting rising prices).

Step 5: TCA of the 6 response patterns
Figure 11 represents the TCA map of the last six patterns deleted in Step 4. In this plot, we identify the response pattern DACB30 as an outlier because its proportion is very small ; so we eliminate it.

Step 6: TCA of the remaining 5 response patterns
TCA dispersion measures are: and . In Figure 12 the first factor represents the mixed group. Note that on the first axis, the mixed items oppose to the mixed items ; similarly, on the second axis, the mixed items oppose to the mixed items .

4.2 Example 1: Croon’s political goals data continued with partial ranking
Here, we continue the analysis of Croon’s political goals data by reducing it to the first two choices, that is considering only partial rankings, as done by Inglehart. Inglehart’s approach is based on the first two choices of the four items; thus the 24 response patterns of Table 1 is reduced to 12 response patterns. For example, the first two response patterns and with respective frequencies 137 and 29, are collapsed into one response pattern with frequency of 166, where * represents either C or D. Now the Borda score of that is the items C and D take equal scores. The TCA of the partial ranking table produces only two groups: materialists with two branches (poles of attraction) and postmaterialists with two branches. Figures 13 through 16 display these results. On these figures the label, for instance CB186, represents the partial order with its frequency of 186. It is obvious that there is loss of information by reducing the complete rankings into partial rankings.


4.3 Roskam’s psychologists rank data
Roskam preference data of size 39 by 9 was analyzed by de Leeuw (2006) and de Leeuw and Mair (2009) and can be downloaded from their Package homals in R. In 1968, Roskam collected preference data where 39 psychologists ranked all 9 areas of the Psychology Department at the University of Nijmengen in the Netherlands. The areas are: SOC = Social Psychology, EDU = Educational and Developmental Psychology, CLI = Clinical Psychology, MAT = Mathematical Psychology and Psychological Statistics, EXP = Experimental Psychology, CUL = Cultural Psychology and Psychology of Religion, IND = Industrial Psychology, TST = Test Construction and Validation, and lastly PHY = Physiological and Animal Psychology.
de Leeuw (2006) compared linear and nonlinear principal components analysis (PCA) approaches (Figures 4.6 and 4.7 in his paper), and concluded that ”the grouping in the nonlinear PCA is clearer: psychologists in the same area are generally close together, and there is relatively clear distinction between qualitative and quantitative areas”. This assertion is true, because it describes the two component groups of the mixture identified by TCA as will be seen.
Later on, de Leeuw and Mair (2009) applied multiple correspondence analysis, named also homogeneity analysis, to this data set with the scale level ordinal, and interpreted the obtained figure (Figure 8 in their paper) with the following conclusion: ”The plot shows interesting rating ”twins” of departmental areas: ,, ,. is somewhat separated from the other areas”. This assertion does not seem to be completely true, because of masking phenomenon.
Our TCA analysis reveals that the 39 psychologists represent a mixture of two globally homogenous groups of sizes 23 and 16 as shown in Figures 17 and 18. In Figure 17, the following Borda ordering of the areas can be discerned visually: The quantitative areas of psychology are preferred for this group. Note that is not separated from the rest, it has a middle ranking.

In Figure 18, the following Borda ordering of the areas can be discerned visually: For this group of psychologists PHY is the worse rated area; further, qualitative areas are preferred for this group.
For the complete data set, , but the resulting TCA map is not interpretable. For group 1, , , so ; for group 2, so So, group1 is somehat more globally homogenous than group 2; however both groups have a lot of inter block crossings. We also note that: and ; that is, the first TCA dispersion measure of noninterpretable data is much smaller than the corresponding value of an interpretable maximal subset.

4.4 Delbeke’s family compositions rank data
This data set of preferences can be found in Takane (2014, p.184-5): in 1978 Delbeke asked 82 Belgian university students to rank-order 16 different family compositions, where the 16 orders are described by the coordinate pairs for and, the index represents the number of daughters and the index the number of sons. This data set has been analyzed by, among others, Heiser and de Leeuw (1981), Van Deun, Heiser and Delbeke (2007), Takane, kiers and de leeuw (1995). In these studies, the family composition (0,0) is considered an outlier because of its high influence and sometimes omitted from analysis. In our approach there are no outlier items, but voters can be tagged as outliers only by the law of contradiction. Our results differ from theirs: We get a mixture of two globally homogenous groups of sizes 68 and 14 as shown in Figures 19 and 20, where points represent students and the symbol represents the family composition for .
In Figure 19, we see that for this majority group of 68 students the least preferred combination of kids is (0,0) and the most preferred combination is (2,2). The first Borda axis opposes the combinations composed of (0 daughters or 0 sons) to the combinations composed of (at least one daughter or at least one son). Further, we see that there is a bias towards boys: On the first axis the position of the point is always to the left of the point . For group 1, , , so ; looking at the values of the students first factor scores, we notice 2 clusters: Cluster 1, characterized by small number of inter blocks crossings, is composed of 26 students with first factor score of 8 students with and 5 students with this cluster, of proportion is represented by the dots making a vertical line in Figure 15. Cluster 2, characterized by large number of inter block crossings, are quite dispersed, having first factor scores between 0.4583 and 0.0750.

In Figure 20, for the minority group of 14 students (labeled on the biplot by their row numbers) the least preferred combination of kids is and the most preferred combination is . The first Borda axis opposes the combinations composed of and such that to the rest. Further, in this group also there is a bias towards boys: On the first axis the position of the point is always to the left of the position of the point . For group 2, and

5 Conclusion
Here we conclude with a summary of some aspects of TCA of nega coded rank data.
We note that the rank data is spherical by nature, they are represented on a permutahedron; so a directional method, like TCA of the nega coded rank data, is able to discover some other aspects of the data, which are eclipsed or masked by well established methods, such as distance or latent class based methods. Like Occam’s razor, step by step, TCA peels the essential structural layers (globally homogenous groups) of rank data; it can also identify outliers in a group.
We presented a new coefficient, , that measures the global homogeneity of a group. GHC is based on the first taxicab dispersion measure: it takes values between 0 and 100%, so it is easily interpretable. GHC takes into account the following two aspects of rank data: a) How the items are partitioned into blocks by the first axis. b) The extent of crossing of scores of voters among the partitioned blocks, where the Borda count statistic provides consensus ordering of the items on the first axis. means that the partition of the set of items into 2 or 3 blocks is faithful and for all voters their orderings of the items are intra block permutations with no crossings between the blocks. For fully ranked data, the lower bound of is positive but unknown being an open problem.
As is well known, a coefficient in itself does not show important local details in a data set. We named these important local details, local heterogeneity; and they appear in the higher dimensions of TCA outputs: So it is important to examine the sequence of TCA dispersion measures and the graphical displays as expounded and professed by Benzécri.
Acknowleldgements: Choulakian’s research is financed by NSERC of Canada.
References
Alvo, M. and Yu, P. (2014). Statistical Methods for Ranking Data. Springer, N.Y.
Beh, E. and Lombardo, R. (2014). Correspondence Analysis: Theory, Practice and New Strategies. N.Y: Wiley.
Benzécri, J.P. (1966?). Sur l’analyse des préférences. ISUP paper (available from Choulakian).
Benzécri, J.P. (1973). L’Analyse des Données: Vol. 2: L’Analyse des Correspondances. Paris: Dunod.
Benzécri, J.P. (1979). On the analysis of a table with one heavyweight column (in french). Les Cahiers de L’Analyse des Données, IV, 413-416.
Benzécri, J.P. (1980). Geometric representation of preferences and correspondence tables. In Pratique de L’Analyse Des Données, Vol. 2, by Bastin, Ch., Benzécri, J.P., Bourgarit, Ch. and Cazes, P. p: 299-305, Dunod, Paris.
Benzécri, J.P (1992). Correspondence Analysis Handbook. N.Y: Marcel Dekker.
Choulakian, V. (2006). Taxicab correspondence analysis. Psychometrika, 71, 333-345.
Choulakian, V. (2008a). Taxicab correspondence analysis of contingency tables with one heavyweight column. Psychometrika, 73, 309-319.
Choulakian, V. (2008b). Multiple taxicab correspondence analysis. Advances in data Analysis and Classification, 2, 177-206.
Choulakian V. (2013). The simple sum score statistic in taxicab correspondence analysis. In Advances in Latent Variables (ebook), eds. Brentari E.and Carpita M., Vita e Pensiero, Milan, Italy, ISBN 978 88 343 2556 8, 6 pages.
Choulakian, V. (2014). Taxicab correspondence analysis of ratings and rankings. Journal de la Société Française de Statistique, 155(4), 1-23.
Choulakian, V. (2016). Matrix factorizations based on induced norms. Statistics, Optimization and Information Computing, 4, 1-14.
Choulakian, V., Allard, J. and Simonetti, B. (2013). Multiple taxicab correspondence analysis of a survey related to health services. Journal of Data Science, 11(2), 205-229.
Choulakian, V. and de Tibeiro, J. (2013). Graph partitioning by correspondence analysis and taxicab correspondence analysis. Journal of Classification, accepted to appear.
Choulakian, V., Simonetti, B. and Gia, T.P. (2014). Some new aspects of taxicab correspondence analysis. Statistical Methods and Applications, available online.
Choulakian, V., Kasparian, S., Miyake, M., Akama, H., Makoshi, N., Nakagawa, M. (2006). A statistical analysis of synoptic gospels. JADT’2006, pp. 281-288.
Croon, M.A. (1989). Latent class models for the analysis of rankings. In Soete, G.D., Feger, H., Klauer, K.C. (Eds.), New Developments in Psychological Choice, 99-121, Elsevier, Amsterdam.
de Borda, J. (1781). Mémoire sur les élections au scrutin. Histoire de L’Académie Royale des Sciences, 102, 657-665.
de Leeuw, J (2006). Nonlinear Principal Component Analysis and Related Techniques. In MJ Greenacre, J Blasius (eds.), Multiple Correspondence Analysis and Related Methods, chapter 4, 107–134, Chapman & Hall/CRC, Boca Raton.
de Leeuw, J. and Mair, P. (2009). Homogeneity Analysis in R: the Package homals. Journal of Statistical Software, 31(4):1-21.
Eves, H. (1997). Foundations and Fundamental Concepts of Mathematics. N.Y. : Dover.
Fichet, B. (2009). Metrics of Lp-type and distributional equivalence principle. Advances in Data Analysis and Classification, 3, 305-314.
Gabriel, K.R. and Zamir, S. (1979). Lower rank approximation of matrices by least squares with any choice of weights. Technometrics, 21, 489-498.
Gifi, A. (1990). Nonlinear Multivariate Analysis. N.Y: Wiley.
Greenacre, M. (1984). Theory and Applications of Correspondence Analysis. Academic Press, London.
Heiser,W.J. and de Leeuw, J. (1981). Multidimensional mapping of preference data. Mathématiques et Sciences Humaines, 73, 39-96.
Inglehart, R. (1977). The Silent Revolution: Changing Values and Political Styles Among Western Publics. Princeton University Press, Princeton.
Jacques, J., Grimonprez, Q. and Biernacki, C. (2014). RankClustr: An R package for clustering multivariate partial rankings. The R Journal, 6(1), 101-110).
Le Roux, B. and Rouanet, H. (2004). Geometric Data Analysis. From Correspondence Analysis to Structured Data Analysis. Dordrecht: Kluwer–Springer.
Lee, P. H. and Yu, P. L. H. (2012). Mixtures of weighted distance-based models for ranking data with applications in political studies. Computational Statistics and Data Analysis, 56(8), 2486-2500.
Lee, P. and Yu, P. (2013). An R package for analyzing and modeling ranking data. BMC Medical Research Methodology, 13(65), 1-11).
Mallet-Gauthier, S. and Choulakian, V. (2015). Taxicab correspondence analysis of abundance data in archeology: Three case studies revisited. Archeologia e Calcolatori, 26, 77-94.
Marchant, T. (1998). Cardinality and the Borda score. European Journal of Operational Research, 108, 464-472.
Marden, J.I. (1995). Analyzing and Modeling of Rank Data. Chapman & Hall, London, UK.
Moors, G. and Vermunt, J. (2007). Heterogeneity in post-materialists value priorities. Evidence from a latent class discrete choice approach. European Sociological Review, 23(5), 631–648.
Murtagh, F. (2005). Correspondence Analysis and Data Coding with Java and R. Boca Raton, FL., Chapman & Hall/CRC.
Nishisato, S. (1984). Forced classification: A simple application of a quantification method. Psychometrika, 49, 25-36.
Nishisato, S. (2007). Multidimensional Nonlinear Descriptive Analysis. Chapman & Hall/CRC, Baco Raton, Florida.
Pisier, G. (2012). Grothendieck’s theorem, past and present. Bulletin of the American Mathematical Society, 49 (2): 237-323.
Saari, D.G. (1990a). The Borda dictionary. Social Choice and Welfare, 7, 279-317.
Saari, D.G. (1990b). Susceptibility to manipulation. Public Choice, 64, 21-41.
Saari, D.G. (1999). Explaining all three-alternative voting outcomes. Journal of Economic Theory, 87, 313-355.
Skrondal, A. and Rabe-Hesketh, S. (2004). Generalized Latent Variable Modeling. Chapman & Hall/CRC, Boca Raton, Florida.
Takane, Y. (2014). Constrained Principal Compnent Analysis and Related Techniques. CRC Press, Bacon Raton, Florida.
Takane, Y., Kiers, H.A.L. and de Leeuw J. (1995) Component analysis with different constraints on different dimensions. Psychometrika, 60, 259-280.
Van Deun, K., Heiser,W.J. and Delbeke, L. (2007) Multidimensional Unfolding by Nonmetric Multidimensional Scaling of Spearman Distances in the Extended Permutation Polytope. Multivariate Behavioral Research, 42(1), 103–132.
Vitelli, V., Sørenson, Ø., Frigessi, A. and Arjas, E. (2015). Probabilistic preference learning with the Mallows rank model. In arXiv:1405.7945v3.
Wold, H. (1966). Estimation of principal components and related models by iterative least squares. In Multivariate Analysis, ed. Krishnaiah, P.R., N.Y: Academic Press, 391-420.
Young, P. (1974). An axiomatization of Borda’s rule. Journal of Economic Theory, 9, 43-52.
Appendix
Proposition 1: For a globally homogenous rank data, .
Proof: Using the same notation as in Choulakian (2014), we designate
First, by (12) we have
from which we get,
| (19) |
Second, by triangle inequality of the L1 norm we have
| (20) |
Third, by Fact 1 given in section 3 (the marginal relative frequency of the nega row is 1/2) and (15), we have
| (21) |
Now we have
Theorem 2 (Faithfully homogenous group):
a) For or and , we define then
b) The vector containing the first and only factor scores of the two rows is
c) The vector containing the first and only factor scores of the columns is where for In particular, we see that and for are equispaced. So for an odd number of items for , we have
Proof: a) A faithfully homogenous group consists of one response pattern, and its Borda score values for a complete linear order of items, without loss of generality by relabeling of the items, will be . Then the nega coded correspondence table will have only two rows and columns
and will be of rank 1; that is, there is only one principle factor, for which we note the taxicab dispersion measure by for a fixed finite integer value of By (18) the elements of are
and
so
| (22) |
The value of by Theorem 1 b is
Now we consider separately even and odd values of , and for .
Case 1: , then
Case 2: , then
b) We have
but the sign of is always negative by convention, so and by (22).
c) By (9) and (15), we have and or elementwise
Theorem 3: For a globally homogenous rank data set we have
Proof: First, we note that is column centered by Fact 3, so we have
from which we get
| (23) |
Second, given that each row of has the same values, , so we have
| (24) |
We have
Theorem 4: if and only if there is a faithful partition of the items and the Borda scores of all voters are intra block permutations.
Proof: It is similar to the proof of Theorem 3, where the inequality is replaced by equality. We provide a proof for and ; for an odd integer, the proof being similar.
a) Necessary condition. We have
where and for Given that is a sum of positive terms, it is easy to see that u is the first TCA principal axis, where is the characteristic function of that is, it has the value of 1 if and 0 otherwise. So for and the first TCA axis divides the set of items into 2 blocks such that with and that is, the partition of the set of items is faithful. Furthermore, the Borda scores of all voters are intra block permutations by definition of and .
b) Sufficient condition. We suppose that the partition of is faithful and there are no crossings between the 2 blocks and this implies that for for and for thus we get as in the proof of the necessary condition.
Corollary 1: if and only if for .
Proof: This follows easily from u
Corollary 2: For a globally homogenous rank data, for .
Proof: For an individual , happens if the partition of the items is not faithful or there are crossings of some Borda scores between the blocks.