Radio follow-up of gravitational wave triggers during Advanced LIGO O1
Abstract
We present radio follow-up observations carried out with the Karl G. Jansky Very Large Array during the first observing run (O1) of the Advanced Laser Interferometer Gravitational-wave Observatory (LIGO). A total of three gravitational wave triggers were followed up during the months of O1, from September 2015 to January 2016. Two of these triggers, GW150914 and GW151226, are binary black hole merger events of high significance. A third trigger, G194575, was subsequently declared as an event of no interest (i.e., a false alarm). Our observations targeted selected optical transients identified by the intermediate Palomar Transient Factory (iPTF) in the Advanced LIGO error regions of the three triggers, and a limited region of the gravitational wave localization area of G194575 not accessible to optical telescopes due to Sun constraints, where a possible high-energy transient was identified. No plausible radio counterparts to GW150914 and GW151226 were found, in agreement with expectations for binary black hole mergers. We show that combining optical and radio observations is key to identifying contaminating radio sources that may be found in the follow-up of gravitational wave triggers, such as emission associated to star formation and AGN. We discuss our results in the context of the theoretical predictions for radio counterparts to gravitational wave transients, and describe our future plans for the radio follow-up of Advanced LIGO (and Virgo) triggers.
Subject headings:
gravitational waves — radiation mechanisms: general — radio continuum: general1. Introduction
The first observing run (O1) of the Advanced Laser Interferometer Gravitational–wave Observatory (LIGO; Abbott et al., 2016a) started in September 2015 and ended in January 2016. On 14 September 2015, the two Advanced LIGO detectors recorded their first significant event, GW150914, produced by the merger of two black holes (BHs) with masses of M⊙ and M⊙ (Abbott et al., 2016b). A panchromatic (radio to -rays) follow-up campaign of GW150914 was carried out by partner electromagnetic (EM) facilities, marking the start of GW astronomy (Abbott et al., 2016c, and references therein). No high-significance EM counterpart to GW150914 was found, although a -ray event (compatible with the large GW localization area) occurring s after GW150914 was reported by the Fermi/GBM team (Connaughton et al., 2016). A second GW alert was sent out to EM partners in October 2015, but the event that triggered this alert (G194575) was subsequently retracted as a false alarm (LSC & Virgo, 2015a). Finally, in December 2015, Advanced LIGO recorded a second significant binary BH event, GW151226 (Abbott et al., 2016d). This detection was also accompanied by a vast EM follow-up effort (Adriani et al., 2016; Cowperthwaite et al., 2016; Copperwheat et al., 2016; Evans et al., 2016; KamLAND Collaboration et al., 2016; Racusin et al., 2016; Smartt et al., 2016).
Stellar mass BH binaries such as the ones that produced GW150914 and GW151226 are generally not expected to be associated with detectable EM signatures (see e.g., Mösta et al., 2010). However, after the first LIGO detection was announced, and following the Fermi/GBM claim, several ideas have emerged about the possibility of producing EM counterparts to events like GW150914. Proposed models range from EM signals emitted from in-falling matter from a circum-binary disk, to dissipation of magnetic energy and extraction of rotational energy from a BH via the Blandford-Znajek process (Blandford & Znajek, 1977). Fallback material from a supernova (SN) explosion may remain bound around a BH for long periods and re-ignite accretion as the binary tightens (Perna et al., 2016). The core-collapse of a massive star may lead to the formation of “blobs” that evolve separately and merge, with some remaining core material falling into the merger remnant to produce a -ray burst (GRB; Loeb, 2016), although this scenario is controversial (Woosley, 2016). It has also been suggested that BH merger events of sufficient energy ( erg in collimation–corrected kinetic energy) occurring in dense enough circum-stellar material (CSM), and/or powering fast outflows that shock the ISM, may produce radio signatures of a few to a few tens of Jy at 1.4 GHz (Yamazaki et al., 2016; Murase et al., 2016).
The existence of detectable EM emission from binary BH mergers remains speculative. However, Advanced LIGO should detect 0.4–400 Neutron Star (NS)-NS and 0.2–300 NS-BH binaries per year when reaching nominal sensitivity (Abadie et al., 2010). Compact binary mergers involving at least one NS are expected to produce EM emission. Indeed, these events could power short GRBs (see e.g. Berger, 2014, and references therein), “kilonova” emission in the optical (e.g., Li & Paczyński, 1998; Metzger & Berger, 2012; Barnes & Kasen, 2013; Metzger & Fernandez, 2014; Jin et al., 2016), and detectable radio signatures (as the ultra-to-mildly relativistic components of the ejecta interact with the ISM; e.g., Nakar & Piran, 2011; Hotokezaka et al., 2016). Optical kilonova and radio emissions, unlike the rays, are less affected by collimation, relativistic beaming, and viewing angle effects, thus offering a better chance of detection for binary NS (or BH-NS) mergers launching relativistic jets not aligned with our line of sight (which are expected to constitute the majority of Advanced LIGO detections).
Given the large error areas associated with Advanced LIGO localizations (Cavalier et al., 2006; Fairhurst, 2011; Klimenko et al., 2011; Nissanke et al., 2011; Abbott et al., 2016e), the detection of an EM counterpart via large field-of-view (FOV) facilities such as the intermediate Palomar Transient Factory (iPTF; Law et al., 2009) can provide orders of magnitude better localizations, and enable panchromatic follow-up observations with smaller FOV instruments like the Karl G. Jansky Very Large Array111The National Radio Astronomy Observatory is a facility of the National Science Foundation operated under cooperative agreement by Associated Universities, Inc. (VLA; Perley et al., 2009). In turn, a radio detection in coincidence with one of the many optical candidates expected to be found in the error-area of a GW event can help enhance the confidence in the EM counterpart association, rule out false associations, and constrain source and environment properties. While GWs from a tidally disrupted NS in a NS–BH binary can provide better constraints on the equation of state (via measurements of the NS radius; Vallisneri, 2000), radio follow-up can provide unique information such as outflow velocity, geometry and total energetics (through calorimetry; Frail et al., 2000), and circum-binary medium density (Berger, 2010; Hotokezaka et al., 2016). Our O1 VLA follow-up program222VLA/15A-339; PI: Corsi was designed to achieve these goals (while leaving space for serendipitous discoveries).
Here, we present the results of our VLA follow-up observations of GW150914, G194575, GW151226, carried out in coordination with the iPTF. We refer the reader to Kasliwal et al. (2016) and Kasliwal et al. (in prep.) for details regarding the iPTF follow-up strategy, selection criteria, and photometric/spectroscopic properties of candidate optical counterparts found in the error regions of the LIGO triggers. Here, we focus on the results of our VLA observations. Specifically, in Section 2 we describe our VLA follow–up program for O1, and the criteria based on which we identified transients worthy of radio follow-up. In Section 3 we describe our radio observations and image processing. In Sections 4-5 we discuss our results. Finally, in Section 6, we give an overview of future prospects for our VLA follow-up program and conclude.
| ID | GW trigger time | SNR | Type | 90% GW area | iPTF area | Cont. prob. | no. iPTF cand. | no. VLA cand. | Ref. | |
|---|---|---|---|---|---|---|---|---|---|---|
| (MJD) | (deg2) | (deg2) | ||||||||
| GW150914 | 57279.410 | 24 | BH–BH | 230 | 126 | 2.5% | 8 | 1 | [1-6] | |
| G194575 | 57317.566 | – | – | – | – | 1114 | – | 42 | 13 | [7-11] |
| GW151226 | 57382.166 | 13 | BH–BH | 850 | 952 | 51% | 20 | 2 | [12-15] |
2. The VLA follow–up program
Given the relatively small VLA FOV (primary beam) of a few arcmin at a few GHz frequencies (to be compared to (100) deg2 GW localization areas; Abbott et al., 2016e), our VLA follow-up program of Advanced LIGO triggers was designed to work in coordination with larger FOV facilities, such as the iPTF (Kasliwal et al., 2016). The iPTF large FOV, as well as its automated transient identification and selection capabilities, assure that candidate EM counterparts worthy of follow-up are promptly identified.
Some of the advantages of following–up in the radio selected optical candidates identified in the LIGO localization regions (as opposed to a “blind” coverage of the GW localization area in the radio), are the fact that optical (photometric and spectroscopic) observations can provide:
-
•
Accurate source locations, that enable deeper sensitivity radio follow-ups with small FOV radio facilities;
-
•
Redshift measurements, that can be compared for consistency with the distance estimate derived from the GW triggers;
-
•
Host galaxy information, which is useful to estimate potential contributions to the radio emission from star formation or Active Galactic Nuclei (AGN) activity;
-
•
Spectroscopic classifications that, together with the redshift information, can guide expectations for the detectability of possible radio counterparts for a given level of sensitivity.
A downside of our VLA (GHz) follow-up strategy is that it may miss radio transients with faint optical counterparts, such as short GRB optical afterglows observed largely off-axis (Metzger & Berger, 2012). Transients that are faint in the optical may still be identifiable via observations at lower radio frequencies ( MHz) by larger FOV radio facilities such as the Low-Frequency Array for radio astronomy (LOFAR; van Haarlem et al., 2013) and the Murchinson Widefield Array (MWA; Bowman et al., 2013), which indeed participated in the Advanced LIGO EM follow-up program during O1 (Abbott et al., 2016c). We note, however, that GHz observations with the VLA offer some important advantages such as deep sensitivity, lower number of contaminating astrophysical sources, and less radio frequency interference (RFI).
For the three Advanced LIGO O1 GW alerts (GW150914, G194575, and GW151226; see Section 1), iPTF covered error areas of (Kasliwal et al., 2016), (Singer et al., 2015c), and (Cenko et al., 2015), respectively. In the case of GW150914, the prior probability that the iPTF imaged area contained the true location of the source was only 2.5% due to Sun angle and elevation constraints, and the iPTF observations started on the second night after the GW trigger (UT Sep 17; Kasliwal et al., 2016). In the case of GW151226, the iPTF containment probability was 51% for the total imaged area, and 37% for the portion of the iPTF imaged area for which previously obtained reference images were available (Cenko et al., 2015). iPTF observations of GW151226 started days after the GW trigger (Cenko et al., 2015).
In the areas imaged as part of the O1 triggers follow-up, iPTF discovered (on the same night the observations started) a total of 70 optical transients, out of which 16 were followed–up in the radio with the VLA (Table 1). As we explain in what follows, no radio counterpart to the iPTF optical transients was found. However, for several of the iPTF candidates we discovered excess radio emission related to star formation in the host galaxy. Generally, we adhered to the criteria outlined in Kasliwal et al. (2016) for optical candidates rejection or spectroscopic / additional photometric follow–up. For the VLA follow-up, we applied the following criteria:
-
•
For optical candidates with same night optical spectral classification, we discarded SNe of type Ia, SNe of type II, and AGNs, due to the low probability of these being strong GW emitters at cosmological distances.
-
•
For optical candidates with same night optical spectral classification, we carried out at least one single-band (typically C-band, centered around GHz) continuum VLA observation of stripped-envelope core-collapse SNe (type Ib/c), and/or peculiar/rare SNe such as super-luminous and CSM-interacting ones (e.g., type Ibn).
-
•
When spectral classification was not immediately available, we carried out at least one single-band continuum VLA observation of optical transients coincident with galaxies at low redshifts, and/or unclassified optical candidates showing fast temporal evolution (as possible kilonova candidates, see e.g., Li & Paczyński, 1998; Metzger & Berger, 2012; Barnes & Kasen, 2013; Metzger & Fernandez, 2014).
-
•
For optical candidates for which a radio excess was detected in the first radio epoch, for type Ic SNe (because of their connection to GRBs; e.g., Woosley & Bloom, 2006; Corsi et al., 2016), for CSM-interacting SNe (for which one might expect late-time radio emission; Ofek et al., 2013; Corsi et al., 2014, 2016), and for other optical transients of unclear nature, we carried our further VLA follow-up, via multi-epoch single-band (so as to constrain temporal variability) and/or multi-band (so as to constrain radio spectral properties) observations.
-
•
Finally, the statistic (with being the difference in flux between two epochs, and the error on the flux difference) was used to establish whether radio flux variability was present in any of the candidates observed on at least two epochs. The variability threshold was chosen so that the –statistic lies beyond the 95% confidence interval (Mooley et al., 2016). Evidence for variability (although we found none in this search) is considered a reason for further multi-epoch multi-band VLA follow-up.
We discuss in detail the results of the VLA follow-up of iPTF transients in Sections 3 and 4.
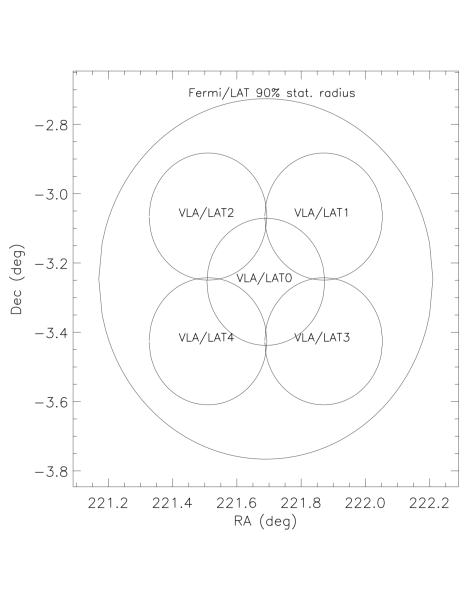
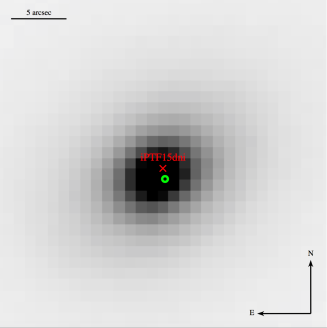
For event G194575, in addition to selected iPTF candidates localized to arcsec positions, we also followed–up a possible -ray transient detected by the Fermi/LAT in the GW localization area, and localized by it to deg radius (plus deg systematic error) at deg from the Sun (Vianello et al., 2015). Five VLA pointings were carried out at a central frequency of 3 GHz (Fig. 1). These observations represented a first “test run” aimed at evaluating the feasibility of VLA follow–ups of limited regions of the GW localization area not accessible to optical observatories due to Sun constraints. The results of this run are reported in Sections 3 and 5.
3. Observations and data reduction
VLA follow-up observations of iPTF candidates in the GW error regions of the three O1 alerts were carried out at a central frequency of GHz, with a 2 GHz nominal bandwidth, and with the array in its D or DnC configuration. Multi–frequency observations were performed on selected targets (according to the criteria described in Section 2). The Common Astronomy Software applications (CASA) was used to calibrate, flag, and image the data. The automated VLA calibration pipeline for CASA was used to calibrate the raw data. When needed, further flagging was carried out manually after visual inspection of calibrators and source data.
Follow-up observations of the possible Fermi/LAT transient identified in the error region of G194575 (see Section 3.2) were carried out on two epochs at a central frequency of 3 GHz, with the VLA in its D configuration. These data were not calibrated using the automated calibration pipeline due to RFI and elevated noise level caused by Sun proximity (the angular distance between the center of the Fermi/LAT transient localization area and the Sun was deg and deg, respectively, on the two VLA epochs). After flagging, the usable data for the second epoch were limited to only two spectral windows, for a total nominal bandwidth of 256 MHz. We thus restricted the first epoch analysis to these same two spectral windows.
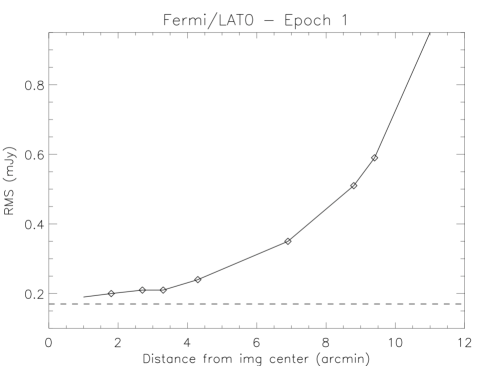
Images of the observed VLA fields were formed from the visibility data using the CLEAN algorithm. In creating the VLA images for the five fields covering the localization area of the possible Fermi/LAT transient, during the CLEAN step, we corrected for the shape of the VLA primary beam ( arcmin Full-Width-at-Half-Power). The primary beam correction was applied to a region extending up to power radius of the primary beam (which is the standard option in CLEAN). As expected, after applying the primary beam correction, the RMS of the residual image increases with increasing distance from the image center (Fig. 2).
In the VLA images collected as part of the follow-up of iPTF candidates, we searched for excess radio emission using a circular region centered on the candidates optical positions, with radius comparable to the nominal half-power synthesized beam width of the VLA for the frequency band at which the observations were carried out. For the VLA images collected as part of the follow-up of the Fermi/LAT transient, BLOBCAT (Hales et al., 2012) was used to construct a list of candidate sources (blobs) formed by locating pixels with surface brightness greater than the RMS noise (as estimated in the central region of the map), and then searching for neighboring pixels having surface brightness greater than the RMS. The blobs were visually inspected, and their significance was corrected for the shape of the primary beam by rescaling the estimated RMS according to source distance from the image center (see Fig. 1). Candidate sources with peak-flux-to-primary-beam-corrected RMS ratio less than 5 were discarded.
In Tables 2-7 we list the radio detections (and/or 3 upper-limits for the iPTF follow-up) obtained during our O1 campaign. In these Tables, upper-limits for the non-detections are calculated as the noise RMS around the map center, close to the location of the iPTF transient. For the detections, we report peak fluxes estimated using the IMSTAT routine. Flux errors are calculated as the quadratic sums of the RMS map error, and a 5% fractional error that accounts for absolute flux calibration errors (Weiler et al., 1986; Corsi et al., 2014). The VLA positions were determined using the imfit routine in CASA, which fits an elliptical Gaussian component on an image region which was chosen as a circular region of radius equal to the half-power width of the major axis of the actual VLA synthesized beam. Position errors were estimated using both imfit (RA and Dec errors returned for the chosen extraction region were added in quadrature), and the half-power width of the semi-major axis of the VLA synthesized beam, divided by the peak-flux-to-RMS ratio. These position error estimates were usually found to be in good agreement for point sources with fluxes above the map RMS at the source position. Positions errors smaller than 0.1 arcsec were set to this value to account for the VLA systematic positional uncertainty. In Tables 2-7, we conservatively report the largest of these error estimates as our position error radii.
In Tables 2-4 we also report the iPTF classification (column labelled “Class”) of the various transients. Transient classifications followed by a question mark are less secure than unmarked ones. All of the iPTF transients with a nearby radio detection were also observed/classified spectroscopically (see Kasliwal et al. (in prep.) and Smartt et al. (2016) for further details).
| name | RA Dec (iPTF) | Class | VLA epoch | Freq. | Flux or 3 UL | ||
|---|---|---|---|---|---|---|---|
| (hh:mm:ss deg:mm:ss) | (MJD) | (day) | (GHz) | (Jy beam-1) | |||
| iPTF15cyk | 07:42:14.87 20:36:43.4 | SLSN I | 57310.5 | 28 | 5.4 | 30 | |
| ” | ” | ” | 57362.2 | 80 | 5.4 | 23 | |
| ” | ” | ” | 57407.1 | 125 | 5.4 | 23 |
| name | RA Dec (iPTF) | Class | VLA epoch | Freq. | Flux or 3 UL | RA Dec (VLA) | offset | pos. err. (VLA) | |
| (hh:mm:ss deg:mm:ss) | (MJD) | (day) | (GHz) | (Jy beam-1) | (hh:mm:ss deg:mm:ss) | (arcsec) | (arcsec) | ||
| iPTF15dkk | 23:50:17.21 -03.09.59.8 | Nuclear? | 57324.1 | 6 | 6.3 | - | - | - | |
| ” | - | 57330.1 | 12 | 6.4 | - | - | - | ||
| iPTF15dkm | 23:37:17.70 -03.31.57.1 | SN II | 57330.1 | 12 | 6.4 | - | - | - | |
| iPTF15dkn | 23:50:11.10 +00:05:47.8 | Nuclear? | 57324.1 | 6 | 6.3 | - | - | - | |
| ” | ” | ” | 57330.1 | 12 | 6.4 | - | - | - | |
| iPTF15dkv | 00:31:05.08 -02:39:08.2 | RadioS | 57324.1 | 6 | 5.2 | 00:31:04.952 -02:39:12.62 | 4.8 | 0.1 | |
| ” | ” | - | ” | ” | 7.4 | 00:31:04.951 -02:39:12.58 | 4.8 | ” | |
| ” | ” | - | 57330.1 | 12 | 5.2 | 00:31:04.979 -02:39:12.60 | 4.6 | ” | |
| ” | ” | - | ” | ” | 7.4 | 00:31:04.975 -02:39:12.66 | 4.7 | ” | |
| iPTF15dld | 00:58:13.28 -03:39:50.3 | BL-Ic | 57324.1 | 6 | 6.4 | 00:58:13.094 -03:39:49.18 | 3.0 | 2.1 | |
| ” | ” | ” | 57330.1 | 12 | ” | 00:58:13.155 -03:39:48.63 | 2.5 | 1.1 | |
| ” | ” | ” | 57336.0 | 18 | 6.4 | 00:58:13.035 -03:39:47.58 | 4.6 | 1.5 | |
| ” | ” | ” | 57336.1 | 18 | 2.9 | - | - | - | |
| ” | ” | ” | ” | ” | 6.4 | 00:58:13.110 -03:39:47.68 | 3.6 | 1.8 | |
| ” | ” | ” | ” | ” | 9.0 | 00:58:13.234 -03:39:48.92 | 1.5 | 1.1 | |
| iPTF15dlj | 01:19:02.87 +10:00:04.8 | SN II | 57324.1 | 6 | 6.3 | - | - | - | |
| ” | ” | ” | 57330.1 | 12 | 6.4 | - | - | - | |
| iPTF15dln | 00:58:19.67 +07:14:05.0 | Nuclear? | 57324.1 | 6 | 6.4 | - | - | - | |
| ” | ” | ” | 57330.1 | 12 | ” | - | - | - | |
| iPTF15dmk | 01:24:54.37 +00:37:07.5 | SN II | 57324.1 | 6 | 6.4 | - | - | - | |
| ” | ” | ” | 57330.1 | 12 | ” | - | - | - | |
| ” | ” | ” | 57336.1 | 18 | ” | - | - | - | |
| iPTF15dmn | 00:28:56.73 -11:24:19.8 | AGN | 57324.1 | 6 | 5.1 | 00:28:56.786 -11.24.19.72 | 0.83 | 0.39 | |
| ” | ” | ” | 6 | 7.4 | 00:28:56.774 -11:24:20.22 | 0.76 | 0.37 | ||
| iPTF15dmq | 23:35:30.74 +06:27:01.1 | Asteroid | 57324.1 | 6 | 6.3 | - | - | - | |
| ” | ” | ” | 57330.1 | 12 | 6.4 | - | - | - | |
| iPTF15dmu | 01:30:23.01 -04:24:36.7 | SN? | 57336.1 | 18 | 5.2 | 01:30:23.128 -04.24.36.95 | 1.80 | 0.51 | |
| ” | ” | ” | ” | ” | 7.5 | 01:30:23.112 -04:24:37.09 | 1.58 | 0.44 | |
| ” | ” | ” | 57344.0 | 26 | 2.7 | 01:30:23.293 -04.24.39.64 | 5.15333Two unresolved emission components present. | 0.76 | |
| ” | ” | ” | ” | 26 | 5.2 | 01:30:23.220 -04:24.38.31 | 3.62444Two marginally resolved emission components present. | 0.67 | |
| ” | ” | ” | ” | 26 | 7.4 | 01:30:23.095 -04:24:36.62 | 1.26 | 0.43 | |
| ” | ” | ” | ” | 26 | 8.5 | 01:30:23.052 -04:24:36.29 | 0.76 | 0.54 | |
| ” | ” | ” | ” | 26 | 9.5 | 01:30:23.032 -04:24:36.22 | 0.58 | 0.33 | |
| iPTF15dnh | 00:59:38.27 -14:11:56.8 | - | 57324.1 | 6 | 6.3 | - | - | - | |
| ” | ” | - | 57330.1 | 12 | 6.4 | - | - | - | |
| iPTF15dni | 01:25:04.02 -04:42:30.4 | AGN? | 57324.1 | 6 | 5.1 | 01:25:04.019 -04:42:30.87 | 0.47 | 0.34 | |
| ” | ” | ” | ” | ” | 7.4 | 01:25:03.998 -04:42:31.28 | 0.94 | 0.36 | |
| ” | ” | ” | 57330.1 | 12 | 5.2 | 01:25:04.031 -04:42:31.34 | 0.97 | 0.30 | |
| ” | ” | ” | ” | ” | 7.4 | 01:25:04.007 -04:42:31.37 | 1.01 | 0.26 |
| name | RA Dec (iPTF) | Class | VLA epoch | Freq. | Flux or 3 UL | RA Dec (VLA) | offset | pos.err. (VLA) | |
| (hh:mm:ss deg:mm:ss) | (MJD) | (day) | (GHz) | (Jy beam-1) | (hh:mm:ss deg:mm:ss) | (arcsec) | (arcsec) | ||
| iPTF15fgl | 02:32:59.78 +18:38:07.7 | SN Ibn | 57395.2 | 11 | 6.3 | 02:32:59.850 +18.38.07.01 | 1.22 | 0.90 | |
| ” | ” | ” | 57400.1 | 16 | 3.1 | 02:32:59.870 +18:38:07.56 | 0.72 | 2.9 | |
| ” | ” | ” | ” | ” | 9.0 | 02:32:59.830 +18:38:07.35 | 0.79 | 0.75 | |
| ” | ” | ” | ” | ” | 14.8 | 02:32:59.907 +18:38:07.10 | 1.9 | 1.0 | |
| ” | ” | ” | 57401.1 | 17 | 6.3 | 02:32:59.855 +18:38:06.91 | 1.33 | 0.91 | |
| ” | ” | ” | 57407.1 | 23 | 6.4 | 02:32:59.901 +18:38:07.12 | 1.80 | 0.81 | |
| ” | ” | ” | 57409.1 | 25 | 3.0 | 02:32:59.800 +18:38:04.76 | 3.0 | 4.6 | |
| ” | ” | ” | ” | ” | 9.0 | 02:32:59.879 +18:38:07.55 | 1.4 | 0.68 | |
| ” | ” | ” | ” | ” | 14.7 | 02:32:59.945 +18:38:08.50 | 2.5 | 1.2 | |
| iPTF15fhl | 12:28:13.60 17:37:01.4 | SN Ib/c | 57386.4 | 2 | 5.1 | 12:28:13.704 +17:36:53.57 | 7.96 | 0.34 | |
| ” | ” | ” | ” | ” | 7.5 | 12:28:13.664 +17:36:53.43 | 8.03 | 0.42 | |
| ” | ” | ” | 57394.4 | 10 | 5.1 | 12:28:13.711 +17:36:54.33 | 7.24 | 0.39 | |
| ” | ” | ” | ” | ” | 7.4 | 12:28:13.733 +17:36:53.87 | 7.78 | 0.35 | |
| ” | ” | ” | 57408.3 | 24 | 5.2 | 12:28:13.783 +17:36:54.32 | 7.56 | 0.94 | |
| ” | ” | ” | ” | ” | 7.4 | 12:28:13.720 +17:36:54.18 | 7.42 | 0.62 |
3.1. GW150914
GW150914 was a binary BH coalescence (Abbott et al., 2016b). BH component masses and redshift are reported in Table 1. A super-luminous SN (iPTF15cyk) was the most notable optical transient discovered in the error region of GW150914 by the iPTF. This SN, although unrelated to the GW trigger, was followed-up in radio with the VLA on three epochs covering a timeframe of 1-3 months after the iPTF discovery (as listed in Table 2). The timescale of our VLA monitoring was motivated by models predicting possible late-time radio emission from super-luminous SNe (Ofek et al., 2013). No radio emission was detected at the location of iPTF15cyk. We refer the reader to Kasliwal et al. (2016) for a detailed description of the iPTF follow-up performed for GW 150914.
3.2. G194575
G194575 was the second GW alert sent out during Advanced LIGO O1 (LSC & Virgo, 2015b), subsequently declared as an event of no interest. Our VLA follow-up of optical transients identified in the error region of G194575 by the iPTF covered a timeframe of approximately 1 week to 25 days after the iPTF discovery (Table 3), optimized for the detection of radio emission from off-axis short GRBs and relativistic SNe, and covering the rising part of the emission potentially associated with slower ejecta from NS-NS (or NS-BH) binaries (see Section 6 and Corsi et al., 2016).
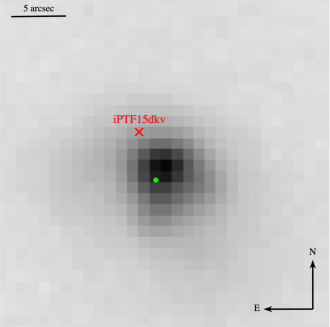
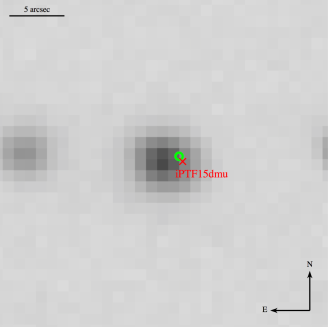
Two iPTF sources with nearby radio detections in the error areas of G194575 are most notable, iPTF15dld and iPTF15dmu. iPTF15dld was a broad-lined Type Ic (BL-Ic) SN at a redshift of , especially interesting because of the rarity of these type of naked core-collapse SNe (see e.g. Corsi et al., 2016, and references therein). Given the connection between BL-Ic SN and GRBs, this object was also followed-up in X-rays with Swift/XRT at 0.3–10 keV, under our BL-Ic program555Swift Cycle 11 proposal ; PI: Corsi. The Swift/XRT observation resulted in a non–detection (Corsi et al., 2016). For iPTF15dmu, iPTF provided photometric observations showing lack of significant fading on a two-week timescale, the disappearance of the transient on a two-month timescale, and an off-nuclear location. These properties are suggestive of a SN origin.
Out of the total 13 iPTF transients followed–up with the VLA for G194575, 5 showed a significant () radio excess near the iPTF location (Table 3), and were re–observed on multiple epochs to search for variability. According to the variability statistic defined in Section 2, none of the iPTF transients with a nearby radio detection (and more than one radio observation) showed any variability over the timescales of our follow-up. The detected radio excesses are easily accounted for by star formation of the host galaxies, and none of them are attributed to radio counterparts of the iPTF transients (see Section 4).
Within the error area of G194575, s after the GW trigger, a possible -ray transient was detected by the Fermi/LAT (Racusin et al., 2016). As described in Section 2, we observed five fields partially covering the Fermi/LAT localization area for this -ray trigger (Fig. 1). Each of the fields was observed on two epochs separated by about d. Sources were extracted from the first epoch images as described in Section 3. Their locations were recorded and used to measure the fluxes in the second epoch images (see Table 7). As we discuss in Section 5, almost all of these sources were previously cataloged radio sources and none were found to be variable over the two epochs of our follow-up.
3.3. GW151226
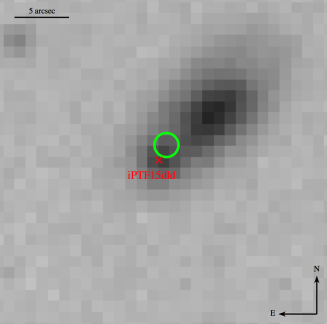
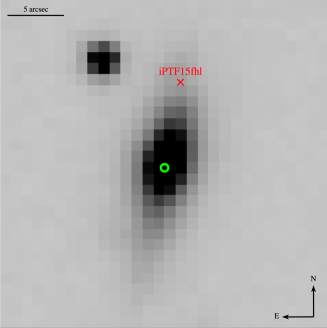
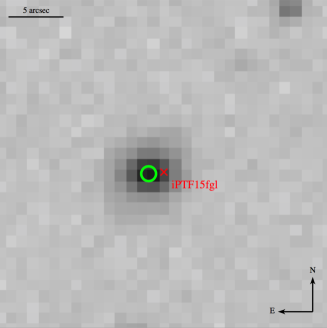
GW151226 is the second significant binary BH merger detected by Advanced LIGO during O1. Component BH masses and redshift range for this event are reported in Table 1. Similarly to the case of G194575, our VLA follow-up of optical transients identified in the error region of GW151226 by the iPTF covered a timeframe of approximately 1 week to 25 days after the iPTF discovery (Table 4). Two iPTF transients found in the error region of GW151226 were most notable (although likely unrelated to the GW event given its binary BH merger origin), iPTF15fgl (also named PS15dpn, a type Ibn SN; see Smartt et al., 2016, for more details), and iPTF15fhl (a Type Ib/c SN). These transients were both followed up with the VLA. While significant radio excesses were detected close to the locations of iPTF15fhl and iPTF15fgl (Table 4), these radio detections are easily accounted for by star formation in the host galaxies of these SNe. Indeed, according to the variability statistic defined in Section 2, none of the detected radio excesses showed any variability over the timescales of our follow-up (see Section 4). We thus find no evidence for radio counterparts to the SNe iPTF15fgl and iPTF15fhl.
4. iPTF candidates with radio detections
Star-forming galaxies and AGN represent the two major populations of radio sources expected to be found in extragalactic radio (cm) continuum surveys (e.g., Condon, 1992; Sadler et al., 1999; Smolcic et al., 2008, 2016), and as such they can be a source of false positives in radio follow-up of GWs. Recent results indicate that below flux densities of Jy at 3 GHz, star-forming galaxies begin to dominate in terms of fractional contribution to the total source sample (Smolcic et al., 2016), although low luminosity AGN may also be present (Mooley et al., 2013). At the mJy level, the transient/variable radio sky is dominated by AGN (Sadler et al., 1999) with accretion onto a central BH, or supermassive binary BHs. Optical properties, radio spectral index, luminosity, and mid-IR properties are some of the tools that can be used to distinguish between e.g. variable AGN radio emission and catastrophic stellar explosions (see also Mooley et al., 2013).
For 7 of the 16 iPTF optical transients followed-up with the VLA during Advanced LIGO O1, we detected a significant radio excess in the vicinity of the iPTF transient location. As previously discussed, none of these radio detections showed evidence for radio variability over the timescales of our observations (see Section 3). Because all of the iPTF transients with a nearby radio detection are embedded in host galaxies located within (Fig. 3), and in the light of the above considerations, in this Section we study their radio-mid-IR-optical properties to gain insight into the origin of the detected radio excess. As we explain in what follows, it is reasonable to attribute the detected radio excesses to star formation (SF) from normal galaxies. However, weak AGN emission cannot be securely excluded given that AGNs span a large range in radio power. Moreover, for two of the hosts, an AGN contribution is evident in the optical band.
4.1. Radio emission properties
Most of the cm radio emission from normal galaxies is due to synchrotron radiation from relativistic electrons accelerated by SN explosions; a smaller contribution arises from free-free scattering. Star formation rates (SFRs) of normal galaxies may be estimated as (Murphy et al., 2011; Perley & Perley, 2013):
| (1) |
where is the luminosity at 1.4 GHz. We stress that the above Equation assumes that all of the detected radio emission is due to SF.
Table 5 lists the redshift, distance, estimated spectral index (), and 1.4 GHz power, as well as estimated host galaxy SFR, for the iPTF transients with a detected radio excess close to the iPTF location. Radio spectral indices are estimated using fluxes measured in the two adjacent VLA sub-bands (for sources that only have single-band observations) averaged over the multiple epochs of observation, or by fitting the multi-band data (for sources that do have multi-band observations; see below). SFRs are calculated using Eq. (1) and the 1.4 GHz fluxes extrapolated from our VLA observations using the derived values of the spectral indices.
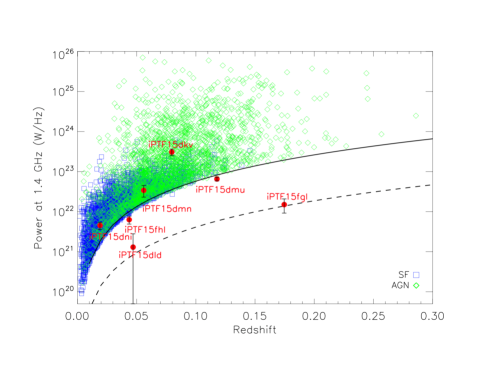
The SFRs derived from our radio detections are consistent with radio emission from normal galaxies (Condon, 1992). This is also shown in Figure 4, where we compare the extrapolated 1.4 GHz radio power as a function of redshift with the AGN and star-forming galaxies listed in Mauch & Sadler (2007). (We note that our search extended to the Jy level, so we were sensitive to fainter objects than the ones included in Mauch & Sadler (2007)). Indeed, almost all of the host galaxies of the iPTF transients followed with the VLA are within the region of normal galaxies (Mateos et al., 2012; Gürkan et al., 2014). The excess radio emission detected in the host of iPTF15dkv, which matches a previously cataloged radio source, is the brightest of our sample and could be compatible with AGN emission. However, combining radio data with optical ones from the 6 degree Field Galaxy Survey (Jones et al., 2004), Mauch & Sadler (2007) have classified the host of iPTF15dkv as a SF galaxy rather than an AGN. In fact, Mauch & Sadler (2007) found that although the median radio power of AGN in their sample (log [W Hz-1])=23.04) is almost an order of magnitude higher than the median for SF galaxies, AGN span a wide range in radio power ( W Hz-1) and so it is hard to separate SF galaxies from AGN based solely on a radio power cut.
| name | Class | z | Distance | VLA First 1.4 GHz | Radio SFR | Optical SFR | ||
|---|---|---|---|---|---|---|---|---|
| (Mpc) | ( W Hz-1) | ( W Hz-1) | (M) | (M) | ||||
| iPTF15dkv | RadioS | 0.0797 | 364 | 666Includes 5% absolute flux calibration error. | ||||
| iPTF15dld | SN BL-Ic | 0.047 | 210 | – | ||||
| iPTF15dmn | AGN | 0.056 | 252 | – | – | |||
| iPTF15dmu | SN? | 0.118 | 552 | – | ||||
| iPTF15dni | AGN? | 0.0191 | 83 | – | – | |||
| iPTF15fgl | SN Ibn | 0.175 | 849 | – | – | |||
| iPTF15fhl | SN Ib/c | 0.0437 | 195 | – |
For and order-of-magnitude comparison, we also estimated optical SFRs for some of the iPTF transients. We fitted the public SDSS and WISE photometry using our own custom SED-fitting software, employing the Bruzual & Charlot (2003) population synthesis templates at solar metallicity and Calzetti dust ( free, and with fixed to the standard Calzetti value of 4; see Calzetti et al., 2000). We assumed a maximum population age of 10 Gyr and a constant star-formation history except for a transition between 10-100 Myr, which allows us to fit the young population (SFR) and old population (total mass) independently. The resulting SFR estimates, reported in the last column of Table 5, depend significantly on these assumptions but form a reasonable estimate of the average SFR over the last 10 Myr. We note that the host galaxies of iPTF15dmn and iPTF15fgl are not in the SDSS footprint so we cannot calculate their optical SFR with this method. The host galaxy of iPTF15dni shows AGN signatures in its optical spectrum so we do not estimate its optical SFR (see Section 4.3 for discussion).
The radio spectral indices measured using our broad-band observations of the locations of iPTF15dld, iPTF15dmu, and iPTF15fgl range in between and (Table 5), and are consistent within the errors with the spectral indices of SF galaxies between 1.4-4.8 GHz, which are estimated to be (Seymour et al., 2008). We note, for comparison, that a typical radio quasar spectral index is , although could be more typical for quasars without the jet aligned along our line of sight (e.g., Stern et al., 2012).
4.2. Mid-IR properties
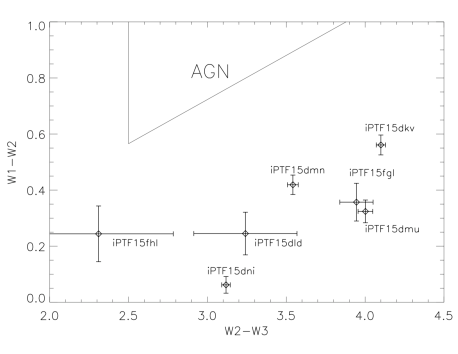
As a way to test further strategies for differentiating between AGN and normal galaxies, we also searched for WISE colors information (e.g., Mateos et al., 2012) for the host galaxies of the iPTF sources with nearby radio detections. The completeness and reliability of the WISE color AGN-selection technique are estimated to be and , respectively (Stern et al., 2012). Generally, normal radio galaxies emit a black body spectrum peaking at m. Dust in AGN gain high temperatures and radiate at the mid-IR wavelengths, following a power law spectrum. Therefore, AGN are generally expected to be much redder than normal galaxies at the mid–IR wavelengths (Lacy et al., 2004; Stern et al., 2005; Gürkan et al., 2014).
In Table 6 we list the 3.4 m, 4.6 m and12 m Vega magnitudes (referred to as W1, W2, W3, respectively) and offsets of the WISE sources closest to the significant radio excesses detected near the followed-up iPTF sources. In Figure 5 we plot W2-W3 vs W1-W2, and the AGN wedge defined as:
As evident from this Figure, all of the host galaxies of the iPTF transients followed with the VLA are clearly within the region of normal galaxies (Mateos et al., 2012; Gürkan et al., 2014).
| name | W1 | snrw1 | W2 | snrw2 | W3 | snrw3 | offset |
|---|---|---|---|---|---|---|---|
| (mag) | (mag) | (mag) | (arcsec) | ||||
| iPTF15dkv | 11.892 0.027 | 40 | 11.331 0.023 | 46 | 7.231 0.018 | 59 | 4.1 |
| iPTF15dld | 14.756 0.034 | 32 | 14.511 0.068 | 16 | 11.27 0.32 | 3.4 | 5.3 |
| iPTF15dmn | 12.003 0.025 | 43 | 11.584 0.024 | 46 | 8.042 0.024 | 44 | 0.68 |
| iPTF15dmu | 13.767 0.025 | 44 | 13.433 0.032 | 33 | 9.441 0.034 | 32 | 1.1 |
| iPTF15dni | 10.652 0.022 | 49 | 10.590 0.020 | 55 | 7.472 0.018 | 61 | 0.86 |
| iPTF15fgl | 15.128 0.034 | 32 | 14.771 0.058 | 19 | 10.826 0.088 | 12 | 1.5 |
| iPTF15fhl | 15.010 0.053 | 21 | 14.766 0.084 | 13 | 12.456 0.466 | 2.3 | 5.7 |
4.3. Optical properties
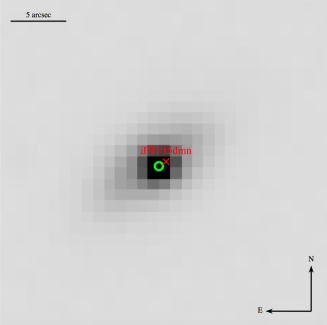
Our iPTF follow-up observations point toward an AGN nature of the transients iPTF15dmn and iPTF15dni (see Kasliwal et al., in prep.). The presence of an AGN in iPTF15dmn is suggested by the optical variability and nuclear origin observed during our iPTF follow–up. A pre-outburst optical spectrum of iPTF15dmn host by the 6dF galaxy redshift survey (Baldwin et al., 1981; Jones et al., 2004) reveals broad H emission, and a large [N II] to H emission line ratio in the narrow lines galaxy emission component, that also point toward the presence of an AGN in this galaxy (Baldwin et al., 1981). Optical spectroscopy of iPTF15dni obtained after the GW trigger reveals a similar pattern of broad H emission and strong narrow emission lines of [N II] and O III (Kasliwal et al., in prep.). The spectrum is contaminated by significantly stronger stellar continuum; however, we consider it quite likely that an AGN is present in this case as well.
It is interesting to note that neither iPTF15dni nor iPTF15dmn appear in the locus of AGN based on their radio emission or WISE colors (Figs. 4 and 5). The fact that iPTF15dni and iPTF15dmu are not classified as AGN for their radio emission is not surprising. Indeed, Stern et al. (2012) have shown that because deep radio data detect emission related to stellar processes (e.g., supernova remnants) as well as AGN activity, of WISE-selected AGN candidates are expected to have radio matches. However, only of WISE-selected AGN with spectroscopic redshifts are radio loud according to the criteria shown in Figure 4. On the other hand, one possibility (suggested by our spectra of iPTF15dni) for the lack on WISE color indication of AGN activity in iPTF15dni and iPTF15dmn is that the AGN emission is relatively weak (compared to the stellar continuum), and so accretion onto the central super-massive BH may not significantly impact the infrared colors of such galaxies. Regardless of the actual reason for this observed phenomenon, it is clear that WISE color or radio brightness cuts cannot be used exclusively to rule out an AGN origin for future radio transient follow-up.
5. Radio sources in the Fermi/LAT transient error circle
Our RMS sensitivity in the VLA follow-up observations of the Fermi/LAT transient identified in the error region of G194575 (see Sections 2-3) was mJy at GHz during the first epoch (which was used to extract sources; Fig. 2). Close proximity to the Sun, RFI in S-band, and short integration times ( min), made our sensitivity much worse than the Jy sensitivity reached in the VLA follow-up of iPTF transients. For comparison, the RMS of the VLA FIRST survey was mJy at 1.4 GHz (Becker et al., 1995) and thus, unsurprisingly, almost all radio sources found in the fields (see Table 7) are also previously cataloged radio sources (Becker et al., 1995).
Three radio sources identified in the error region of the possible Fermi/LAT transient (Fermi 6, 12, and 17) do not have a clear match (i.e., a match within the estimated position errors) in the NASA/IPAC Extragalactic Database (NED)777The NASA/IPAC Extragalactic Database (NED) is operated by the Jet Propulsion Laboratory, California Institute of Technology, under contract with the National Aeronautics and Space Administration.. These sources all have 3 GHz peak fluxes mJy, that imply a 1.4 GHz flux below the detection limit of VLA FIRST if we assume a self-absorbed spectral index of . None of these sources show any significant variation in their radio fluxes over the timescales of our follow-up.
6. Conclusion and future prospects
During O1 we have demonstrated our ability in carrying out a well-coordinated multi-band follow-up of Advanced LIGO triggers. We have followed-up 16 iPTF optical transients out of which 7 showed a significant nearby radio excess associated with host galaxy radio emission. There were two stripped envelope (Type Ib/c) SNe, and one Type Ibn SN among the iPTF transients with a nearby radio detection. Based on the absence of significant variability in the detected radio fluxes, on the radio spectral indices, and on the SFRs derived by combining our VLA data with the redshift information provided by optical observations, we found that the all of the detected radio excesses are consistent with star forming regions or AGN activity, as also confirmed by WISE colors. We have tested our capabilities for the follow-up of the error regions of Fermi/LAT candidates that are too close to the Sun to be accessible to optical or X-ray facilities. In the future, this strategy may also be useful to detect radio counterparts to high energy transients hidden in dusty environments which may not be detectable via optical observations. Multiple sources were detected within the region that was observed, most of which were previously cataloged radio sources. None of these sources showed any variability between the two epochs of our observations.
The second observing run (O2) of Advanced LIGO is scheduled to start in 2016, and expected to reach horizon distances of Mpc for binary NS mergers (Abbott et al., 2016g). For O2, the hope is to detect at least one compact binary with a NS. Advanced Virgo should also come online towards the end of O2, and with a third detector the error areas of NS-NS mergers should be reduced to 200 (Singer et al., 2014). For O2, our team has a VLA program already in place to follow–up iPTF-identified transients in Advanced LIGO error regions. (We also have an approved Swift/XRT GI program to follow-up the five most promising iPTF candidates, with observations that will go deeper than the NASA-led Swift/XRT program aimed at tiling the LIGO error regions; see Evans et al. (2016)).
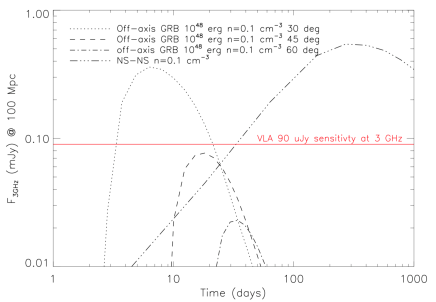
Recent studies (Chu et al., 2016; Hotokezaka et al., 2016) have investigated the likelihood of a radio detection from NS-NS and BH-NS mergers, and find that a large fraction of binary NS mergers occurring in realistic density environments are detectable with the VLA (Fig. 6). AGN variability, which may take place over days–year long timescales (Mooley et al., 2016, 2013; Valtaoja et al., 1992), could represent a source of false positives for the radio follow-up of GWs. However, as we have demonstrated in this study, combining radio observations with optical and mid-IR ones will likely identify AGN-associated variability. The VLA Sky Survey will also provide soon crucial information about the variability of the radio sky in the GHz range at the 120 Jy level 888https://science.nrao.edu/science/surveys/vlass.
With plans for commissioning of the Zwicky Transient Facility in 2017 with a 47 deg2 camera, future optical transient searches will be faster and more sensitive (Kasliwal et al., 2016). Moreover, with KAGRA and LIGO India expected to join the global network in the future, the GW error areas of NS-NS systems will be reduced to tens of deg2, and EM follow-ups will become much easier (Abbott et al., 2016g; Aso et al., 2013; Nissanke et al., 2011). As Advanced LIGO reaches its nominal sensitivity, GW emission from core-collapse events may also come into reach (Fryer et al., 2002), although given the complexity of core-collapse progenitor models, equations of state, and explosion physics, the expected rates for these type of signals are highly uncertain.
EM detections of GWs will provide orders of magnitude better localization, increase the confidence in low significance GW detections, and help constrain source parameters and populations properties. In summary, the science returns of the radio follow-up of GWs are expected to be immense. With the iPTF/ZTF and the VLA working in coordination with the advanced ground-based GW detectors, exciting discoveries are soon to revolutionize our view of the transient sky.
| Field | source n. | VLA epoch | VLA flux | RA Dec | Cen. dist. | VLA pos. err. | NED offset | NED pos. err. | Type | |
| (MJD) | (day) | (mJy beam-1) | (hh:mm:ss dd:mm:ss) | (arcmin) | (arcsec) | (arcsec) | (arcsec) | |||
| LAT0 | Fermi 1 | 57331.9 | 14 | 14:46:20.366 -03:18:08.46 | 6.9 | 0.18 | 2.7 | 1.9 | RadioS | |
| ” | ” | 57339.8 | 22 | – | – | – | – | – | ” | |
| ” | Fermi 2 | 57331.9 | 14 | 14:46:53.941 -03:11:27.01 | 4.3 | 0.14 | 1.5 | 1.9 | RadioS | |
| ” | ” | 57339.8 | 22 | – | – | – | – | – | ” | |
| ” | Fermi 3 | 57331.9 | 14 | 14:46:14.509 -03:19:28.80 | 8.8 | 1.5 | 1.3 | 2.1 | RadioS | |
| ” | ” | 57339.8 | 22 | – | – | – | – | – | ” | |
| ” | Fermi 4 | 57331.9 | 14 | 14:46:57.834 -03:14:08.05 | 3.3 | 1.2 | 8.8 | 13 | RadioS | |
| ” | ” | 57339.8 | 22 | — | – | – | – | ” | ||
| ” | Fermi 5 | 57331.9 | 14 | 14:46:15.028 -03:20:46.17 | 9.4 | 1.2 | 0.9 | 3.2 | RadioS | |
| ” | ” | 57339.8 | 22 | – | – | – | – | – | ” | |
| ” | Fermi 6 | 57331.9 | 14 | 14:46:40.350 -03:16:27.08 | 1.8 | 2.6 | 39 | 3.1 | UvS | |
| ” | ” | 57339.8 | 22 | – | – | – | – | – | ” | |
| ” | Fermi 7 | 57331.9 | 14 | 14:46:44.840 -03:17:58.07 | 2.7 | 3.3 | 12 | 3.1 | RadioS | |
| ” | ” | 57339.8 | 22 | – | – | – | – | – | ” | |
| LAT1 | Fermi 8 | 57331.9 | 14 | 14:47:56.718 -02:58:18.61 | 9.0 | 0.50 | 1.4 | 1.9 | RadioS | |
| ” | ” | 57339.8 | 22 | – | – | – | – | – | ” | |
| ” | Fermi 9 | 57331.9 | 14 | 14:47:48.325 -02:57:48.09 | 7.9 | 1.8 | 2.5 | 4.8 | RadioS | |
| ” | ” | 57339.8 | 22 | – | – | – | – | – | ” | |
| LAT2 | Fermi 10 | 57331.9 | 14 | 14:45:43.304 -03:05:58.19 | 5.2 | 0.33 | 1.5 | 3.3 | RadioS | |
| ” | ” | 57339.8 | 22 | – | – | – | – | – | ” | |
| ” | Fermi 11 | 57331.9 | 14 | 14:45:57.216 -03:03:37.72 | 1.3 | 0.35 | 3.3 | 4.5 | RadioS | |
| ” | ” | 57339.8 | 22 | – | – | – | – | – | ” | |
| ” | Fermi 12 | 57331.9 | 14 | 14:46:17.400 -03:04:34.76 | 3.8 | 3.1 | 34 | 2.3 | UvS | |
| ” | ” | 57339.8 | 22 | – | – | – | – | – | ” | |
| LAT3 | Fermi 13 | 57331.9 | 14 | 14:47:18.185 -03:33:50.68 | 8.7 | 1.9 | 5.0 | 3.8 | RadioS | |
| ” | ” | 57339.8 | 22 | – | – | – | – | – | ” | |
| ” | Fermi 14 | 57331.9 | 14 | 14:47:29.220 -03:16:48.32 | 8.8 | 2.7 | 4.5 | 7.8 | RadioS | |
| ” | ” | 57339.8 | 22 | – | – | – | – | ” | ||
| ” | Fermi 15 | 57331.9 | 14 | 14:47:47.990 -03:32:39.87 | 8.6 | 2.7 | 2.9 | 8.4 | RadioS | |
| ” | ” | 57339.8 | 22 | – | – | – | – | – | ” | |
| ” | Fermi 16 | 57331.9 | 14 | 14:46:57.650 -03:31:56.42 | 10 | 3.5 | 13 | 7.1 | GGroup | |
| ” | 57339.8 | 22 | – | – | – | – | – | ” | ||
| ” | Fermi 17 | 57331.9 | 14 | 14:47:13.630 -03:27:54.48 | 4.5 | 4.5 | – | – | – | |
| ” | ” | 57339.8 | 22 | – | – | – | – | – | – | |
| ” | Fermi 18 | 57331.9 | 14 | 14:47:30.900 -03:28:05.80 | 2.6 | 3.2 | 8.6 | 1.8 | UvS | |
| ” | ” | 57339.8 | 22 | – | – | – | – | – | ” | |
| LAT4 | Fermi 19 | 57331.9 | 14 | 14:45:42.387 -03:30:00.11 | 6.7 | 0.22 | 1.5 | 2.1 | RadioS | |
| ” | ” | 57339.8 | 22 | – | – | – | – | – | ” | |
| ” | Fermi 20 | 57331.9 | 14 | 14:46:00.870 -03:24:20.31 | 1.3 | 6.1 | 1.7 | 2.8 | RadioS | |
| ” | ” | 57339.8 | 22 | – | – | – | – | – | ” | |
| (” | Fermi 1 | 57331.9 | 14 | 14:46:20.592 -03:18:05.71 | 8.7 | 0.76 | 2.3 | 1.9 | RadioS) | |
| (” | Fermi 3 | 57331.9 | 14 | 14:46:14.750 -03:19:27.39 | 6.8 | 3.1 | 2.8 | 2.1 | RadioS) | |
| (” | Fermi 5 | 57331.9 | 14 | 14:46:15.050 -03:20:44.73 | 5.8 | 3.0 | 1.1 | 3.2 | RadioS) |
References
- Abadie et al. (2010) Abadie, J., Abbott, B. P., Abbott, R., et al. 2010, Classical and Quantum Gravity, 27, 173001
- Abbott et al. (2016a) Abbott, B. P., Abbott, R., Abbott, T. D., et al. 2016a, Phys. Rev. Lett., 116, 131103
- Abbott et al. (2016b) Abbott, B. P., Abbott, R., Abbott, T. D., et al. 2016b, Phys. Rev. Lett., 116, 061102
- Abbott et al. (2016c) Abbott, B. P., Abbott, R., Abbott, T. D., et al. 2016c, ApJ, 826, 13
- Abbott et al. (2016d) Abbott, B. P., Abbott, R., Abbott, T. D., et al. 2016d, Phys. Rev. Lett., 116, 241103
- Abbott et al. (2016e) Abbott, B. P., Abbott, R., Abbott, T. D., et al. 2016e, Phys. Rev. Lett., 116, 241102
- Abbott et al. (2016f) Abbott, B. P., Abbott, R., Abbott, T. D., et al. 2016f, eprint arXiv:1606.04856
- Abbott et al. (2016g) Abbott, B. P., Abbott, R., Abbott, T. D., et al. 2016f, Living Reviews in Relativity, 19, 1
- Adriani et al. (2016) Adriani, O., Akaike, Y., Asano, K., et al. 2016, arXiv:1607.00233
- Aso et al. (2013) Aso, Y., Michimura, Y., Somiya, K., et al. 2013, Phys. Rev. D, 88, 043007
- Baldwin et al. (1981) Baldwin, J. A., Phillips, M. M., & Terlevich, R. 1981, PASP, 93, 5
- Barnes & Kasen (2013) Barned, & J., Kasen, 2013, ApJ, 775, 18
- Becker et al. (1995) Becker, R. H., White, R. L., & Helfand, D. J. 1995, ApJ, 450, 559
- Berger (2010) Berger, E. 2010, ApJ, 722, 1946
- Berger (2014) Berger, E. 2014, ARA&A, 52, 43
- Blandford & Znajek (1977) Blandford, R. D., & Znajek, R. L. 1977, MNRAS, 179, 433
- Bowman et al. (2013) Bowman, J. D., Cairns, I., Kaplan, D. L., et al. 2013, PASA, 30, e031
- Bruzual & Charlot (2003) Bruzual, G.; & Charlot, S. 2003, MNRAS, 344, 1000
- Calzetti et al. (2000) Calzetti, D., Armus, L., Bohlin, R. C., Kinney, A. L., Koornneef, J., Storchi-Bergmann, T. 2000, ApJ, 533, 682
- Cavalier et al. (2006) Cavalier, F., Barsuglia, M., Bizouard, M.-A., et al. 2006, Phys. Rev. D, 74, 082004
- Cenko et al. (2015) Cenko, S. B. 2015, GRB Coordinates Network, 18762, 1
- Chu et al. (2016) Chu, Q., Howell, E. J., Rowlinson, A., et al. 2016, MNRAS, 459, 121
- Condon (1992) Condon, J. J. 1992, ARA&A, 30, 575
- Condon et al. (1998) Condon, J. J., Cotton, W. D., Greisen, E. W., et al. 1998, AJ, 115, 1693
- Connaughton et al. (2016) Connaughton, V., Burns, E., Goldstein, A., et al. 2016, ApJ, 826, L6
- Copperwheat et al. (2016) Copperwheat, C. M., Steele, I. A., Piascik, A. S., et al. 2016, arXiv:1606.04574
- Corsi et al. (2014) Corsi, A., Ofek, E. O., Gal-Yam, A., et al. 2014, ApJ, 782, 42
- Corsi et al. (2016) Corsi, A., Gal-Yam, A., Kulkarni, S. R., et al. 2016, ApJ, 830, 42
- Cowperthwaite et al. (2016) Cowperthwaite, P. S., Berger, E., Soares-Santos, M., et al. 2016, arXiv:1606.04538
- Evans et al. (2016) Evans, P. A., Kennea, J. A., Palmer, D. M., et al. 2016, arXiv:1606.05001
- Fairhurst (2011) Fairhurst, S. 2011, Classical and Quantum Gravity, 28, 105021
- Frail et al. (2000) Frail, D. A., Waxman, E., & Kulkarni, S. R. 2000, ApJ, 537, 191
- Fryer et al. (2002) Fryer, C. L., Holz, D. E., & Hughes, S. A. 2002, ApJ, 565, 430
- Gürkan et al. (2014) Gürkan, G., Hardcastle, M. J., & Jarvis, M. J. 2014, MNRAS, 438, 1149
- Hales et al. (2012) Hales, C. A., Murphy, T., Curran, J. R., et al. 2012, MNRAS, 425, 979
- Jin et al. (2016) Jin, Z.-P., Hotokezaka, K., Li, X., et al. 2016, Nature Communications, in press.
- Jones et al. (2004) Jones, D. H., Saunders, W., Colless, M., et al. 2004, MNRAS, 355, 747
- KamLAND Collaboration et al. (2016) KamLAND Collaboration, Gando, A., Gando, Y., et al. 2016, arXiv:1606.07155
- Kasliwal et al. (2016) Kasliwal, M. M., Cenko, S. B., Singer, L. P., et al. 2016, arXiv:1602.08764
- Kasliwal et al. (in prep.) Kasliwal, M. M. et al. in preparation
- Klimenko et al. (2011) Klimenko, S., Vedovato, G., Drago, M., et al. 2011, Phys. Rev. D, 83, 102001
- Lacy et al. (2004) Lacy, M., Storrie-Lombardi, L. J., Sajina, A., et al. 2004, ApJS, 154, 166
- Law et al. (2009) Law, N. M., Kulkarni, S. R., Dekany, R. G., et al. 2009, PASP, 121, 1395
- Li & Paczyński (1998) Li, L.-X., & Paczyński, B. 1998, ApJ, 507, L59
- LSC & Virgo (2015a) LIGO Scientific Collaboration and Virgo 2015a, GRB Coordinates Network, 18626, 1
- LSC & Virgo (2015b) LIGO Scientific Collaboration and Virgo 2015b, GRB Coordinates Network, 18442, 1
- Loeb (2016) Loeb, A. 2016, ApJ, 819, L21
- Mateos et al. (2012) Mateos, S., Alonso-Herrero, A., Carrera, F. J., et al. 2012, MNRAS, 426, 3271
- Mauch & Sadler (2007) Mauch, T., & Sadler, E. M. 2007, MNRAS, 375, 931
- Metzger & Berger (2012) Metzger, B. D., & Berger, E. 2012, ApJ, 746, 48
- Metzger & Fernandez (2014) Metzger, B. D., & Fernandez, R. 2014, MNRAS, 441, 3444
- Mooley et al. (2013) Mooley, K. P., Frail, D. A., Ofek, E. O., et al. 2013, ApJ, 768, 165
- Mooley et al. (2016) Mooley, K. P., Hallinan, G., Bourke, S., et al. 2016, ApJ, 818, 105
- Mösta et al. (2010) Mösta, P., Palenzuela, C., Rezzolla, L., et al. 2010, Phys. Rev. D, 81, 064017
- Murase et al. (2016) Murase, K., Kashiyama, K., Mészáros, P., et al. 2016, arXiv:1602.06938
- Murphy et al. (2011) Murphy, E. J. et al. 2011, ApJ,737,67
- Nakar & Piran (2011) Nakar, E., & Piran, T. 2011, Nature, 478, 82
- Nissanke et al. (2011) Nissanke, S., Sievers, J., Dalal, N., & Holz, D. 2011, ApJ, 739, 99
- Hotokezaka et al. (2016) Hotokezaka, K., Nissanke, S., Hallinan, G., et al. 2016, arXiv:1605.09395
- Ofek et al. (2013) Ofek, E. O., Fox, D., Cenko, S. B., et al. 2013, ApJ, 763, 42
- Palliyaguru et al. (2015a) N. T. Palliyaguru et al. 2015a, GRB Coordinates Network, 18420, 1
- Palliyaguru et al. (2015b) N. T. Palliyaguru et al. 2015b, GRB Coordinates Network, 18474, 1
- Palliyaguru et al. (2015c) N. T. Palliyaguru et al. 2015c, GRB Coordinates Network, 18528, 1
- Palliyaguru et al. (2015d) N. T. Palliyaguru et al. 2015d, GRB Coordinates Network, 18560, 1
- Palliyaguru et al. (2015e) N. T. Palliyaguru et al. 2015e, GRB Coordinates Network, 18584, 1
- Palliyaguru et al. (2015f) N. T. Palliyaguru et al. 2015f, GRB Coordinates Network, 18780, 1
- Palliyaguru et al. (2016a) N. T. Palliyaguru et al. 2016a, GRB Coordinates Network, 18846, 1
- Palliyaguru et al. (2016b) N. T. Palliyaguru et al. 2016b, GRB Coordinates Network, 18873, 1
- Palliyaguru et al. (2016c) N. T. Palliyaguru et al. 2016c, GRB Coordinates Network, 18914, 1
- Perna et al. (2016) Perna, R., Lazzati, D., & Giacomazzo, B. 2016, arXiv:1602.05140
- Perley et al. (2009) Perley, R., Napier, P., Jackson, J., et al. 2009, IEEE Proceedings, 97, 1448
- Perley & Perley (2013) Perley, D. A., & Perley, R. A. 2013, ApJ, 778, 172
- Racusin et al. (2016) Racusin, J. L., Burns, E., Goldstein, A., et al. 2016, arXiv:1606.04901
- Sadler et al. (1999) Sadler, E. M., McIntyre, V. J., Jackson, C. A., & Cannon, R. D. 1999, PASA, 16, 247
- Seymour et al. (2008) Seymour, N., Dwelly, T., Moss, D., et al. 2008, MNRAS, 386, 1695
- Singer et al. (2014) Singer, L. P., Price, L. R., Farr, B., et al. 2014, ApJ, 795, 105
- Singer et al. (2015a) Singer, L. 2015, GRB Coordinates Network, 18337, 1
- Singer et al. (2015c) Singer, L. 2015, GRB Coordinates Network, 18497, 1
- Smartt et al. (2016) Smartt, S. J., Chambers, K. C., Smith, K. W., et al. 2016, arXiv:1606.04795
- Smolcic et al. (2008) Smolcic, V., et al. 2008, ApJ, 177, 14
- Smolcic et al. (2016) Smolcic, V., et al. 2016, arXiv:1603.05996
- Stern et al. (2005) Stern, D., Eisenhardt, P., Gorjian, V., et al. 2005, ApJ, 631, 163
- Stern et al. (2012) Stern, D., Assef, R. J., Benford, D. J., et al. 2012, ApJ, 753, 30
- Vallisneri (2000) Vallisneri, M. 2000, Physical Review Letters, 84, 3519
- van Haarlem et al. (2013) van Haarlem, M. P., Wise, M. W., Gunst, A. W., et al. 2013, AA, 556, A2
- Valtaoja et al. (1992) Valtaoja, E., Terasranta, H., Urpo, S., et al. 1992, A&A, 254, 80
- Vianello et al. (2015) Vianello, G. 2015, GRB Coordinates Network, 18458, 1
- Weiler et al. (1986) Weiler, K. W., Sramek, R. A., Panagia, N., van der Hulst, J. M., & Salvati, M. 1986, ApJ, 301, 790
- Woosley & Bloom (2006) Woosley, S. E., & Bloom, J. S. 2006, ARA&A, 44, 507
- Woosley (2016) Woosley, S. E., 2016, ApJ, 824, 10
- Yamazaki et al. (2016) Yamazaki, R., Asano, K., & Ohira, Y. 2016, arXiv:1602.05050