Precision study of the and electromagnetic transition form-factors and of the line shape in NA60
Abstract
The NA60 experiment studied low-mass muon pair production in proton-nucleus (p-A) collisions using a 400 GeV proton beam at the CERN SPS. The low-mass dimuon spectrum is well described by the superposition of the two-body and Dalitz decays of the light neutral mesons , , , and , and no evidence of in-medium effects is found. A new high-precision measurement of the electromagnetic transition form factors of the and was performed, profiting from a 10 times larger data sample than the peripheral In-In sample previously collected by NA60. Using the pole-parameterisation we find (stat.) (syst.) (GeV/)-2 and (stat.) (syst.) (GeV/)-2. An improved value of the branching ratio of the Dalitz decay is also obtained, with . Further results refer to the line shape and a new limit on interference in hadron interactions.
keywords:
Lepton Pairs, Transition form factor, Conversion decays, Rho mesonPACS:
13.85.Qk, 13.40.Gp, 13.20.-v1 Introduction
Dimuon production in proton-nucleus (p-A) interactions at SPS energies of 400 GeV ( GeV), for masses below 1 GeV/, is dominated by the two-body and Dalitz decays of the vector mesons , , and and the pseudoscalar meson . Beyond serving as a reference for the observations in ultra- relativistic heavy-ion collisions, p-A data also permit to measure important properties of the produced particles, essentially undisturbed by the nuclear medium due to the large rapidity gap between central production and the target rapidity region. The present paper reports on a new measurement of the electromagnetic transition form-factors of the and Dalitz decays, improving with a still higher precision the previous NA60 results based on peripheral In-In collisions [1]. Supplementary new information is also obtained for the branching ratio of the Dalitz decay , the line shape of the meson and possible interference effects.
Transition form factors are an important ingredient in the detailed understanding of the nature of mesons and their underlying quark and gluon structure. In this context, recent improved measurements made it possible to set new stricter constraints for theoretical models (see [2] and references therein). Independent support for further improvements of form factor data arises from the impact on the hadronic light-by-light contributions to the anomalous magnetic moment of the muon [3, 4]. In addition, the previous lack of precise measurements of the form factors was one of the main sources of systematic uncertainties in the description of low mass dilepton spectra in heavy-ion collisions, with major implications for the study of the in-medium modifications of the meson [5, 6].
In the Dalitz decays and , the mesons decay electromagnetically into a virtual photon with mass in turn converting into a lepton pair and a third body. The form factor quantifying the deviation from the point-like behaviour in pure QED [7], due to the internal electromagnetic structure of the decaying meson, is directly accessible by comparing the measured invariant mass spectrum of the lepton pairs from the Dalitz decays with the point-like QED prediction. The predictions of the Vector Meson Dominance (VMD) model for the form factors of the and mesons have been tested by the Lepton-G experiment [8, 9, 10] with pion beams, and recently by the NA60 experiment in In-In peripheral collisions [1]. The much improved results of the latter measurement confirmed the fact that the VMD model strongly underestimates the observed form factor. It should be mentioned that the transition form factor of the meson has also been measured in the complementary reaction in the mass region [8, 11]. The difficulties in describing the form factor data in the two mass regions on consistent theoretical grounds has already been noted in [8].
The precise shape of the vector meson , the main object
of strong in-medium modifications in nuclear collisions, has more recently
been of renewed interest in hadron collisions as a benchmark for any
deviations from the vacuum shape.
The need for a Boltzmann term [12] beyond the standard
description, with being an effective temperature parameter,
was experimentally confirmed for the first time by the peripheral In-In data of NA60 [1].
The large data sample collected by NA60 in p-A collisions
allows now an independent measurement of the line shape, in
another hadronic collision system which is expected to be free from
in-medium effects (as discussed in Section 3.3).
In addition, based on the same argument, new investigations of possible quantum interference effects between
the and mesons can be performed,
in the presence of a hadronic initial state. The observation of such an effect has already been reported
in collisions in the channel
[13, 14, 15, 16, 17], while
measurements in p-A collisions [18, 19, 20] are at present not conclusive.
In this paper we report on high-precision results on low mass dimuon production in p-A data, collected by the NA60 experiment at the CERN SPS at 400 GeV. The NA60 experiment accumulated a large p-A data sample for six nuclear targets: Be, Cu, In, W, Pb and U. Integrating over the targets, about 180 000 events were collected. This sample is almost a factor of 10 larger than the indium-indium peripheral data exploited in [1]. With this data, a comprehensive and detailed study of the production of the light neutral mesons has been performed in p-A collisions, providing the most precise measurement currently available for the electromagnetic transition form factors in the and decays, together with a new measurement of the branching ratio of the Dalitz decay , the study of the line shape of the meson and the investigation of quantum interference effects.
2 Apparatus and event selection
During the 2004 run, the NA60 experiment collected data with a system of nine sub-targets of different nuclear species Be, Cu, In, W, Pb and U simultaneously exposed to an incident 400 GeV proton beam. The individual target thicknesses were chosen so as to collect event samples of similar sizes for each nuclear species. The total target length was 7.5 % of an interaction length. The beam was delivered by the SPS with an intensity of protons per second in 4.8 s long bursts, every 16.8 s.
2.1 Apparatus description
A general description of the NA60 apparatus can be found for example in [21]. Here, only the specific details relevant to the setup used during the proton run are given. The produced dimuons are identified and measured by the muon spectrometer, composed of a set of tracking stations, trigger scintillator hodoscopes, a toroidal magnet and a hadron absorber. The angular acceptance is mrad, corresponding to the pseudo-rapidity range . A silicon vertex spectrometer tracks all charged particles, including the muons, before entering the absorber. During the proton run, the main components of this spectrometer were 10 pixel planes based on the ALICE sensors [22] and two pixel planes based on ATLAS sensors [23]. The two ATLAS planes can be operated with a 50 ns gate, 4 times smaller than the one required by the ALICE planes. This is particularly important because the hits in the ATLAS sensors can be effectively used to reduce the interaction pile-up: only the tracks with hits in these two planes are kept, thus discarding the ones associated to out of time hits in the ALICE sensors. In this way, while still remaining non negligible, with 2 beam-target interactions per event on top of the one giving the trigger, the interaction pile-up can be coped with by the good granularity and redundancy of the vertex tracker.
2.2 Event selection, background and Monte Carlo simulations
The muon tracks reconstructed in the muon spectrometer are extrapolated back to the target region and matched to the tracks reconstructed in the vertex spectrometer. This is done comparing both their angles and momenta, requiring a matching less than 3. Once identified, the muons are refitted using the joint information of the muon and vertex spectrometers. These tracks will be referred to as matched muons. Muon pairs of opposite charge are then selected. The matching technique improves significantly the signal-to-background ratio and the dimuon mass resolution. The latter is 30-35 MeV/ (depending on the target) at the mass, somewhat worse than it was in the indium run ( MeV/) [1] because of the heavier absorber setup. The small residual combinatorial background (originating from and decays) is subtracted from the real data. Its shape is estimated with an event mixing technique, while its normalisation is established fixing the like-sign (LS) component from the mixing to the LS component of the direct (same-event) muon pair sample (containing no signal from correlated pairs at the SPS energies). The background accounts for less than of the integrated mass spectrum below 1.4 GeV. The comparison between the mixed and real samples, in turn, gives an average uncertainty of at most, for both the and the components; because of the low absolute level of the background and because of its smooth mass profile, this uncertainty hardly affects the results.
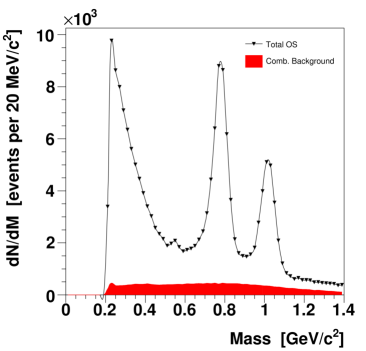
The background from fake track matches, which arises at high multiplicities from the association of a muon track to more than one track in the vertex spectrometer with an acceptable matching , is significantly lower than the combinatorial background. Its contribution is negligible in the proton-nucleus data being in any case taken into account by the overlay Monte Carlo technique adopted for the simulations, see below. The top panel of Figure 1 shows the final mass spectrum together with the combinatorial background evaluated as described above.
The electromagnetic decays of the light, neutral pseudoscalar and vector mesons (, , , and ) are the dominating processes at the lower end of the dimuon mass spectrum (below GeV/), adding to the continuous spectrum via their Dalitz decays and/or giving rise to distinct peaks via their 2-body decays. This hadronic decay cocktail was simulated with the NA60 Monte Carlo generator Genesis [24]. The input parameters for the kinematic distributions of the generated processes have been tuned by comparison with the real data, by means of an iterative procedure ensuring self-consistency to the analysis.
The rapidity distributions in the center of mass frame were generated according to the expression , similar to a Gaussian of width , where describes the empirical functional mass dependence of the width with values of about 0.5 and 0.75 at the masses of 0.14 GeV/ () and 1 GeV/, respectively [24]. This simple parameterisation has been used by several experiments, since it describes reasonably well existing measurements.
The transverse momentum spectra used in the simulations are extracted from the same p-A data set at 400 GeV on which the present paper is based. A preliminary analysis for these measurements has appeared elsewhere [25], showing in fact strong differences to the 158 GeV regime. The muon angular distributions also entering the simulations are assumed to be isotropic for the 2-body decays, while the angular anisotropies of the Dalitz decays, expected to be the same for the pseudo-scalar () and vector () mesons [26], are described by the equation [27]
| (1) |
where is the mass of the virtual photon, the mass of the muon, and the angle between the positive muon and the momentum of the parent meson in the rest-frame of the virtual photon. As was explicitly verified, the form factor data resulting from the present analysis actually are, within their statistical errors, completely immune towards the character of the angular distribution of the Dalitz decays. This is due to the fact that the anisotropy of the Dalitz decays is strongly smeared out in the laboratory frame and practically does not affect the dimuon acceptance.
For the mass line shapes of the narrow resonances , and , we used the modified relativistic Breit-Wigner parameterisation, first proposed by G.J. Gounaris and J.J. Sakurai [28], with widths and masses taken from the PDG [29]. For the broad meson we used the parameterisation [12]
| (2) |
with a mass dependent width
| (3) |
The muon mass and the pion mass were fixed to the PDG values [29], while the value of the pole mass and the temperature were optimised using the data themselves as discussed in Section 3.3. The width was set to the PDG value [29]; nevertheless, its variation has being considered as a part of the systematic tests for the measurement of the form factor, see Section 3.1.
The dimuon mass distributions of the and Dalitz decays are described by
| (4) | |||||
where the , and masses are taken from the PDG tables [29]. The form factors are expressed in the pole-parameterisation:
| (6) | |||||
| (7) |
implying a monotonic rise with divergence at a position not related to a pole of any known particle.
The semimuonic simultaneous decays from mesons produce
a smooth continuum with a maximum at around 1 GeV/. They
were simulated with PYTHIA 6.4 [30].
The Monte Carlo simulations were performed using the overlay
technique, which consists of superimposing a Monte Carlo generated muon
pair onto real events, in order to realistically simulate the underlying hadronic
event together with the detector specific behaviour. A real event is
read, chosen among the reconstructed data collected by the experiment,
containing a high-mass matched dimuon (within the mass
window) whose vertex is imposed to be the origin of the generated muon pair.
Alternatively, dimuons whose vertex has the -coordinate determined with an uncertainty
smaller than 3 mm were also used. This second choice, applying weaker
conditions on the vertex candidates, has been considered for
systematic checks in the analysis. The muon pair produced in the
simulation is tracked through the NA60 apparatus, using
GEANT3 [31]. Starting from the ensemble of simulated and real hits, the events
in which a muon pair gave rise to a trigger were reconstructed using
the same reconstruction settings used for the real data. To make the
MC simulation as realistic as possible, the MC tracks leave a signal
in a given pixel plane with a probability proportional to the plane
efficiency as estimated from the analysis of the real data.
3 Analysis and results
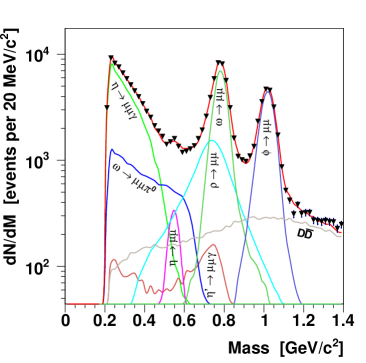
All the results presented in this paper are obtained through an iterative analysis of the dimuon mass spectrum, defined as the signal resulting after subtraction of the combinatorial background. The bottom panel of Figure 1 shows how the mass spectrum is described by the hadronic cocktail fit at the last stage of the iterative procedure, with all the parameters extracted from the data set to their final values.
The fit performed in terms of the superposition of the MC processes satisfactorily describes the profile of the observed mass spectrum. Any possible interference effect is neglected here, as will be justified in Section 3.4. The contribution of the Dalitz decay accounts for a very small fraction of the total dimuon yield; for this reason, and because of its continuum shape having no dominant structure apart from the broad peak at the mass (due to the contribution of the to the form factor), the fit to the reconstructed mass spectrum is not sensitive to this contribution, and the ratio was fixed to 0.12 [24, 32]. All the other processes have their normalisations free.
3.1 and Dalitz decay transition form factors
The parameters optimised by the fit to the dimuon mass spectrum fix the level of each process contributing to the MC cocktail. Using these normalisations, we now isolate the Dalitz decays of the and mesons and the two-body decay of the by subtracting all the other sources. The is retained, even if not directly involved in the measure of the electromagnetic form factors, in order to better control the systematics related to the small contribution of its low-mass tail in the mass region of interest here ( GeV/). The present analysis thus isolates the Dalitz decays of the and mesons by means of an inclusive measurement of the dimuon invariant mass, without the identification of the third body. Nonetheless, this approach provides reliable and remarkably precise results on the transition form factors, thanks to the large available statistics, which ensures a good control of the competing dimuon sources.
The resulting mass spectrum is corrected for the effects of geometrical acceptance and reconstruction efficiency [33, 34]. In order to do so, we build a correction profile as a function of mass, weighting the profiles obtained from the MC simulation for each of the three processes separately, according to the observed yields in each mass bin.
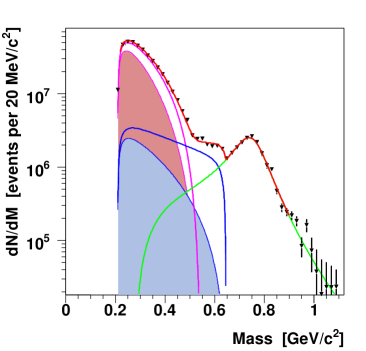

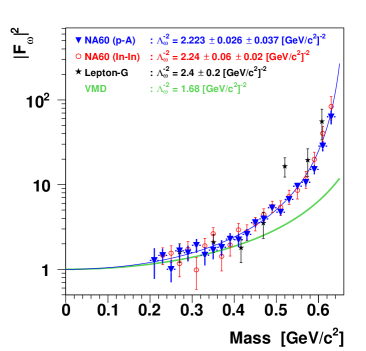
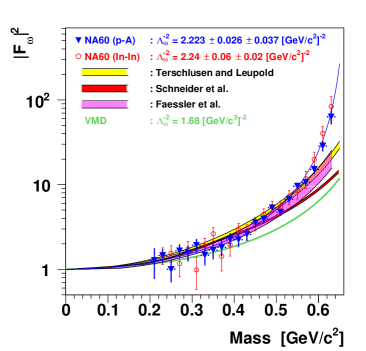
Figure 2 shows the fit of the acceptance- and efficiency-corrected mass spectrum (black triangles) with the superposition of the processes , and , represented by the solid lines. In the fit, the three normalisations are left free (one for each of the line shapes involved) together with the parameters and , contained in the form factors and .
Several systematic checks have been performed to test the stability of the results and estimate their systematic uncertainties, including the contribution from the subtraction of the known sources from the invariant mass spectrum. They can be summarised as follows: (i) change of the weighted acceptance by varying the Dalitz branching ratio relative to by ; (ii) change of the fit range of the acceptance-corrected mass spectrum; (iii) change of the ratio including the extreme scenarios and 4.8, covering 0% and 400% of the reference value ; (iv) scaling the level of the combinatorial background by a factor between 66% and 166% of the reference level, fixed by the comparison with the like-sign component of the real data; (v) considering stricter cuts on the matching for the single muons, namely and in addition to the nominal selection . The normalisation of the small open charm contribution is left free, and the fit maximises its contribution in the mass region between 1.2 and 1.4 GeV/. In doing so, the estimation of the open charm level is biased by the fact that the Drell-Yan process, which does not give any appreciable contribution below 1 GeV/ while contributing above, is neglected. In order to study the corresponding systematic effect, we scaled the open charm process down to 60% and even 0% of the level optimised by the fit to the raw mass spectrum.
The resulting values for the and parameters are (stat.) (syst.) (GeV/)-2 and (stat.) (syst.) (GeV/)-2. These results are in very good agreement with the corresponding values obtained by the analysis of the NA60 peripheral In-In data [1] (stat.) (syst.) (GeV/)-2 and (stat.) (syst.) (GeV/)-2, as well as with the Lepton-G results [8, 9, 10]. For the form factor of the meson, an excellent agreement is also found with the recent results of the A2 Collaboration at MAMI in the dielectron channel [35].
Once the final fit parameters and their errors are fixed, the contributions of the and processes are disentangled, making it possible to present the two form factors as a function of the dimuon mass as shown in Figure 3. In a first step, we isolate the individual Dalitz contributions in the spectrum of Figure 2, subtracting the contribution of the decay and disentangling the and decays as determined by the fit. The same individual data points are used for the and the , subtracting for the the fit results of the and vice versa. Since for by the definition of , the QED and the form factor parts can be separately assessed for each process. This allows us, in a second step, to obtain the squared form factors by dividing the data for the respective Dalitz decay by its point-like QED part. The pole parameters and their errors as obtained from the combined fit to both Dalitz decays (Figure 2) are reported in Figure 3. The first two panels of Figure 3 also include the NA60 data points obtained in peripheral In-In [1], the Lepton-G data [8, 9, 10], the expectations from VMD for comparison and, for the meson, the data points from the recent measurement by the A2 Collaboration. Despite the much reduced errors, the form factor of the is still close to the expectation from VMD. The form factor of the , on the other hand, strongly deviates from the VMD expectation, showing a relative increase close to the kinematic cut-off by a factor of . The corresponding data points are also reported in Tables 1 and 2.
It should be noted that, in isolating the two form factors, the systematic uncertainties of the pole mass, the and the parameters of the line shape have been taken into account and properly propagated to the final points shown in Figure 3. Negligible for masses below GeV/, this combined source of systematic uncertainty was found to be as large as one half of the statistical uncertainty near the kinematic cut-off of the form factor. Further details on the line shape as used here, including the seeming absence of any in-medium effects on the distorting the shape, will be discussed in the dedicated Section 3.3 below. Other line shapes will also be discussed there, proving a remarkable robustness of the high-mass data points of the form factor to the line shape variations.
The extraction of the form factor has also been proven to be robust with respect to the pole parameterisation underlying the fit procedures shown in Figs. 1 and 2. Since the steep mass dependence of the data points in Figure 3 and its perfect description by the fit is suggestive for a pole not far above the kinematic limit of the Dalitz decay, an alternative parameterisation freezing the pole at the nominal position while allowing shapes very different from VMD was investigated as an alternative. The results were striking: satisfactory fits to the data in Figure 2 were plainly impossible, while the deduced form factor data points in Figure 3 were absolutely immune to the bad fits in Figure 2.
It was also specifically verified that the monotonic rise of the eta and form factors up to the last points, close to the very steep fall-off at the kinematic limits of their corresponding Dalitz decays, cannot, by any means, be ascribed to an interplay between the finite mass resolution of the detector and the steepness of the dimuon invariant mass distribution in the considered mass regions. The quantitative understanding of the mass resolution of the detector is best illustrated in the bottom panel of Figure 1, showing excellent agreement between the data and the MC fit in the most sensitive peak regions of the and the , with values of about 1.2 and 1.1 averaged over the uppermost 7 points, respectively.
In the bottom panel of Figure 3, the measured mass distribution of the muon pair in the decay is compared to three recent calculations described in [36, 37], [38] and [39, 40, 41]. As can be seen, all theoretical predictions show good agreement with the data up to GeV/, but fail to describe the data points close to the upper kinematical boundary, . Referred to the results reported in this paper, the discrepancy is much larger than the total (statistical plus systematic) errors of the data. Another theoretical approach is described in [42]. In this case, however, calculations are limited to masses below GeV/ and the corresponding prediction is not shown here.
| Mass [GeV/c2] | |||
|---|---|---|---|
| Mass [GeV/c2] | Syst. Tot. | Syst. | Syst. | |||
|---|---|---|---|---|---|---|
| 1.27 | 0.50 | 0.01 | 0.9 % | 0.5 % | 0.5 % | |
| 1.46 | 0.29 | 0.01 | 0.9 % | 0.3 % | 0.4 % | |
| 1.00 | 0.29 | 0.01 | 0.5 % | 0.4 % | 0.2 % | |
| 1.66 | 0.31 | 0.01 | 0.6 % | 0.1 % | 0.3 % | |
| 1.57 | 0.33 | 0.01 | 0.4 % | 0.1 % | 0.2 % | |
| 1.92 | 0.35 | 0.01 | 0.7 % | 0.1 % | 0.3 % | |
| 1.47 | 0.36 | 0.01 | 0.3 % | 0.2 % | 0.1 % | |
| 1.69 | 0.37 | 0.01 | 0.2 % | 0.1 % | 0.1 % | |
| 1.82 | 0.38 | 0.01 | 0.4 % | 0.3 % | 0.2 % | |
| 2.28 | 0.40 | 0.01 | 0.6 % | 0.2 % | 0.3 % | |
| 2.24 | 0.40 | 0.02 | 0.7 % | 0.5 % | 0.4 % | |
| 2.59 | 0.41 | 0.03 | 1.2 % | 0.6 % | 0.6 % | |
| 3.56 | 0.42 | 0.05 | 1.5 % | 0.6 % | 0.8 % | |
| 3.93 | 0.42 | 0.08 | 1.9 % | 0.8 % | 1.0 % | |
| 5.33 | 0.45 | 0.12 | 2.3 % | 0.8 % | 1.2 % | |
| 4.73 | 0.42 | 0.14 | 3.0 % | 1.4 % | 1.7 % | |
| 6.69 | 0.54 | 0.22 | 3.2 % | 1.4 % | 1.8 % | |
| 9.59 | 0.76 | 0.33 | 3.5 % | 1.4 % | 1.9 % | |
| 10.6 | 1.0 | 0.47 | 4.4 % | 2.0 % | 2.4 % | |
| 15.1 | 1.6 | 0.82 | 5.4 % | 2.5 % | 3.0 % | |
| 28.6 | 3.4 | 1.8 | 6.2 % | 2.6 % | 3.4 % | |
| 63.1 | 9.9 | 5.9 | 9.4 % | 3.9 % | 5.0 % | |
3.2 The branching ratio
The branching ratio for the decay was measured in the same analysis, leaving free the Dalitz normalisation relative to the two-body decay in the fit of the low mass dimuon spectrum (Figure 1). Due to the rather small acceptance at low for the Dalitz process, the measurement has also been performed for GeV/ as a further systematic check; the difference between the -integrated value and the value for GeV/ is %. The final result of the branching ratio is . Within one standard deviation, this value is in agreement with that obtained in the analysis of the peripheral In-In data: and compatible with the current value listed in the PDG [29] , which is based on the NA60 measurement in peripheral In-In and on the older Lepton-G value.
The branching ratio can alternatively be obtained by integrating Eq. (5) over the allowed kinematic region . This procedure, based on the knowledge of the branching ratio according to the PDG [29] together with the present results of the omega form factor, leads to a value of , where the cited uncertainty combines the statistical and systematic uncertainties on and the uncertainty on . There is fair agreement between the two approaches on the level of 2 , within the combined statistical and systematic uncertainties.
3.3 meson line shape
As already discussed, the value of the pole mass considered in the present analysis was found by means of a fit to the data. A direct determination of the pole mass was preferred in this case, due to the dependence of its value on the specific parameterisation chosen for the line shape. The determination of has thus been performed by minimising the of the fit to the low-mass spectrum, resulting in a pole mass of MeV/. The uncertainty is the width of the curve around its minimum for .
The Boltzmann factor of the line shape in Eq. (2), containing the effective temperature , is a central part of the overall phase space description. It flattens the low-mass tail, but in particular strongly steepens the high-mass tail, so that the slow fall-off of the broad Lorentzian does not continue forever. As demonstrated by the fit to the acceptance- and efficiency-corrected mass spectrum in Figure 2, this factor is essential in the description of the even in elementary hadronic collisions. When is left as a free parameter, the value MeV is found, in agreement with the value MeV measured in peripheral In-In [1]. It is also consistent with the Hagedorn temperature of 160-170 MeV, obtained by statistical model fits of particle ratios in elementary hadron interactions and adopted in the Monte Carlo simulation for the present analysis. This is the first measurement of this parameter of the line shape in p-A collisions.
For the width , an optimised value of MeV was found when leaving this parameter free in the fit. This value is compatible with the PDG one [29] MeV considered in the rest of the analysis.
The perfect fit of the line shape Eq. (2) as visible in Figure 2 raises the question on the seeming absence of any noticeable broadening of the by in-medium effects within the given errors. While such effects strongly appear in A-A collisions, due to the creation of a hot and dense medium embedding the rho, the situation for p-A interactions is very sensitive to the beam-energy scale. While at energies of the order of a few GeV cold nuclear matter effects do exist, p-A interactions at 400 GeV are expected to be essentially free from them, on simple kinematic grounds. The leading proton in the laboratory frame has a rapidity of about 6, while the cold target nucleus is left behind at rapidities around 0, except for a few hit nucleons tailing up to at most mid-rapidity. Therefore, there is no cold medium to speak of at mid-rapidity, where particle production is measured in this experiment (about 3-4 in the laboratory frame). On the other hand, the rapidity density of the produced particles is not much higher than in genuine pp in this region. The absence of sizeable in-medium effects under the conditions of the present experiment is therefore hardly surprising.
To shed further independent light on the sensitivity to in-medium effects of the in the present experiment, the line shapes measured at much lower energies — by the CLAS experiment at JLab in -A up to 4 GeV [43] and by the KEK-PS E325 experiment in p-A at 12 GeV [20], and published as (mutually contradicting) evidence for in-medium effects — were also used in the fits to the present data. The description was equally unacceptable for both options, with data-MC residuals far outside the data errors and the found to be as large as and for the CLAS and KEK line shapes. This sets an independent quantitative limit on possible in-medium effects of the in ultra-relativistic p-A collisions: it is far below the level observed at JLab and KEK energies. At the same time, the influence of assuming the low-energy shapes for the meson when extracting the form factor data of the Dalitz decay in the relevant mass region above 0.55 GeV/ was found to be at most at the edge of the errors shown in Figure 3, emphasising a remarkable robustness of those data points even in this most sensitive region.
3.4 interference
In the analysis described up to now, the and contributions are added incoherently to the MC cocktail describing the low mass dimuon spectrum. However, in the presence of common production mechanisms for the and mesons, quantum interference effects may occur in a decay channel common to the two particles for instance or . In this case, the interference line shape can be described as the coherent sum of the and amplitudes
| (8) |
where are the normalised and propagators, and is a complex parameter. In order to study the sensitivity of the data to any possible interference effect between the and the mesons, the analysis was repeated summing the and amplitudes coherently as described by Eq. (8), with the complex parameter expressed as .
In an analysis in which the and are summed coherently, one has to find the
best values for and , by minimising the of the fit to the low mass spectrum.
The resulting as a function of and is shown in Figure 4.
As seen from this map, two minima are present. The statistical errors of
the parameters corresponding to the minima
are obtained considering the region defined by .
In this way one obtains , for the first minimum,
and , for the second.
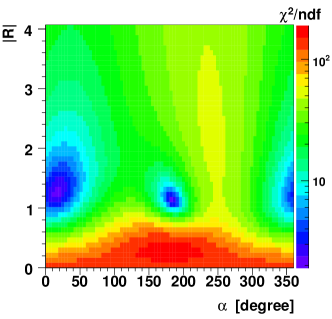
The first minimum corresponds to constructive interference, while the second to destructive interference. The data seem to rule out interference scenarios other than completely constructive or destructive. It should be noted that, given the experimental mass resolution and data errors, these interference scenarios give equivalent descriptions of the data. No significant difference was found. Given that a satisfactory description of the data can be obtained also with the incoherent sum of and contributions, we cannot make any statement on the existence of interference with parameters inside the two mentioned regions, but we can exclude it outside of these regions.
Two previous experiments tried to assess the interference effect in p-A collisions. The HELIOS/I experiment studied p-Be collisions at 450 GeV and found [18, 19]. The already cited KEK-PS E325 experiment [20] studied the decay channel in p-C and p-Cu collisions at 12 GeV and, in the attempt to describe the peak with an interference pattern, reported (no error was quoted). However, in that case the interference effect was finally disfavored to possible evidence for a mass shift of the meson.
4 Conclusions
A detailed analysis of the low mass dimuon data collected by NA60 in p-A collisions at 400 GeV has been performed. The large sample of high quality data allowed a new measurement of the electromagnetic transition form factors of the and mesons, improving by a factor 3 the precision of the previous measurement, made by NA60 in peripheral In-In collisions. The new results presented here confirm on more solid ground the discrepancy between the available predictions for the form factor of the meson and the experimental data close to the kinematic limit. The same analysis also allowed an improved measurement of the branching ratio of the Dalitz decay .
The line shape has also been studied in detail, confirming the importance of the
Boltzmann factor, for which a measure of the parameter has been performed,
for the first time in p-A collisions.
The existence of a possible interference effect has been investigated,
ruling out interference scenarios other than completely constructive or destructive.
The residual ambiguity between constructive interference, destructive interference and
incoherent superposition of and , with equivalent descriptions of the data,
could not be resolved. Given the overall quality of the comparison between data and
expected sources, no evidence is found for in-medium cold nuclear matter effects in the
region.
The authors are very grateful to B. Friman for his concise clarification of polarisation in Dalitz decays and helpful discussions on interference.
References
- [1] R. Arnaldi et al., NA60 Collaboration, Phys. Lett. B 677 (2009) 260–266, arXiv:0902.2547 [hep-ph].
- [2] E. Czerwinski, S. Eidelman, C. Hanhart, B. Kubis, A. Kupsc et al. (2012) , arXiv:1207.6556 [hep-ph].
- [3] V. Pauk and M. Vanderhaeghen, Eur. Phys. J. C 74 no. 8 (2014) 3008, arXiv:1401.0832 [hep-ph].
- [4] G. Colangelo, M. Hoferichter, B. Kubis, M. Procura, and P. Stoffer, Phys. Lett. B 738 (2014) 6–12, arXiv:1408.2517 [hep-ph].
- [5] G. Agakichiev et al., CERES Collaboration, Eur. Phys. J. C 41 (2005) 475–513, arXiv:nucl-ex/0506002.
- [6] H. J. Specht, Nucl. Phys. A 805 (2008) 338–346, arXiv:0710.5433 [nucl-ex].
- [7] N. M. Kroll and W. Wada, Phys. Rev. 98 (1955) 1355–1359.
- [8] L. G. Landsberg, Phys. Rept. 128 (1985) 301–376.
- [9] R. I. Dzhelyadin et al., Phys. Lett. B 102 (1981) 296.
- [10] R. I. Dzhelyadin et al., Phys. Lett. B 94 (1980) 548.
- [11] V. P. Druzhinin et al., Preprint INP 84-93, Novosibirsk (1984).
- [12] J. Knoll, Prog. Part. Nucl. Phys. 42 (1999) 177–186, arXiv:nucl-th/9811099 [nucl-th].
- [13] L. M. Barkov et al., Nucl. Phys. B 256 (1985) 365–384.
- [14] M. Achasov, K. Beloborodov, A. Berdyugin, A. Bogdanchikov, A. Bozhenok et al., J. Exp. Theor. Phys. 101 (2005) 1053–1070, arXiv:hep-ex/0506076 [hep-ex].
- [15] B. Aubert et al., BaBar Collaboration, Phys. Rev. Lett. 103 (2009) 231801, arXiv:0908.3589 [hep-ex].
- [16] F. Ambrosino et al., KLOE Collaboration, Phys. Lett. B 670 (2009) 285–291, arXiv:0809.3950 [hep-ex].
- [17] F. Ambrosino et al., KLOE Collaboration, Phys. Lett. B 700 (2011) 102–110, arXiv:1006.5313 [hep-ex].
- [18] R. J. Veenhof, PhD Thesis, RX-1433 (1993 AMSTERDAM).
- [19] T. Akesson et al., Z. Phys. C 68 (1995) 47–64.
- [20] M. Naruki et al., Phys. Rev. Lett. 96 (2006) 092301, arXiv:nucl-ex/0504016.
- [21] R. Arnaldi et al., NA60 Collaboration, Eur. Phys. J. C 59 (2009) 607–623, arXiv:0810.3204 [nucl-ex].
- [22] K. Wyllie et al., Prepared for 5th Workshop on Electronics for the LHC Experiments (LEB 99), Snowmass, Colorado, 20-24 Sep 1999.
- [23] M. S. Alam et al., Nucl. Instrum. Meth. A 456 (2001) 217–232.
- [24] S. Damjanovic, H. Wöhri and A. De Falco, NA60 Internal Note 2005-1.
- [25] A. Uras, NA60 Collaboration, J. Phys. G 38 (2011) 124180, arXiv:1108.0970 [hep-ex].
- [26] E. L. Bratkovskaya, W. Cassing, and U. Mosel, Z. Phys. C 75 (1997) 119–126, arXiv:nucl-th/9605025 [nucl-th].
- [27] A. Anastasi et al., KLOE-2 Collaboration (2016) arXiv:1601.06565 [hep-ex].
- [28] G. J. Gounaris and J. J. Sakurai, Phys. Rev. Lett. 21 (1968) 244–247.
- [29] K. Nakamura, Particle Data Group Collaboration, J. Phys. G 37 (2010) 075021.
- [30] T. Sjostrand, S. Mrenna, and P. Z. Skands, JHEP 05 (2006) 026, arXiv:hep-ph/0603175.
- [31] R. Brun, F. Bruyant, M. Maire, A.C. McPherson, and P. Zanarini (1987).
- [32] F. Becattini, M. Gazdzicki, A. Keranen, J. Manninen, and R. Stock, Phys. Rev. C 69 (2004) 024905, arXiv:hep-ph/0310049 [hep-ph].
- [33] S. Damjanovic, Eur. Phys. J. C 49 (2007) 235–241, arXiv:nucl-ex/0609026.
- [34] S. Damjanovic et al., NA60 Collaboration, Nucl. Phys. A 783 (2007) 327–334, arXiv:nucl-ex/0701015.
- [35] P. Aguar-Bartolome et al., A2 Collaboration, Phys. Rev. C 89 no. 4 (2014) 044608, arXiv:1309.5648 [hep-ex].
- [36] C. Terschlusen and S. Leupold, Phys. Lett. B 691 (2010) 191–201, arXiv:1003.1030 [hep-ph].
- [37] C. Terschlüsen, S. Leupold, and M. Lutz, Eur. Phys. J. A 48 (2012) 190, arXiv:1204.4125 [hep-ph].
- [38] S. P. Schneider, B. Kubis, and F. Niecknig, Phys. Rev. D 86 (2012) 054013, arXiv:1206.3098 [hep-ph].
- [39] K. Shekhter, C. Fuchs, A. Faessler, M. Krivoruchenko, and B. Martemyanov, Phys. Rev. C 68 (2003) 014904, arXiv:nucl-th/0305015 [nucl-th].
- [40] C. Fuchs, A. Faessler, D. Cozma, B. Martemyanov, and M. Krivoruchenko, Nucl. Phys. A 755 (2005) 499–502, arXiv:nucl-th/0501031 [nucl-th].
- [41] C. Fuchs, private communications.
- [42] W. Qian and B.-Q. Ma, Eur. Phys. J. C 65 (2010) 457–465, arXiv:0912.0612 [hep-ph].
- [43] R. Nasseripour et al., CLAS Collaboration, Phys. Rev. Lett. 99 (2007) 262302, arXiv:0707.2324 [nucl-ex].