11email: grazina.tautvaisiene@tfai.vu.lt 22institutetext: INAF - Osservatorio Astronomico di Bologna, Via Ranzani 1, I-40127 Bologna, Italy 33institutetext: INAF - Osservatorio Astrofisico di Arcetri - Largo Enrico Fermi 5, I-50125 Firenze, Italy
CNO abundances and carbon isotope ratios in evolved stars of the open clusters NGC 2324, NGC 2477, and NGC 3960††thanks: Based on observations collected at ESO telescopes under programmes 072.D-0550 and 074.D-0571.
Abstract
Aims. Our main aim is to determine carbon-to-nitrogen and carbon isotope ratios for evolved giants in the open clusters NGC 2324, NGC 2477, and NGC 3960, which have turn-off masses of about 2 , and to compare them with predictions of theoretical models.
Methods. High-resolution spectra were analysed using a differential synthetic spectrum method. Abundances of carbon were derived using the Swan (0,1) band heads at 5135 and 5635.5 Å. The wavelength interval 7940–8130 Å with strong CN features was analysed to determine nitrogen abundances and carbon isotope ratios. The oxygen abundances were determined from the [O i] line at 6300 Å.
Results. The mean values of the CNO abundances are (s.d.), , and in seven stars of NGC 2324; , , and in six stars of NGC 2477; and , , and in six stars of NGC 3960. The mean C/N ratio is equal to , , and , respectively. The mean ratio is equal to , , and , respectively. The and C/N ratios of stars in the investigated open clusters were compared with the ratios predicted by stellar evolution models.
Conclusions. The mean values of the and C/N ratios in NGC 2324 and NGC 2477 agree well with the first dredge-up and thermohaline-induced extra-mixing models, which are similar for intermediate turn-off mass stars. The ratios in the investigated clump stars of NGC 3960 span from 10 to 20. The mean carbon isotope and C/N ratios in NGC 3960 are close to predictions of the model in which the thermohaline- and rotation-induced (if rotation velocity at the zero-age main sequence was 30% of the critical velocity) extra-mixing act together.
Key Words.:
stars: abundances – stars: horizontal branch – stars: evolution – open clusters and associations: individual: NGC 2324, NGC 2477, and NGC 39601 Introduction
It is recognised that the first dredge-up (1DUP) is not the only mixing event during the red giant branch (RGB) ascent that alters the surface composition of a star (Chanamé et al. 2005, and references therein). There should be some form of extra-mixing that brings products of partial hydrogen burning into the stellar envelope. Many possible physical mechanisms might be involved: rotational mixing (Sweigart & Mengel 1979; Palacios et al. 2003; Chanamé et al. 2005; Denissenkov et al. 2006), magnetic fields (Hubbard & Dearborn 1980; Busso et al. 2007; Nordhaus et al. 2008; Palmerini et al. 2009), rotation and magnetic fields (Eggenberger et al. 2005), internal gravity waves (Zahn et al. 1997; Denissenkov & Tout 2000), thermohaline mixing (Eggleton et al. 2006, 2008; Charbonnel & Zahn 2007; Cantiello & Langer 2010; Charbonnel & Lagarde 2010), combination of thermohaline mixing and magnetic fields (Busso et al., 2007; Denissenkov et al., 2009), and a combination of thermohaline mixing and rotation (Charbonnel & Lagarde 2010; Lagarde et al. 2012).
The thermohaline-induced mixing is not optional (cf. Eggleton et al. 2008); it inevitably arises on the first-ascent giant branch, when the hydrogen-burning shell encroaches on the homogenized, formerly convective zone left behind by the retreating convective envelope, and begins to burn 3He. This 3He burning occurs just outside the normal hydrogen-burning shell, at the base of a radiatively stable region of about 1 in thickness. The burning causes a molecular weight inversion, which drives mixing all the way to the convection zone. It not only destroys about 90% of the 3He produced in the low-mass stars, but reduces the and C/N ratios. The rotation-induced mixing modifies the internal chemical structure of main-sequence stars, although its signatures are revealed only later in the evolution when the first dredge-up occurs. It favours the occurrence of extra mixing in RGB stars in the mass range between about 1.5 and 2.2 (cf. Charbonnel & Lagarde 2010).
In this work, we aim to determine C N O abundances and ratios for red giants in three open clusters: NGC 2324, NGC 2477, and NGC 3960. The turn-off masses of these clusters are about 2 (Sestito et al. 2006; Bragaglia et al. 2008). This mass range has previously not been well covered, therefore these clusters are suitable targets in which to study the dispersion of abundances that might be caused by rotation-induced mixing in stars of similar mass and evolutionary status. We analyse part of the same spectra as used by Sestito et al. (2006) and Bragaglia et al. (2008) in their studies.
Investigations of NGC 2324 have begun with Cuffey (1941), who built a colour-magnitude diagram and estimated a distance of about 3320 parsecs. NGC 2324 is a relatively young cluster. Kyeong et al. (2001) determined an age of about 630 Myr, a Galactocentric distance kpc, and [Fe/H] using CCD photometry and isochrone fitting. More recently, Piatti et al. (2004) used and photometry to derive an age of about 440 Myr, a distance of 3.8 kpc, reddening 0.25, and metallicity of about dex. The analysis of low-resolution spectra reported by Friel et al. (2002) provided [Fe/H]=, while the analysis of high-resolution spectra, which we use here, has been performed by Bragaglia et al. (2008) and produced [Fe/H]=.
Photometry of NGC 2477 was first made by Eggen & Stoy (1961). Hartwick et al. (1972) suggested based on further photometric observations that the metallicity of NGC 2477 is approximately 1.5 times that of the Hyades and the age is about 1.5 Gyr. Kassis et al. (1997) used deep photometry and isochrone fitting (with from Friel & Janes (1993) and reddening 0.2–0.4 from Hartwick et al. (1972) to derive an age of about 1 Gyr and kpc. Kharchenko et al. (2013) reported an approximate distance from the Sun of 1.5 kpc for this cluster and an age equal to 820 Myr. The low-resolution spectroscopy performed by Friel et al. (2002) gave . The high-resolution spectroscopic metallicity value is (Bragaglia et al. 2008).
NGC 3960 was identified by van den Bergh & Hagen (1975). Its first colour-magnitude diagram was built by Janes (1981). Prisinzano et al. (2004) investigated this cluster using filters and determined its age as between 0.9 and 1.4 Gyr. Bragaglia et al. (2006) presented photometry and derived an age of 0.6 to 0.9 Gyr from a comparison of observed and synthetic CMDs, using tracks without and with overshooting, respectively. The higher value is to be preferred; the corresponding distance modulus and reddening place the cluster at =7.4 kpc and z=220 pc above the Galactic plane. The metallicity of the cluster has been studied extensively. The photometric metallicity determinations range from (determined by Geisler et al. 1992 using Washington photometry) to dex by Piatti et al. 1998, who used photometry. Based on low-resolution spectra, Friel & Janes (1993) determined , and Twarog et al. (1997)) determined . A high-resolution spectral analysis of three stars by Bragaglia et al. (2006) resulted in , and Sestito et al. (2006) derived the mean value as from the higher signal-to-noise ratio spectra of six stars.
So far, NGC 2324, NGC 2477, and NGC 3960 had no stars with carbon, nitrogen and oxygen, and carbon isotopic ratios determined.
| Cluster | Star | log | [Fe/H] | sin | RV | |||||
| ID | K | km s-1 | km s-1 | mag | mag | mag | km s-1 | |||
| NGC 2324 | 850 | 5100 | 2.20 | 1.21 | 7.5 | 13.351 | 1.135 | 39.07 | ||
| NGC 2324 | 2603 | 4300 | 1.00 | 1.37 | 3 | 12.530 | 1.479 | 42.14 | ||
| NGC 2324 | 2225 | 5060 | 2.10 | 1.23 | 6 | 13.422 | 1.139 | 45.85 | ||
| NGC 2324 | 1006 | 5040 | 2.25 | 1.21 | 3 | 13.291 | 1.147 | 34.91 | ||
| NGC 2324 | 1992 | 4750 | 1.65 | 1.29 | 4 | 12.580 | 1.266 | 41.78 | ||
| NGC 2324 | 1788 | 5000 | 2.10 | 1.22 | 7 | 13.608 | 1.142 | 41.82 | ||
| NGC 2324 | 2027 | 5000 | 1.84 | 1.26 | 4 | 13.325 | 1.153 | 37.65 | ||
| NGC 2477 | 13385 | 4980 | 2.80 | 1.14 | 0.05 | 12.771 | 1.237 | 7.02 | ||
| NGC 2477 | 4221 | 4970 | 2.68 | 1.15 | 0.05 | 12.231 | 1.197 | 8.27 | ||
| NGC 2477 | 5035 | 5000 | 2.70 | 1.15 | 0.10 | 12.306 | 1.217 | 6.71 | ||
| NGC 2477 | 3206 | 4950 | 2.66 | 1.16 | 0.05 | 12.321 | 1.223 | 6.80 | ||
| NGC 2477 | 2061 | 5030 | 2.67 | 1.15 | 0.07 | 1.5 | 12.710 | 1.204 | 8.06 | |
| NGC 2477 | 8039 | 4970 | 2.65 | 1.16 | 0.12 | 1 | 12.320 | 1.226 | 8.18 | |
| NGC 3960 | 310755 | 4950 | 2.35 | 1.19 | 0.00 | 13.512 | 1.285 | |||
| NGC 3960 | 310756 | 5050 | 2.54 | 1.17 | 0.07 | 1.5 | 13.194 | 1.172 | ||
| NGC 3960 | 310757 | 4870 | 2.16 | 1.22 | 0.00 | 13.062 | 1.261 | |||
| NGC 3960 | 310758 | 4950 | 2.40 | 1.19 | 0.02 | 2.5 | 12.945 | 1.139 | ||
| NGC 3960 | 310760 | 5040 | 2.57 | 1.18 | 0.00 | 2.0 | 13.060 | 1.164 | ||
| NGC 3960 | 310761 | 5000 | 2.45 | 1.18 | 0.02 | 1.5 | 13.100 | 1.209 |
|
|
2 Observations and method of analysis
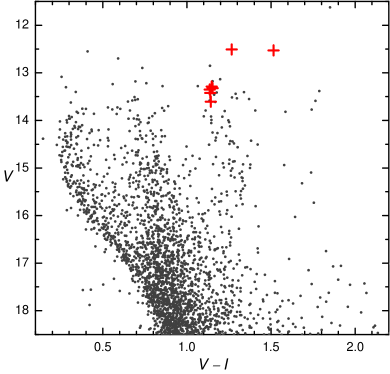
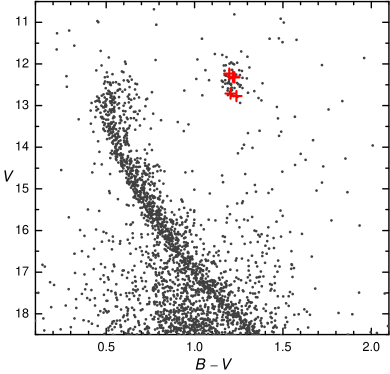
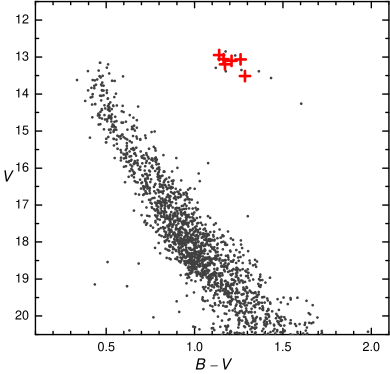
Observations were carried out with the multi-object instrument FLAMES (Fiber Large Array Multi-Element Spectrograph) on the Very Large Telescope at the European Southern Observatory, Chile (Pasquini et al. 2002). The fiber link to UVES (Ultraviolet and Visual Échelle Spectrograph, Dekker et al. 2000) was used to obtain high-resolution spectra (). Signal-to-noise ratios of the spectra were between 80 and 190, depending on stellar brightness. Details of observations and reductions are presented by Bragaglia et al. (2008) for NGC 2324 and NGC 2477, and by Sestito et al. (2006) for NGC 3960. For the analysis we used spectra of seven red clump stars of NGC 2324, and six stars of NGC 2477 and NGC 3960. Figures 1 – 3 show the colour-magnitude diagrams of the stars analysed in these clusters.
We analysed the spectra using the same differential analysis technique as in Drazdauskas et al. (2016). All calculations were differential with respect to the Sun. Solar element abundance values were taken from Grevesse & Sauval (2002). The main atmospheric parameters of the target stars were taken from Bragaglia et al. (2008) for NGC 2324 and NGC 2477, and from Sestito et al. (2006) for NGC 3960 (also adopted by Bragaglia et al. 2008), which were determined spectroscopically from the same spectra. For convenience, we present these atmospheric parameters together with photometric data in Table 1. The star NGC 2324 1788 has a slightly lower metallicity than the remaining investigated stars, which my be caused by measurement errors (this star is the faintest of the sample). The radial velocity of this star is very similar to those of other stars in NGC 2324.
Spectral synthesis was used for all abundance determinations and to calculate the ratio. The program BSYN, developed at the Uppsala University, was used for the spectral syntheses. A set of plane-parallel one-dimensional hydrostatic LTE (local thermal equilibrium) model atmospheres with constant flux were taken from the MARCS stellar model atmosphere and flux library222http://marcs.astro.uu.se/ (Gustafsson et al. 2008).
The Vienna Atomic Line Data Base (VALD, Kupka et al. 2000) was used to prepare input data for the calculations. Atomic oscillator strengths for the main spectral lines analysed in this study were taken from an inverse solar spectrum analysis (Gurtovenko & Kostyk 1989).
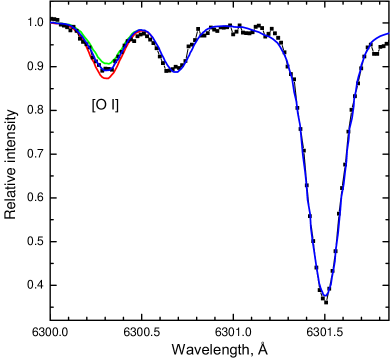
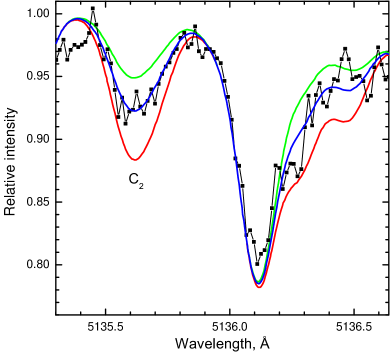
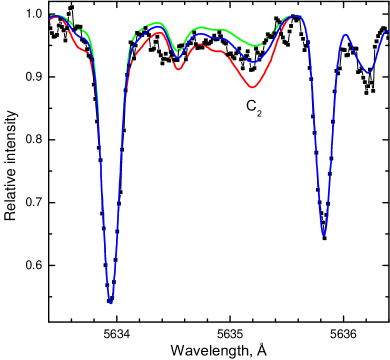
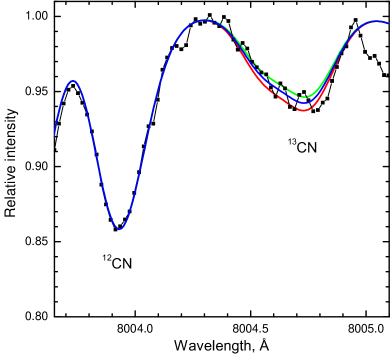
For the carbon abundance determination in all stars we used two regions: the Swan (0,1) band heads at 5135.5 Å and 5635.2 Å. We used the same molecular data of as Gonzalez et al. (1998). The oxygen abundance was derived from synthesis of the forbidden [O i] line at 6300 Å. The values for and isotopic line components, which are blended with the oxygen line, were taken from Johansson et al. (2003). The interval Å, which contains strong CN features, was used to determine the nitrogen abundance and the ratios. The ratio was obtained from the feature at 8004.7 Å. The CN molecular data for this wavelength interval were provided by Bertrand Plez.
All the synthetic spectra were calibrated to the solar spectrum by Kurucz (2005) to make the analysis differential to the Sun. An instrumental profile was adjusted using the solar spectrum observed on the same instrument as the programme stars. Line broadening by stellar rotation was taken into account for stars when necessary. The highest sin values (from 3 to 7.5 km s-1) were found for stars in the youngest open cluster in our sample, NGC 2324. We estimated the approximate rotational velocity by looking at stronger surrounding lines in spectral regions around the investigated C N O features. Our roughly estimated upper values of sin are presented together with the atmospheric parameters in Table 1. They may include some influence of macroturbulence.
| Star | [C/H] | [C/H] | [N/H] | [N/H] | [O/H] | C/N | 12C/ |
| NGC 2324 | |||||||
| 850 | 0.02 | 0.16 | 0.06 | 0.93 | |||
| 2603∗ | 0.06 | 0.08 | 0.08 | 0.89 | 22 | ||
| 2225 | 0.01 | 0.10 | 0.03 | 0.95 | |||
| 1006 | 0.02 | 0.16 | 0.04 | 0.98 | 20 | ||
| 1992∗ | 0.02 | 0.21 | 0.06 | 0.72 | 20 | ||
| 1788 | 0.06 | 0.02 | 1.12 | ||||
| 2027 | 0.04 | 0.14 | 0.06 | 0.85 | 20 | ||
| Average | 0.11 | 0.92 | |||||
| NGC 2477 | |||||||
| 13385 | 0.02 | 0.39 | 0.02 | 1.02 | 18 | ||
| 4221 | 0.01 | 0.44 | 0.01 | 0.89 | 20 | ||
| 5035 | 0.03 | 0.51 | 0.05 | 0.79 | |||
| 3206 | 0.04 | 0.49 | 0.06 | 0.05 | 0.81 | 20 | |
| 2061 | 0.01 | 0.41 | 0.06 | 1.00 | |||
| 8039 | 0.01 | 0.52 | 0.05 | 0.03 | 0.91 | 20 | |
| Average | 0.03 | 0.46 0.05 | 0.06 | 0.91 0.09 | |||
| NGC 3960 | |||||||
| 310755 | 0.02 | 0.23 | 0.05 | 1.00 | |||
| 310756 | 0.02 | 0.44 | 0.03 | 0.68 | 12 | ||
| 310757 | 0.02 | 0.31 | 0.05 | 0.66 | 10 | ||
| 310758 | 0.03 | 0.33 | 0.03 | 0.83 | 20 | ||
| 310760 | 0.01 | 0.35 | 0.02 | 0.74 | 16 | ||
| 310761 | 0.04 | 0.34 | 0.04 | 0.87 | 18 | ||
| Average | 0.05 | 0.33 0.07 | 0.07 | 0.80 0.13 |
Fitting of individual lines depends on several factors, including uncertainties on atomic parameters, continuum placement variations, and the fitting of synthetic spectra to each line. Secondly, there are errors that affect all measured lines simultaneously, such as uncertainties in the stellar atmospheric parameters. All stars are quite similar in their parameters and the quality of their spectra, therefore we chose one star (NGC 3960 310757) and calculated the effect of the assumed uncertainties of the atmospheric parameters on the abundance estimates (Table 2). Considering the given deviations from the parameters, we see that the abundances are not affected strongly. Since the CNO abundances are also bound together by molecular equilibrium in the stellar atmospheres, we also investigated the effect of an error in one of them on the abundance determination of another (Table 3).
3 Results and discussion
The abundances of carbon, nitrogen, and oxygen relative to hydrogen [El/H] (we use here the customary spectroscopic notation [X/Y]) and (the line-to-line scatter) are listed along with the C/N and 12C/13C number ratios in Table 4.
Carbon and nitrogen abundances together with C/N and ratios have been analysed in red giant stars of open clusters, globular clusters, Galactic halo and discs as indicators of mixing processes for decades (e.g. Dearborn et al. 1975; Tomkin et al. 1976; Lambert & Ries 1977, 1981; Luck 1978; Suntzeff 1981; Sneden & Pilachowski 1986; Gilroy 1989; Gratton et al. 2000; Tautvaišienė et al. 2001, 2010, 2013; Shetrone 2003; Spite et al. 2006; Smiljanic et al. 2009; Mikolaitis et al. 2010; Angelou et al. 2012; Masseron & Gilmore 2015; Drazdauskas et al. 2016, and references therein).
In Figs. 8–9 we compare our results with the modelled values of the and C/N ratios in respect of stellar turn-off masses. The mean metallicities of the clusters (Table 1) and the ages from the literature were used to compute the PARSEC isochrones (Bressan et al., 2012) and to determine turn-off masses for the target clusters. We derived a turn-off mass of with the adopted age of 440 Myr (determined by Piatti et al. 2004) for NGC 2324, with the age of 820 Myr (Kharchenko et al. 2013) for NGC 2477, and with the age of 900 Myr (Bragaglia et al. 2006) for NGC 3960.
We also included in the comparison the observational results from other studies of clump stars of open clusters (Gilroy, 1989; Luck, 1994; Tautvaišienė et al., 2000, 2005, 2015; Mikolaitis et al., 2010, 2011a, 2011b, 2012; Smiljanic et al., 2009; Santrich et al., 2013; Drazdauskas et al., 2016). To produce the average values shown in the figures, we used only red clump stars because they provide information on the final composition changes, after all the evolution along the red giant branch. The two stars lying above the clump in NGC 2324 were included in the average since their results are similar to other investigated stars.
We used the theoretical models by Eggleton et al. (2008), Charbonnel & Lagarde (2010), and Lagarde et al. (2012) for the comparison. They provide quantitative values representing the first dredge-up, thermohaline (TH), and thermohaline and rotation (TH+V) induced mixing. Eggleton et al. (2008) estimated the mixing speed with their formula for the diffusion coefficient and found that a range of three orders of magnitude in their free parameter can lead to the observed levels of . Their predicted value of the ratio for a solar-metallicity 2 star at the RGB tip is 17. A more recent model of the thermohaline-induced mixing by Charbonnel & Lagarde (2010) lists for the same stars a higher value of about 20. The model of Charbonnel & Lagarde (2010) of thermohaline instability induced mixing and the model by Eggleton et al. (2008) are both based on the ideas of Eggleton et al. (2006) and Ulrich (1972). It includes developments by Charbonnel & Zahn (2007). Eggleton et al. (2006) found a mean molecular weight () inversion in their stellar evolution model, which occurred after the so-called luminosity bump on the RGB, when the hydrogen-burning shell reaches the chemically homogeneous part of the envelope. The -inversion is produced by the reaction , as predicted in Ulrich (1972). It does not occur earlier because the magnitude of the -inversion is low and negligible compared to a stabilising -stratification. Charbonnel & Zahn (2007) computed stellar evolution models including the ideas of Kippenhahn et al. (1980), who extended Ulrich’s equations to the case of a non-perfect gas. Charbonnel & Zahn (2007) also introduced a double diffusive instability (i.e. thermohaline convection) and showed its importance in the chemical evolution of red giants. This mixing connects the convective envelope with the external wing of the hydrogen-burning shell and induces surface abundance modifications in evolved stars (Charbonnel & Lagarde 2010).
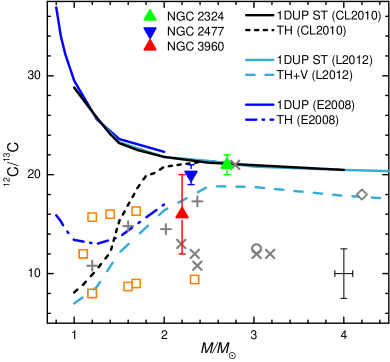
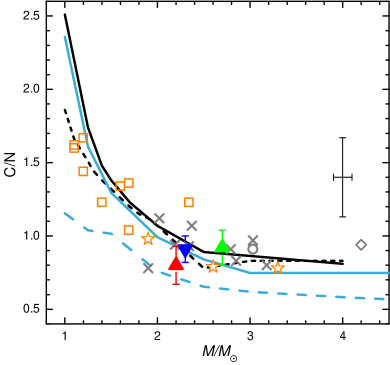
The mean values of in NGC 2324, NGC 2477, and NGC 3960 are , , and , respectively. Thus we see that the mean values of carbon isotope ratios of NGC 2324 and NGC 2477 agree well with the model of Charbonnel & Lagarde (2010) of pure thermohaline-induced mixing. NGC 3960 has the lower mean carbon isotope ratio, which is most probably also affected by rotation-induced mixing. The model that includes both thermohaline- and rotation-induced mixing (Lagarde et al. 2012) also gives . The rotation velocity in the model corresponds to 30% of the critical velocity at the zero-age main sequence (ZAMS, Lagarde et al. 2014, the rotation-induced mixing modifies the internal chemical structure of main-sequence stars, although its signatures are revealed only later in the stellar evolution).
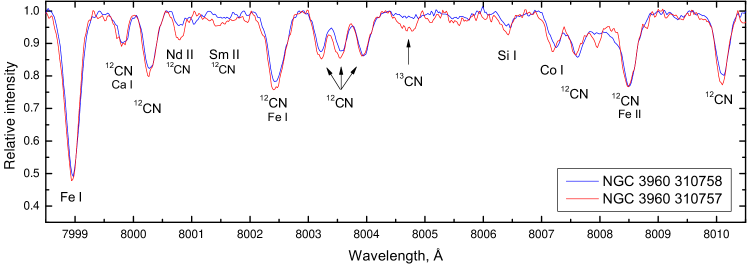
NGC 3960 is quite interesting. All the investigated stars are at the red clump stage with quite similar atmospheric parameters, but the values span from 10 to 20, and this scatter is natural. In Fig. 10 we compare a spectrum of NGC 3960 310757 with a carbon isotope ratio equal to 10 and a spectrum of NGC 3960 310758 with a value of 20. The difference in their bands is evident.
Other open clusters with intermediate turn-off masses have even lower carbon isotope ratios, which is probably due to stronger rotation-induced or other types of mixing (see Fig. 8), and the TH+V model is certainly closer to them than the pure thermohaline mixing model. It is unclear, however, why we do not see the same behaviour when comparing their C/N ratios with the corresponding theoretical models. In Fig. 9 we show the observational results lying close to the 1DUP and thermohaline mixing models, which are very similar at these turn-off masses. The mean C/N values of NGC 2324 and NGC 2477 ( and , respectively) are close to the mentioned models.
So far, the model including both thermohaline- and rotation-induced mixing (Lagarde et al. 2012) predicted lower than observed C/N ratios at all turn-off masses of open clusters, but the mean C/N ratio of NGC 3960, , is comparable with this model. In the future more open clusters may be found with C/N values as low as predicted by this model, with a ZAMS rotation velocity of 30% of the critical velocity or higher.
3.1 Oxygen
While carbon and nitrogen abundances are susceptible to the evolutionary processes that occur inside a star, oxygen, instead, is not. The abundances of oxygen remain more or less constant from the time a star forms and can be used to trace and study the Galactic chemical evolution.
| Cluster | Ref. | ||||
|---|---|---|---|---|---|
| deg | deg | kpc | kpc | ||
| Collinder 261 | 301.684 | 2.75 | 1 | 7.0 | |
| IC 4651 | 340.088 | 0.9 | 2 | 7.2 | |
| Melotte 66 | 259.559 | 4.5 | 2 | 10.0 | |
| NGC 2506 | 230.564 | 3.3 | 1 | 10.4 | |
| NGC 2324 | 213.447 | 3.8 | 3 | 11.5 | |
| NGC 2477 | 253.563 | 1.5 | 2 | 8.6 | |
| NGC 3960 | 294.367 | 2.1 | 4 | 7.4 | |
| NGC 4609 | 301.895 | 1.3 | 2 | 7.5 | |
| NGC 4815 | 303.625 | 2.5 | 5 | 6.9 | |
| NGC 5316 | 310.229 | 1.2 | 2 | 7.4 | |
| NGC 6134 | 334.917 | 1.0 | 6 | 7.1 | |
| NGC 6253 | 335.460 | 1.6 | 1 | 6.6 | |
| NGC 6705 | 27.307 | 1.9 | 7 | 6.3 |
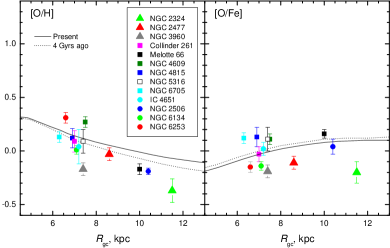
In Fig. 11 we plot the determined mean oxygen abundances with respect to Galactocentric distances. We also show the theoretical models by Magrini et al. (2009) and include other observational results of open clusters that have recently been investigated by our group (Mikolaitis et al. 2010, 2011a, 2011b, 2012; Tautvaišienė et al. 2015; Drazdauskas et al. 2016). For several open clusters we recalculated their Galactocentric distances in a homogeneous way because some of the earlier determinations were based on the solar kpc, while we decided to use = 8.0 kpc as follows from recent studies (cf. Malkin 2013; Zhu & Shen 2013). Sources of the open cluster distances from the Sun and the resulting Galactocentric distances are presented in Table 5. Our data points cover from about 6 to 12 kpc.
There is a clearly visible correlation between the [O/H] abundances and the Galactocentric distance in agreement with previous studies. There are more than a few recent studies on the oxygen abundance gradients in our Galaxy related to the Galactocentric distance (see Magrini et al. 2009; Jacobson et al. 2009; Luck & Lambert 2011; Yong et al. 2012; Korotin et al. 2014; Martin et al. 2015; Magrini et al. 2015 and references therein). All these studies agree that there is a slight decrease in the oxygen abundance with increasing Galactocentric distance.
Some authors have suggested a bimodal distribution of the oxygen abundances (Costa et al. 2004; Magrini et al. 2009; Yong et al. 2012; Korotin et al. 2014 and references therein) with a flattening starting at around 9–13 kpc from the Galactic centre. Korotin et al. (2014), for example, suggest a double linear distribution with a slope of dex kpc-1 until about kpc and a flatter one of dex kpc-1 at more distant radii. Other authors have provided a linear fit for the oxygen abundances without any apparent changes towards the outer regions of the Galaxy. The slopes vary in different studies from dex kpc-1 in Cunha et al. (2016) to dex kpc-1 in Luck & Lambert (2011) or dex kpc-1 in Rudolph et al. (2006). Our modest sample of open clusters supports studies with the larger slopes, but we cover only about 6 kpc, centred on the position of the Sun.
[O/Fe] trends are also under investigation. We see no apparent correlation of [O/Fe] with in our sample of clusters, which agrees with other studies. Jacobson et al. (2009) analysed the open clusters with around 10–13 kpc and concluded that any visible trends for the [O/Fe] versus the Galactocentric distance are most likely not real. Luck & Lambert (2011) found a modest increase in [O/Fe] (as well as increasing scatter) towards the outer regions of the Galaxy in Cepheids.
4 Summary and conclusions
We have determined CNO abundances and 12C/13C ratios in 19 evolved stars of the open clusters NGC 2324, NGC 2477, and NGC 3960, which have turn-off masses of about 2 .
Our results can be summarized as follows:
-
•
The mean values of the and C/N ratios in NGC 2324 and NGC 2477 agree well with the first dredge-up and thermohaline-induced extra-mixing models by Charbonnel & Lagarde (2010), which are similar for stars with a turn-off mass of about 2 .
-
•
The ratios in the investigated clup stars of NGC 3960 span from 10 to 20. The mean carbon isotope and C/N ratio values are close to predictions of the model in which the thermohaline- and rotation-induced (if rotation velocity at ZAMS was 30% of the critical velocity) extra-mixing act together (Lagarde et al. 2012).
-
•
The mean values of [O/H] agree with previous studies in exhibiting decreasing values with increasing Galactocentric distances. [O/Fe] show no apparent correlation with the in our sample of clusters.
Theoretical models of stellar evolution including various mechanisms of material mixing need to be continuously developed. For instance, in the model by Lagarde et al. (2012), the convective envelope was assumed to rotate as a solid body through the evolution, the transport coefficients for chemicals associated with thermohaline- and rotation-induced mixing were simply added in the diffusion equation, and the possible interactions between the two mechanisms were not considered. Wachlin et al. (2011) found that to reproduce the observed abundances of red giant branch stars close to the luminosity bump, thermohaline mixing efficiency has to be artificially increased by about four orders of magnitude from what is predicted by recent 3D numerical simulations of thermohaline convection close to astrophysical environments. Numerous shortcomings of various theoretical models were listed by Canuto (2011a, b, c, d, e). Like any new paradigm, thermohaline and other types of mixing are stimulating subsequent theoretical and observational studies.
Nevertheless, carbon and nitrogen are sensitive to evolutionary mixing processes, and an increasing number of open clusters with known CNO abundances will be useful for Galactic evolution studies as well. A recent study of Galactic field stars by Masseron & Gilmore (2015) clearly showed this.
Acknowledgements.
This research has made use of the WEBDA database (operated at the Department of Theoretical Physics and Astrophysics of the Masaryk University, Brno), of SIMBAD (operated at CDS, Strasbourg), of VALD (Kupka et al. 2000), and of NASA’s Astrophysics Data System. Bertrand Plez (University of Montpellier II) and Guillermo Gonzalez (Washington State University) were particularly generous in providing us with atomic data for CN and C2 molecules, respectively. This work was partly supported (AD, GT, RŽ) by the grant from the Research Council of Lithuania (MIP-082/2015). Partial support was received (AB, SR) from the Italian PRIN MIUR 2010-2011, project ”The Chemical and Dynamical Evolution of the Milky Way and Local Group Galaxies”.References
- Ahumada et al. (2013) Ahumada, A. V., Cignoni, M., Bragaglia, A., et al. 2013, MNRAS, 430, 221
- Angelou et al. (2012) Angelou, G. C., Stancliffe, R. J., Church, R. P., Lattanzio, J. C., & Smith, G. H. 2012, ApJ, 749, 128
- Bragaglia et al. (2008) Bragaglia, A., Sestito, P., Villanova, S., et al. 2008, A&A, 480, 79
- Bragaglia & Tosi (2006) Bragaglia, A. & Tosi, M. 2006, AJ, 131, 1544
- Bragaglia et al. (2006) Bragaglia, A., Tosi, M., Carretta, E., et al. 2006, MNRAS, 366, 1493
- Bressan et al. (2012) Bressan, A., Marigo, P., Girardi, L., et al. 2012, MNRAS, 427, 127
- Busso et al. (2007) Busso, M., Wasserburg, G. J., Nollett, K. M., & Calandra, A. 2007, ApJ, 671, 802
- Cantat-Gaudin et al. (2014) Cantat-Gaudin, T., Vallenari, A., Zaggia, S., et al. 2014, A&A, 569, A17
- Cantiello & Langer (2010) Cantiello, M. & Langer, N. 2010, A&A, 521, A9
- Canuto (2011a) Canuto, V. M. 2011a, A&A, 528, A76
- Canuto (2011b) Canuto, V. M. 2011b, A&A, 528, A77
- Canuto (2011c) Canuto, V. M. 2011c, A&A, 528, A78
- Canuto (2011d) Canuto, V. M. 2011d, A&A, 528, A79
- Canuto (2011e) Canuto, V. M. 2011e, A&A, 528, A80
- Chanamé et al. (2005) Chanamé, J., Pinsonneault, M., & Terndrup, D. M. 2005, ApJ, 631, 540
- Charbonnel & Lagarde (2010) Charbonnel, C. & Lagarde, N. 2010, A&A, 522, A10
- Charbonnel & Zahn (2007) Charbonnel, C. & Zahn, J.-P. 2007, A&A, 467, L15
- Costa et al. (2004) Costa, R. D. D., Uchida, M. M. M., & Maciel, W. J. 2004, A&A, 423, 199
- Cuffey (1941) Cuffey, J. 1941, ApJ, 94, 55
- Dearborn et al. (1975) Dearborn, D. S. P., Lambert, D. L., & Tomkin, J. 1975, ApJ, 200, 675
- Dekker et al. (2000) Dekker, H., D’Odorico, S., Kaufer, A., Delabre, B., & Kotzlowski, H. 2000, in Proc. SPIE, Vol. 4008, Optical and IR Telescope Instrumentation and Detectors, ed. M. Iye & A. F. Moorwood, 534–545
- Denissenkov et al. (2006) Denissenkov, P. A., Chaboyer, B., & Li, K. 2006, ApJ, 641, 1087
- Denissenkov et al. (2009) Denissenkov, P. A., Pinsonneault, M., & MacGregor, K. B. 2009, ApJ, 696, 1823
- Denissenkov & Tout (2000) Denissenkov, P. A. & Tout, C. A. 2000, MNRAS, 316, 395
- Drazdauskas et al. (2016) Drazdauskas, A., Tautvaišienė, G., Randich, S., et al. 2016, A&A, 589, A50
- Eggen & Stoy (1961) Eggen, O. J. & Stoy, R. H. 1961, Royal Greenwich Observatory Bulletins, 24
- Eggenberger et al. (2005) Eggenberger, P., Maeder, A., & Meynet, G. 2005, A&A, 440, L9
- Eggleton et al. (2006) Eggleton, P. P., Dearborn, D. S. P., & Lattanzio, J. C. 2006, Science, 314, 1580
- Eggleton et al. (2008) Eggleton, P. P., Dearborn, D. S. P., & Lattanzio, J. C. 2008, ApJ, 677, 581
- Friel et al. (2014) Friel, E. D., Donati, P., Bragaglia, A., et al. 2014, A&A, 563, A117
- Friel & Janes (1993) Friel, E. D. & Janes, K. A. 1993, A&A, 267, 75
- Friel et al. (2002) Friel, E. D., Janes, K. A., Tavarez, M., et al. 2002, AJ, 124, 2693
- Geisler et al. (1992) Geisler, D., Claria, J. J., & Minniti, D. 1992, AJ, 104, 1892
- Gilroy (1989) Gilroy, K. K. 1989, ApJ, 347, 835
- Gonzalez et al. (1998) Gonzalez, G., Lambert, D. L., Wallerstein, G., et al. 1998, ApJS, 114, 133
- Gratton et al. (2000) Gratton, R. G., Sneden, C., Carretta, E., & Bragaglia, A. 2000, A&A, 354, 169
- Grevesse & Sauval (2002) Grevesse, N. & Sauval, A. J. 2002, Advances in Space Research, 30, 3
- Gurtovenko & Kostyk (1989) Gurtovenko, E. A. & Kostyk, R. I. 1989, Kiev Izdatel Naukova Dumka
- Gustafsson et al. (2008) Gustafsson, B., Edvardsson, B., Eriksson, K., et al. 2008, A&A, 486, 951
- Hartwick et al. (1972) Hartwick, F. D. A., Hesser, J. E., & McClure, R. D. 1972, ApJ, 174, 557
- Hubbard & Dearborn (1980) Hubbard, E. N. & Dearborn, D. S. P. 1980, ApJ, 239, 248
- Jacobson et al. (2009) Jacobson, H. R., Friel, E. D., & Pilachowski, C. A. 2009, AJ, 137, 4753
- Janes (1981) Janes, K. A. 1981, AJ, 86, 1210
- Johansson et al. (2003) Johansson, S., Litzén, U., Lundberg, H., & Zhang, Z. 2003, ApJ, 584, L107
- Kassis et al. (1997) Kassis, M., Janes, K. A., Friel, E. D., & Phelps, R. L. 1997, AJ, 113, 1723
- Kharchenko et al. (2013) Kharchenko, N. V., Piskunov, A. E., Schilbach, E., Röser, S., & Scholz, R.-D. 2013, A&A, 558, A53
- Kippenhahn et al. (1980) Kippenhahn, R., Ruschenplatt, G., & Thomas, H.-C. 1980, A&A, 91, 175
- Korotin et al. (2014) Korotin, S. A., Andrievsky, S. M., Luck, R. E., et al. 2014, MNRAS, 444, 3301
- Kupka et al. (2000) Kupka, F. G., Ryabchikova, T. A., Piskunov, N. E., Stempels, H. C., & Weiss, W. W. 2000, Baltic Astronomy, 9, 590
- Kurucz (2005) Kurucz, R. L. 2005, Memorie della Societa Astronomica Italiana Supplementi, 8, 189
- Kyeong et al. (2001) Kyeong, J.-M., Byun, Y.-I., & Sung, E.-C. 2001, Journal of Korean Astronomical Society, 34, 143
- Lagarde et al. (2012) Lagarde, N., Decressin, T., Charbonnel, C., et al. 2012, A&A, 543, A108
- Lambert & Ries (1977) Lambert, D. L. & Ries, L. M. 1977, ApJ, 217, 508
- Lambert & Ries (1981) Lambert, D. L. & Ries, L. M. 1981, ApJ, 248, 228
- Luck (1978) Luck, R. E. 1978, ApJ, 219, 148
- Luck (1994) Luck, R. E. 1994, ApJS, 91, 309
- Luck & Lambert (2011) Luck, R. E. & Lambert, D. L. 2011, AJ, 142, 136
- Magrini et al. (2015) Magrini, L., Randich, S., Donati, P., et al. 2015, A&A, 580, A85
- Magrini et al. (2009) Magrini, L., Sestito, P., Randich, S., & Galli, D. 2009, A&A, 494, 95
- Malkin (2013) Malkin, Z. 2013, in IAU Symposium, Vol. 289, Advancing the Physics of Cosmic Distances, ed. R. de Grijs, 406–409
- Martin et al. (2015) Martin, R. P., Andrievsky, S. M., Kovtyukh, V. V., et al. 2015, MNRAS, 449, 4071
- Masseron & Gilmore (2015) Masseron, T. & Gilmore, G. 2015, MNRAS, 453, 1855
- Mikolaitis et al. (2010) Mikolaitis, Š., Tautvaišienė, G., Gratton, R., Bragaglia, A., & Carretta, E. 2010, MNRAS, 407, 1866
- Mikolaitis et al. (2011a) Mikolaitis, Š., Tautvaišienė, G., Gratton, R., Bragaglia, A., & Carretta, E. 2011a, MNRAS, 413, 2199
- Mikolaitis et al. (2011b) Mikolaitis, Š., Tautvaišienė, G., Gratton, R., Bragaglia, A., & Carretta, E. 2011b, MNRAS, 416, 1092
- Mikolaitis et al. (2012) Mikolaitis, Š., Tautvaišienė, G., Gratton, R., Bragaglia, A., & Carretta, E. 2012, A&A, 541, A137
- Nordhaus et al. (2008) Nordhaus, J., Busso, M., Wasserburg, G. J., Blackman, E. G., & Palmerini, S. 2008, ApJ, 684, L29
- Palacios et al. (2003) Palacios, A., Talon, S., Charbonnel, C., & Forestini, M. 2003, A&A, 399, 603
- Palmerini et al. (2009) Palmerini, S., Busso, M., Maiorca, E., & Guandalini, R. 2009, PASA, 26, 161
- Pasquini et al. (2002) Pasquini, L., Avila, G., Blecha, A., et al. 2002, The Messenger, 110, 1
- Piatti et al. (2004) Piatti, A. E., Clariá, J. J., & Ahumada, A. V. 2004, A&A, 418, 979
- Piatti et al. (1998) Piatti, A. E., Clariá, J. J., Bica, E., Geisler, D., & Minniti, D. 1998, AJ, 116, 801
- Prisinzano et al. (2004) Prisinzano, L., Micela, G., Sciortino, S., & Favata, F. 2004, A&A, 417, 945
- Rudolph et al. (2006) Rudolph, A. L., Fich, M., Bell, G. R., et al. 2006, ApJS, 162, 346
- Santrich et al. (2013) Santrich, O. J. K., Pereira, C. B., & Drake, N. A. 2013, A&A, 554, A2
- Sestito et al. (2006) Sestito, P., Bragaglia, A., Randich, S., et al. 2006, A&A, 458, 121
- Shetrone (2003) Shetrone, M. D. 2003, ApJ, 585, L45
- Smiljanic et al. (2009) Smiljanic, R., Gauderon, R., North, P., et al. 2009, A&A, 502, 267
- Sneden & Pilachowski (1986) Sneden, C. & Pilachowski, C. A. 1986, ApJ, 301, 860
- Spite et al. (2006) Spite, M., Cayrel, R., Hill, V., et al. 2006, A&A, 455, 291
- Suntzeff (1981) Suntzeff, N. B. 1981, ApJS, 47, 1
- Sweigart & Mengel (1979) Sweigart, A. V. & Mengel, J. G. 1979, ApJ, 229, 624
- Tautvaišienė et al. (2013) Tautvaišienė, G., Barisevičius, G., Chorniy, Y., Ilyin, I., & Puzeras, E. 2013, MNRAS, 430, 621
- Tautvaišienė et al. (2015) Tautvaišienė, G., Drazdauskas, A., Mikolaitis, Š., et al. 2015, A&A, 573, A55
- Tautvaišienė et al. (2010) Tautvaišienė, G., Edvardsson, B., Puzeras, E., Barisevičius, G., & Ilyin, I. 2010, MNRAS, 409, 1213
- Tautvaišienė et al. (2005) Tautvaišienė, G., Edvardsson, B., Puzeras, E., & Ilyin, I. 2005, A&A, 431, 933
- Tautvaišienė et al. (2000) Tautvaišienė, G., Edvardsson, B., Tuominen, I., & Ilyin, I. 2000, A&A, 360, 499
- Tautvaišienė et al. (2001) Tautvaišienė, G., Edvardsson, B., Tuominen, I., & Ilyin, I. 2001, A&A, 380, 578
- Tomkin et al. (1976) Tomkin, J., Luck, R. E., & Lambert, D. L. 1976, ApJ, 210, 694
- Twarog et al. (1997) Twarog, B. A., Ashman, K. M., & Anthony-Twarog, B. J. 1997, AJ, 114, 2556
- Ulrich (1972) Ulrich, R. K. 1972, ApJ, 172, 165
- van den Bergh & Hagen (1975) van den Bergh, S. & Hagen, G. L. 1975, AJ, 80, 11
- Wachlin et al. (2011) Wachlin, F. C., Miller Bertolami, M. M., & Althaus, L. G. 2011, A&A, 533, A139
- Yong et al. (2012) Yong, D., Carney, B. W., & Friel, E. D. 2012, AJ, 144, 95
- Zahn et al. (1997) Zahn, J.-P., Talon, S., & Matias, J. 1997, A&A, 322, 320
- Zhu & Shen (2013) Zhu, Z. & Shen, M. 2013, in IAU Symposium, Vol. 289, Advancing the Physics of Cosmic Distances, ed. R. de Grijs, 444–447