Stellar Companions to the Exoplanet Host Stars HD 2638 and HD 164509
Abstract
An important aspect of searching for exoplanets is understanding the binarity of the host stars. It is particularly important because nearly half of the solar-like stars within our own Milky Way are part of binary or multiple systems. Moreover, the presence of two or more stars within a system can place further constraints on planetary formation, evolution, and orbital dynamics. As part of our survey of almost a hundred host stars, we obtained images at 692 nm and 880 nm bands using the Differential Speckle Survey Instrument (DSSI) at the Gemini-North Observatory. From our survey, we detect stellar companions to HD 2638 and HD 164509. The stellar companion to HD 2638 has been previously detected, but the companion to HD 164509 is a newly discovered companion. The angular separation for HD 2638 is and for HD 164509 is . This corresponds to a projected separation of AU and AU, respectively. By employing stellar isochrone models, we estimate the mass of the stellar companions of HD 2638 and HD 164509 to be and , respectively, and their effective temperatures to be K and K, respectively. These results are consistent with the detected companions being late-type M dwarfs.
1 Introduction
Much of the focus in the exoplanetary field still lies in the detection of planets using a variety of techniques, such as radial velocity (RV) signatures, transits, direct imaging, microlensing, among others. A significant factor that can affect the detection of exoplanets is the binarity of the host stars. In fact, it is believed that nearly half of all sun-like stars are part of a multiple-star system (Raghavan et al., 2010). This high-rate of multiplicity has also been found in exoplanet host stars through follow-up of Kepler candidates (Everett et al., 2015; Kraus et al., 2016) and Robo-AO observations of RV exoplanet host stars (Riddle et al., 2015).
The mere presence of a binary companion can substantially affect astrometric and RV measurements of the host star, and cause severe blended contamination for transit experiments (Cartier et al., 2015; Ciardi et al., 2015; Gilliland et al., 2015). It is therefore imperative to verify the multiplicity of exoplanet host stars to ensure correct interpretation of exoplanet signals. Moreover, the binarity of the stars can place further constraints on planetary formation. Holman & Wiegert (1999) explored the orbital stability of the planets in the presence of a binary star system. Additionally, correlations between planets’ mass and their period (Zucker & Mazeh, 2002) and eccentricities (Eggenberger et al., 2004) were examined. Several binary systems have been studied, such as Centauri (Benest, 1988), Sirius (Benest, 1989), Coronae Borealis (Benest, 1996), and 30 Arietis B (Kane et al., 2015; Roberts et al., 2015), which provide us rich information on orbital dynamics in a N-body system.
This paper presents new results on stellar companions to the exoplanet host stars HD 2638 and HD 164509. The stellar companion to HD 2638 has been previously detected and characterized (Riddle et al., 2015; Roberts et al., 2015). However, this is an independent detection, and this paper shall present independent analysis of that system. In the meanwhile, the companion to HD 164509 has not been previously reported. In Section 2 we briefly describe the properties of HD 2638 and HD 164509, along with their known exoplanets. Section 3 discusses the method of detection, the range of targets that were selected for analysis, and the details of the data reduction. Section 4 presents the results from the data analysis and stellar isochrone fitting. Section 5 explains the potential implication of those findings for the planetary systems, including limits to the eccentricities of the binary companion that allow orbital stability. Section 6 provides discussion of further work and concluding remarks.
| Properties | HD 2638a, ba, bfootnotemark: | HD 164509ccGiguere et al. (2012) |
|---|---|---|
| Stellar | ||
| Spectral TypeddESA (1997) | G5V | G5V |
| ()eeBonfanti et al. (2016) | 0.87 ±0.03 | 1.10 ±0.01 |
| ()eeBonfanti et al. (2016) | 0.81 ±0.02 | 1.11 ±0.02 |
| ()eeBonfanti et al. (2016) | 0.42 ±0.01 | 1.31 ±0.02 |
| (K)eeBonfanti et al. (2016) | 5173 ±26 | 5860 ±31 |
| ()eeBonfanti et al. (2016) | 4.55 ±0.03 | 4.38 ±0.02 |
| Age (Gyr)eeBonfanti et al. (2016) | 5.1 ±4.1 | 3.2 ±0.8 |
| Fe/H | 0.16 ±0.05 | 0.21 ±0.03 |
| Apparent Magnitude mVffvan Leeuwen (2007) | 9.58 | 8.24 |
| Proper Motion (, ) (mas/yr)ffvan Leeuwen (2007) | -105.63, -223.46 | -7.40, -20.98 |
| Parallax (mas)ffvan Leeuwen (2007) | 20.03 ±1.49 | 19.07 ±0.97 |
| Distance (pc)ffvan Leeuwen (2007) | 49.93 ±3.71 | 52.44 ±2.67 |
| Planetary | ||
| () | 0.48 | 0.48 ±0.09 |
| P (Days) | 3.43752 ±0.00823876 | 282.4 ±3.8 |
| a (AU) | 0.044 | 0.875 ±0.008 |
2 Properties of the HD 2638 and HD 164509 Systems
The detailed stellar and planetary parameters of the HD 2638 and HD 164509 systems are shown in Table 1. HD 2638 is a G5V star that is about 50 pc away toward the constellation of Cetus (ESA, 1997; van Leeuwen, 2007). It is believed to be part of a wide binary system with the nearby star HD 2567. Shaya & Olling (2011) performed a Bayesian analysis of both stars’ astrometry; the result yielded 99% chance of both stars being true companions. However, Roberts et al. (2015) argued that, barring any errors in the measurement of the stars’ parallax, they are separated by 6.8 pc, making them not gravitationally bound. HD 2638 is known to host one planet, HD 2638b, with a mass of approximately 0.48 (Moutou et al., 2005). Riddle et al. (2015) discovered that HD 2638 has a stellar companion while examining the system with ROBO-AO. Roberts et al. (2015) analyzed the orbital dynamics of the primary star and the stellar companion and determined that the masses of the components are 0.87 and 0.46 , respectively. Moreover, they inferred that the spectral types are G8V and M1V and that they are separated by about 28.5 AU, giving them an orbital period of around 130 years (Roberts et al., 2015). Ginski et al. (2016) performed additional astrometric and photometric analysis on the system and found that the mass of the companion star is .
HD 164509 is a G5V star that is about 52 pc away toward the constellation of Ophiuchus (ESA, 1997; van Leeuwen, 2007). It is known to host one planet, HD 164509b, with a mass of approximately 0.48 (Giguere et al., 2012). Giguere et al. (2012), upon examining the RV data, found that it displays “a residual linear trend of m s-1 year-1, indicating the presence of an additional longer period companion in the system”. Sirothia et al. (2014) studied this system and reported a 150 MHz radio signature of mJy. The authors speculated that it could be the cause of a massive moon “orbiting a rapidly-rotating giant planet”; however, they emphasized that more analysis is needed before such a conclusion can be reached.
3 Observations and Data Reduction
Speckle observations of our target stars were obtained with the Differential Speckle Survey Instrument, or DSSI (Horch et al., 2009). This instrument was built at Southern Connecticut State University by one of us (E. H.), and currently enjoys official visitor instrument status at the Gemini-North Observatory. The observations were carried out as part of a larger survey program that aims to detect low-mass stellar companions to exoplanet host stars. Observations were carried out in July, 2014 when 60 targets were observed. Each measurement was acquired using two different passbands, one at 692 nm and another at 880 nm. The 692 nm filter has FWHM of 40 nm, and the 880 nm filter has FWHM of 50 nm. After all images underwent data reduction, they were directly examined using the ds9 program for any bright source appearing next to the target. The two particular targets described here, HD 164509 and HD 2638, were observed during the night of 2014 July 22 and 23 respectively. The results from the remainder for the survey targets will be published elsewhere.
Final reconstructed images were produced from the speckle data sequences using methods that have been described in previous papers (e.g. Horch et al., 2012, 2015), but we will briefly describe the main points here. The raw speckle data are stored as FITS data cubes consisting of 1000 frames, where each frame is a -pixel image centered on the target. Frames are bias-subtracted, and then an autocorrelation is formed. These are then summed to generate a final autocorrelation for the entire observation. We Fourier transform this to obtain the spatial frequency power spectrum of the observation. The same operations are then performed on an unresolved star (effectively a point source) that lies close on the sky to the science target. By dividing the power spectrum of the science target by that of the point source, we deconvolve the effects of the speckle statistics, and arrive at a diffraction-limited estimate of the true power spectrum of the object.
Returning to the raw data frames, we next form the image bispectrum of each frame, which is the Fourier transform of the triple correlation, as described in Lohmann et al. (1983). This data product is known to contain information that can be used to calculate the phase of the object’s Fourier transform, which we do using the relaxation algorithm of Meng et al. (1990). By taking the square root of the deconvolved power spectrum and combining it with this phase estimate, we generate a diffraction-limited estimate of the (complex) Fourier transform of the object. Finally we multiply this with a Gaussian low-pass filter of width similar to the diffraction limit of the telescope, and inverse-transform to arrive at the final reconstructed image.
 |
 |
 |
 |
 |
 |
 |
 |
Using the reconstructed images, we can study the statistics of local maxima that occur as a function of separation from the central star in order to derive a detection limit curve versus separation. We follow the method described in Horch et al. (2011). By computing the average and standard deviation of the maxima inside annuli that have different mean separations from the primary star, we estimate the 5-sigma detection limit as the mean value plus five times the standard deviation, converted to a magnitude difference. For Gemini data, this is done centering annuli at distances of 0.1, 0.2, 0.3, …, 1.2 arcsec. We then use a cubic spline interpolation to develop a smooth detection limit curve at all separations in between the two extreme limits. Curves like this are shown in Figures 1 and 2.
4 Results
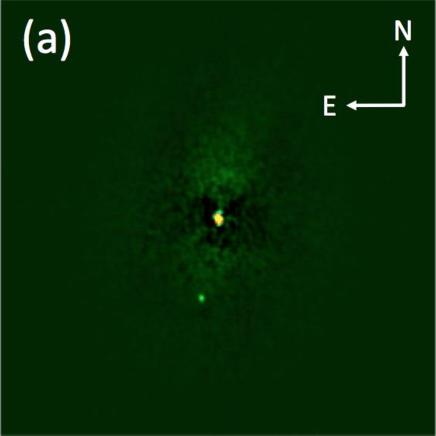
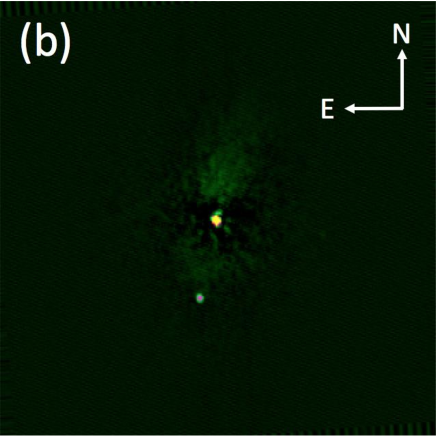
Target stars that were imaged using DSSI have been examined; however, only the images of two stars, HD 2638 and HD 164509, show a nearby bright source, as can be seen in both Figures 1 and 2. Results of the DSSI observations for both stars are tabulated in Table 2. As described by Horch et al. (2015), typical uncertainties in separation for DSSI at Gemini are 1–2 milli-arcsecs (mas). For a particularly faint component, such as the companion to HD 164509, the uncertainty will lie at the upper end of that range. Thus, for separation, we assigned the conservative uncertainty of 2 mas, as shown in Table 2. Similarly for the position angle, an uncertainty of is consistent with previous measurements acquired using the Gemini/DSSI configuration. For uncertainties in the magnitude difference between primary and secondary, we used the empirically determined precision for such measurements provided by Horch et al. (2004).
The sensitivity plots provided in Figures 1 and 2 show the magnitude difference between local maxima and minima in the corresponding image as a function of the separation from the primary host star. The construction of these sensitivity plots are described in more detail by Howell et al. (2011). As shown in the sensitivity plots, the limiting resolution of DSSI with Gemini is . Each of the two stars discussed here and their corresponding results are described separately below.
4.1 HD 2638
Prior to submitting this work, we learned that Riddle et al. (2015) has detected HD 2638’s stellar companion. We present our results as an independent detection of this companion. Both DSSI images from Figure 1 show a bright source to the bottom and slightly to the left of HD 2638. Based on the magnitude differences from Table 2, the stellar companion appears to be brighter at 880 nm than it is at 692 nm, implying that the stellar companion is a late-type star. According to Roberts et al. (2015), the companion’s spectral type is M1V, which seems to be in agreement with our assessment. Our calculations of the projected separation between HD 2638 and its companion star yield AU at 692 nm and AU at 880 nm, which is close to Roberts et al. (2015)’s 28.5 AU physical separation. Note that the apparent close companion to the north of the primary in each image is within the limting resolution of the instrument and is thus an artifact of the speckle image processing.
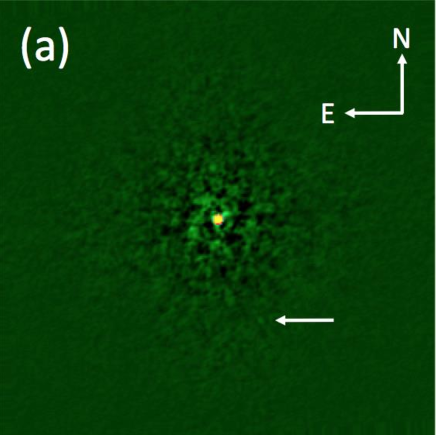
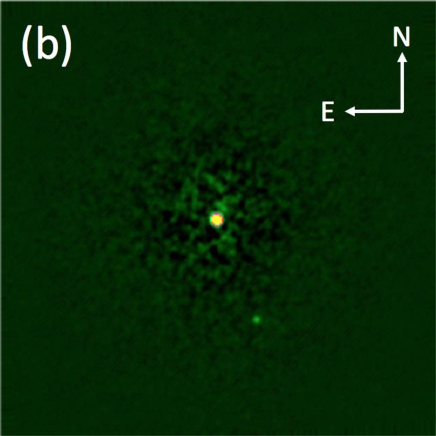
4.2 HD 164509
Figure 2 contains two images that display a source southwest of HD 164509. The magnitude differences of this system imply that the stellar companion is considerably fainter than the host star by a factor of almost 100. In fact, it is so faint at 692 nm that it is difficult to resolve in the image. Despite the fact that HD 164509 is more luminous than HD 2638, the considerable faintness of HD 164509’s companion as compared to HD 2638’s implies that this stellar companion is a very cool, late-type star. Based on the data from Table 2, the physical separation between HD 164509 and its companion is AU. To compare, the planet Neptune is about 30 AU from our Sun, and the result falls short of the dwarf planet Pluto’s average distance of 39.5 AU. Since HD 164509 is slightly more massive than our Sun and with the given distance between the host star and its companion, this leads to credence that the faint object may be gravitationally bound to HD 164509. One interesting thing to point out is that this dim star may be “an additional longer period companion” that Giguere et al. (2012) speculated when they came across the RV data’s residual linear trend. As of this writing, there has been no confirmation of HD 164509 hosting a stellar companion.
| Measurements | HD 2638 | HD 164509 | ||
|---|---|---|---|---|
| 692 nm | 880 nm | 692 nm | 880 nm | |
| Position Angle E of N () | 167.7 ±0.2 | 167.7 ±0.2 | 202.5 ±0.2 | 202.6 ±0.2 |
| Apparent Separation () | 0.511 ±0.002 | 0.513 ±0.002 | 0.697 ±0.002 | 0.697 ±0.002 |
| Projected Separation (AU) | 25.5 ±1.9 | 25.6 ±1.9 | 36.5 ±1.9 | 36.5 ±1.9 |
| m∗ | 3.83 ±0.2 | 2.80 ±0.2 | 5.53 ±0.4 | 4.41 ±0.4 |
4.3 Stellar Isochrone Fitting
To determine the properties of the detected stellar companions, we performed a stellar isochrone fit using the methodology described by Everett et al. (2015) and Teske et al. (2015). Briefly, the method maps out the probability distribution of the primary star using Dartmouth stellar isochrones. The inputs for this analysis are the stellar properties shown in Table 1. The combination of the resulting probability distributions for the primary with the multi-band observations described in Section 3 produce a probability distribution for the properties of the secondary. Such a result assumes that it is a bound companion that falls on the same isochrone as the primary.
| Parameters | HD 2638 | HD 164509 |
|---|---|---|
| () | 0.48 ±0.03 | 0.42 ±0.03 |
| () | 0.46 ±0.02 | 0.40 ±0.02 |
| () | 0.030 ±0.005 | 0.020 ±0.003 |
| () | 3571 ±48 | 3446 ±43 |
| () | 4.80 ±0.02 | 4.85 ±0.02 |
 |
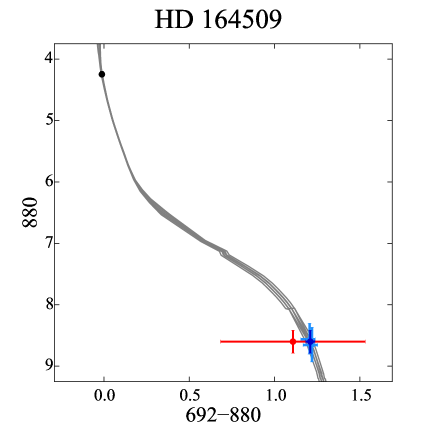 |
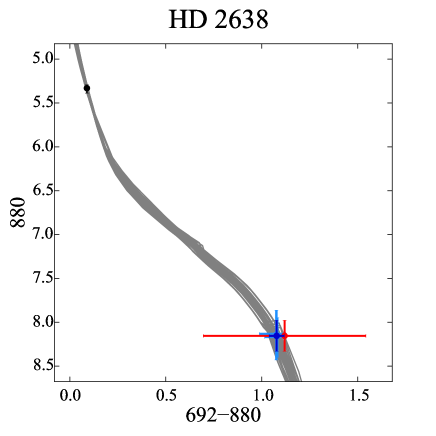
The results of our isochrone fits for the stellar companions are shown in Table 3. The derived stellar properties are consistent with both of the companion stars being late-type main sequence stars (M dwarfs). Note that both our mass determination (Table 3) and projected separation (Table 2) for the HD 2638 stellar companion match well with the results obtained by Roberts et al. (2015). The results from our isochrone fitting are shown in Figure 3 for HD 2638 (left) and HD 164509 (right). The color-magnitude diagrams include the set of isochrones that are within of the primary star metallicity. The black data point represents the primary star and the red data point shows the location of the secondary based upon the measurements described in Section 3. The dark blue data point is the average location of the secondary based upon the probability distributions of the isochrone fitting. The location of the secondary from measurements and from isochrone fits are consistent with one another, indicating that the assumption of the secondary being bound to the primary is indeed a valid assumption.
4.4 Proper Motion and Astrometry
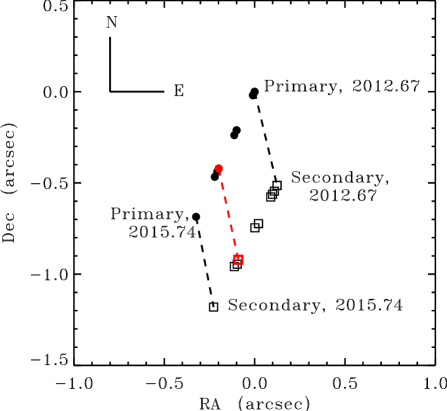
A further test that the detected companions are indeed bound to the primary is to analyse the common proper motion of the stars on the sky. For HD 2638, such data are available from the “Fourth Interferometric Catalog of Binary Stars” (see description in Hartkopf et al. (2001)). The observations of HD 2638 from the catalog span a time frame from 2012.67 to 2015.74. Figure 4 shows the locations of the primary star and secondary star relative to a zero position for the primary at the first epoch shown, 2012.67. The primary star positions are shown as filled circles, and the secondary positions as open squares. The two measurements presented in this work, which on this scale are indistinguishable, are shown in red. Dotted lines link the primary and secondary for the first and last observations in the sequence, and for our 692-nm observations. The proper motions (see Table 1) are drawn from van Leeuwen (2007). This figure demonstrates that the pair of stars are clearly moving together.
For HD 164509, we have only the single measurement described in this work for the relative astrometry as of now, so the same analysis cannot be completd. However, it is worth noting that the proper motion of HD 164509 is significantly smaller than for HD 2638 (see Table 1). Thus, a few more speckle observations of this star over the next few years would allow the same analysis to be undertaken since these numbers, although not as big as for HD 2638, are several times the typical precision for the speckle observations.
5 Implications for the Known Planets
 |
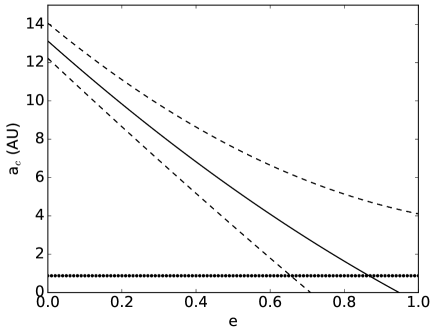 |
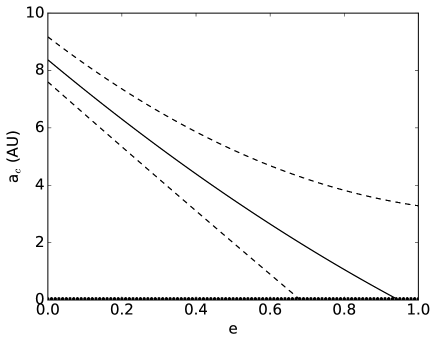
The presence of stellar companions can pose a significant challenge for orbital stability and formation scenarios for planets in such systems (Ngo et al., 2015; Wang et al., 2015). Issues regarding planet formation include protoplanetary disc truncation, grain condensation, and planetesimal accumulation (see Thebault & Haghighipour (2014) and references therein). To test that our observations are consistent with the presence of the planets, we use the orbital dynamics results of Holman & Wiegert (1999) for test particles in binary systems. Specifically, we calculate the critical semi-major axis, , beyond which planetary orbits would be unstable in the systems. The resulting plots of as a function of binary eccentricity are shown in Figure 5. The values of were calculated using Equation 1 from Holman & Wiegert (1999):
| (1) |
where is the binary semi-major axis. The mass ratio, , is calculated as where and are the masses of the primary and secondary respectively. Using the values from Tables 2 and 3, we have & AU for HD 2638, and & AU for HD 164509. Note that this assumes the projected separations are the true semi-major axes of the binary companions. Including both the uncertainties in Equation 1 and , we include lines for the 1 uncertainties as dashed lines in Figure 5. The semi-major axes of the known planets (see Table 1) are represented in each case by a horizontal dotted line. These figures show the stability of the planetary orbits remain secure for most values of the binary eccentricity. The maximum binary eccentricities (where the planetary semi-major axis lines intersect the eccentricity lines) are and for HD 2638 and HD 164509 respectively.
Given that the planets were discovered with the RV technique, it is worth pausing to consider the effect of the stellar binary companions on the planetary interpretation of the RV data. Using the stellar parameters of the primary and secondary from Tables 1 and 3 respectively, along with the projected separations from Table 2, we calculate the expected orbital periods and RV semi-amplitudes for each system. For HD 2638, the minimum orbital period is 110 years with a maximum RV semi-amplitude of 2.4 km/s. For HD 164509, the minimum orbital period is 180 years with a maximum RV semi-amplitude of 1.7 km/s. As noted in Section 2, the Kepler solution to the HD 164509 RVs includes a linear trend, though the time baseline since discovery is insufficient to charactize the nature of the trend. Assuming the minimum separations above, the companions cannot be confused with the planetary signals and thus have no effect on the planetary interpretation of the RV data.
6 Conclusion
Determining the stellar architecture of planetary systems is an on-going process, improving as the capability to detect faint stellar companions increases. Stellar binarity can have a profound effect on exoplanetary systems, both in terms of formation processes and long-term orbital stability. Thus determining the binarity of known exoplanet host stars is a critical step in the characterization of those systems.
Here we have presented detections of stellar companions to two known exoplanet host stars: HD 2638 and HD 164509. Though the stellar companion to HD 2638 was previously detected by Roberts et al. (2015), the new data from DSSI will provide additional information of the astrometry of the companion and the stellar properties, given that the passbands used are particular to the DSSI camera. We have shown that the detected companions have properties consistent with them both being M dwarfs, and the isochrone analysis shows that they are both likely to be gravitationally bound to the host stars. Fortunately, the presence of the stellar companions do not pose serious orbital stability problems for the known exoplanets, making the overall architecture of the systems self-consistent. These planetary systems represent additional interesting examples of planet formation and evolution in the presence of multiple stars.
7 Acknowledgments
Based on observations obtained at the Gemini Observatory, which is operated by the Association of Universities for Research in Astronomy, Inc., under a cooperative agreement with the NSF on behalf of the Gemini partnership: the National Science Foundation (United States), the National Research Council (Canada), CONICYT (Chile), the Australian Research Council (Australia), Ministério da Ciência, Tecnologia e Inovação (Brazil) and Ministerio de Ciencia, Tecnología e Innovación Productiva (Argentina). This research has made use of the NASA Exoplanet Archive, which is operated by the California Institute of Technology, under contract with the National Aeronautics and Space Administration under the Exoplanet Exploration Program. The results reported herein benefited from collaborations and/or information exchange within NASA’s Nexus for Exoplanet System Science (NExSS) research coordination network sponsored by NASA’s Science Mission Directorate.
References
- Benest (1988) Benest, D. 1988, A&A, 206, 143
- Benest (1989) Benest, D. 1989, A&A, 223, 361
- Benest (1996) Benest, D. 1996, A&A, 314, 983
- Bonfanti et al. (2016) Bonfanti, A., Ortolani, S., Nascimbeni, V. 2016, A&A, 585, A5
- Cartier et al. (2015) Cartier, K.M.S., Gilliland, R.L., Wright, J.T., Ciardi, D.R. 2015, ApJ, 804, 97 M. 2011, ApJ, 738, 151
- Ciardi et al. (2015) Ciardi, D.R., Beichman, C.A., Horch, E.P., Howell, S.B. 2015, ApJ, 805, 16
- Eggenberger et al. (2004) Eggenberger, A., Udry, S., Mayor, M. 2004, A&A, 417, 353
- ESA (1997) ESA 1997, The Hipparcos and Tycho Catalogues (ESA-SP 1200; Noordwijk: ESA)
- Everett et al. (2015) Everett, M.E., Barclay, T., Ciardi, D.R., et al. 2015, AJ, 149, 55
- Giguere et al. (2012) Giguere, M.J., Fischer, D.A., Howard, A.W., et al. 2012, ApJ, 744, 4
- Gilliland et al. (2015) Gilliland, R.L., Cartier, K.M.S., Adams, E.R., et al. 2015, AJ, 149, 24
- Ginski et al. (2016) Ginski, C., Mugrauer, M., Seeliger, M., et al. 2016, MNRAS, 457, 2173
- Hartkopf et al. (2001) Hartkopf, W.I., McAlister, H.A., Mason, B.D. 2001, AJ, 122, 3480
- Holman & Wiegert (1999) Holman, M.J. Wiegert, P.A. 1999, AJ, 117, 621
- Horch et al. (2004) Horch, E.P., Meyer, R.D., van Altena, W.F. 2004, AJ, 127, 1727
- Horch et al. (2009) Horch, E.P., Veillette, D.R., Baena, G., et al. 2009, AJ, 137, 5057
- Horch et al. (2011) Horch, E.P., Gomez, S.C., Sherry, W.H., et al. 2011, AJ, 141, 45
- Horch et al. (2012) Horch, E.P., Howell, S.B., Everett, M.E., Ciardi, D.R. et al. 2012, AJ, 144, 165
- Horch et al. (2015) Horch, E.P., van Altena, W.F., Demarque, P., et al. 2015, AJ, 149, 151
- Howell et al. (2011) Howell, S.B., Everett, M.E., Sherry, W., Horch, E., Ciardi, D.R. 2011, AJ, 142, 19
- Kane et al. (2015) Kane, S.R., Barclay, T., Hartmann, M., et al. 2015, ApJ, 815, 32
- Kraus et al. (2016) Kraus, A.L., Ireland, M.J., Huber, D., Mann, A.W., Dupuy, T.J. 2016, AJ, in press (arXiv:1604.05744)
- Lohmann et al. (1983) Lohmann, A.W., Weigelt, G., Wirnitzer, B. 1983, ApOpt, 22, 4028
- Meng et al. (1990) Meng, J., Aitken, G.J.M., Hege, E.K., Morgan, J.S. 1990, JOSAA, 7, 1243
- Moutou et al. (2005) Moutou, C., Mayor, M., Bouchy, F., et al. 2005, A&A, 439, 367
- Ngo et al. (2015) Ngo, H., Knutson, H.A., Hinkley, S., et al. 2015, ApJ, 800, 138
- Raghavan et al. (2010) Raghavan, D., McAlister, H.A., Henry, T.J., et al. 2010, ApJS, 190, 1
- Riddle et al. (2015) Riddle, R.L., Tokovinin, A., Mason, B.D., et al. 2015, ApJ, 799, 4
- Roberts et al. (2015) Roberts, L.C., Tokovinin, A., Mason, B.D. et al. 2015, AJ, 149, 118
- Shaya & Olling (2011) Shaya, E.J. Olling, R.P. 2011, ApJ, 192, 2
- Sirothia et al. (2014) Sirothia, S.K., Lecavelier des Etangs, A., Gopal-Krishna, Kantharia, N.G., Ishwar-Chandra, C.H. 2014, A&A, 562, A108
- Teske et al. (2015) Teske, J.K., Everett, M.E., Hirsch, L., et al. 2015, AJ, 150, 144
- Thebault & Haghighipour (2014) Thebault, Ph., Haghighipour, N. 2014, Review chapter in “Planetary Exploration and Science: Recent Advances and Applications”, eds. S. Jin, N. Haghighipour, W.-H. Ip, Springer (arXiv:1406.1357)
- van Leeuwen (2007) van Leeuwen, F. 2007, A&A, 474, 653
- Wang & Ford (2011) Wang, J. Ford, E.B. 2011, MNRAS, 418, 1822
- Wang et al. (2015) Wang, J., Fischer, D.A., Horch, E.P., Xie, J.-W. 2015, ApJ, 806, 248
- Zucker & Mazeh (2002) Zucker, S. Mazeh, T. 2002, ApJ, 568, L113