Galaxy Zoo: Evidence for rapid, recent quenching within a population of AGN host galaxies
Abstract
We present a population study of the star formation history of Type 2 AGN host galaxies, compared to inactive galaxies. A Bayesian method is used to determine individual galaxy star formation histories, which are then collated to visualise the distribution for quenching and quenched galaxies within each population. We find evidence for some of the Type 2 AGN host galaxies having undergone a rapid drop in their star formation rate within the last 2 Gyr. AGN feedback is therefore important at least for this population of galaxies.
This result is not seen for the quenching and quenched inactive galaxies whose star formation histories are dominated by the effects of downsizing at earlier epochs, a secondary effect for the AGN host galaxies. We show that histories of rapid quenching cannot account fully for the quenching of all the star formation in a galaxy’s lifetime across the population of quenched AGN host galaxies, and that histories of slower quenching, attributed to secular (non-violent) evolution, are also key in their evolution.
This is in agreement with recent results showing both merger-driven and non-merger processes are contributing to the co-evolution of galaxies and supermassive black holes. The availability of gas in the reservoirs of a galaxy, and its ability to be replenished, appear to be the key drivers behind this co-evolution.
Keywords: galaxies: evolution galaxies: statistics galaxies: active galaxies: Seyfert galaxies: photometry
1 Introduction
The nature of the observed co-evolution of galaxies and their central supermassive black holes (Magorrian et al., 1998; Marconi & Hunt, 2003; Haring & Rix, 2004) and the effects of AGN feedback on galaxies are two of the most important open issues in galaxy evolution. AGN feedback was first suggested as a mechanism for regulating star formation in simulations (Silk & Rees, 1998; Croton et al., 2006; Bower et al., 2006; Somerville et al., 2008) and indirect evidence has been observed for both positive and negative feedback in various systems (see the comprehensive review from Fabian 2006).
The strongest observational evidence for AGN feedback in a population is that the largest fraction of AGN are found in the green valley (Cowie & Barger, 2008; Hickox et al., 2009; Schawinski et al., 2010), suggesting some link between AGN activity and the process of quenching which moves a galaxy from the blue cloud to the red sequence. However, concrete statistical evidence for the effect of AGN feedback on the host galaxy population has so far been elusive.
Here we present a large observational population study of the star formation histories (SFH) of Type 2 AGN host galaxies. We use a new Bayesian method (Smethurst et al., 2015) to effectively determine the most probable SFH of a galaxy, modelled with two parameters, time of quenching, , and exponential rate, , given the observed near ultra-violet (NUV) and optical colours. This builds on the work of Martin et al. (2007) and Schawinski et al. (2014), but improves significantly on previous techniques. We aim to determine the following: (i) Are galaxies currently hosting an AGN undergoing quenching? (ii) If so, when and at what rate does this quenching occur? (iii) Is this quenching occurring at different times and rates compared to a control sample of inactive galaxies?
The zero points of all magnitudes are in the AB system. Where necessary, we adopt the WMAP Seven-Year Cosmology (Jarosik et al. 2011) with .
2 Data & Methods
2.1 Data Sources
In this investigation we use visual classifications of galaxy morphologies from the Galaxy Zoo 2111http://zoo2.galaxyzoo.org/ (GZ2) citizen science project (Willett et al., 2013), which obtains multiple independent classifications for each optical image. The full question tree for an image is shown in Figure 1 of Willett et al. The GZ2 project used images from the Sloan Digital Sky Survey Data Release 7 (SDSS; York et al. 2000; Abazajian et al. 2009) all classified by at least 17 independent users, with a mean number of classifications of .
2.2 AGN Sample
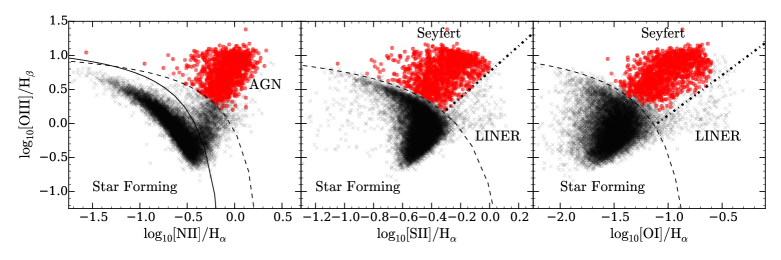
We selected Type 2 AGN using a BPT diagram (Baldwin, Phillips & Terlevich, 1981) using line and continuum strengths for [OIII], [NII], [SII] and [OII] obtained from the MPA-JHU catalogue (Kauffman et al., 2003a; Brinchmann et al., 2004) for galaxies in the gz2-galex sample. We then required the S/N for each emission line as in Schawinski et al. (2010). Those galaxies which satisfied all of the inequalities defined in Kewley et al. (2001) and Kauffman et al. (2003b) were selected as Type 2 AGN, giving host galaxies ( of the gz2-galex sample). Sarzi et al. (2010); Yan & Blanton (2012) and Singh et al. (2013) have all demonstrated that LINERs are not primarily powered by AGN, therefore for purity, we excluded these galaxies from the sample using the definition from Kewley et al. (2006) ( galaxies total) with no change to the results. These galaxies will be referred to as the agn-host sample.
We refrain from using Type 1 AGN due to concerns about contamination of the SFH analysis from potentially strong NUV emission by unobscured nuclei. The obscuration of Type 2 AGN is highly efficient, considerably more so in the NUV than the optical (Simmons et al., 2011); residual NUV flux from a Type 2 AGN can be neglected in comparison to that of the galaxy. We also investigated the possibility of contamination of optical galaxy colours by residual AGN emission, finding that subtracting measured nuclear magnitudes (SDSS psfMag) produces a negligible change in host galaxy colour (). We therefore use the uncorrected colours to avoid unnecessary complexity and minimise the propagation of uncertainty from the colours through to the SFHs. However, we note that including these corrected colours does not change our results.
We note also that galaxy colours were not corrected for intrinsic dust attenuation. This is of particular consequence for disc galaxies, where attenuation increases with increasing inclination. Buat et al. (2005) found the median value of the attenuation in the GALEX NUV passband to be mag. Similarly Masters et al. (2010) found a total extinction from face-on to edge-on spirals of 0.7 and 0.5 mag for the SDSS and passbands and show spirals with have signs of significant dust attenuation. For the agn-host (inactive) sample we find () of discs (with ) have , therefore we must be aware of possible biases in our results due to dust.
From the findings of Masters et al. (2010) and Buat et al. (2005) above, we estimate the extinction to be mag and mag, therefore the average change in the SFH parameters across a range of input colours and , are Gyr, Gyr. This change therefore causes the SFH parameters derived to move towards earlier times and faster quenching rates. Results should be viewed with the caveat, particularly for higher mass, disc galaxies, that earlier values of and more rapid values of may be inferred by starpy. However, we note that (i) applying these average corrections across each sample population does not change our main conclusions, (ii) that results are consistent if the population of edge-on and face-on galaxies are compared and (iii) that results do not change if only face-on galaxies are used in the investigation, strongly suggesting that internal galactic extinction does not systematically bias our results.
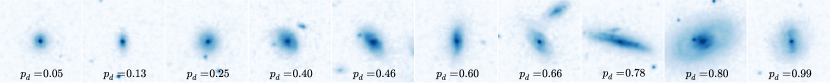
SDSS images for 10 randomly selected galaxies from the agn-host sample are shown in Figure 1; Figure 2 shows the entire agn-host sample and the matched gz2-galex galaxies on a BPT diagram. For the agn-host sample the mean and median , with a range of luminosities of .
We constructed a sample of inactive galaxies by removing from the gz2-galex sample all galaxies with line strengths indicative of potential AGN activity (Kauffman et al., 2003b), as well as sources identified as Type 1 AGN by the presence of broad emission lines (Oh et al., 2015). We select mass- and morphology-matched inactive samples by identifying between 1 and 5 inactive galaxies for each agn-host galaxy with the same stellar mass (to within ) and GZ2 ‘smooth’ and ‘disc’ vote fractions (to within ); this selects galaxies. We refer to this sample as the inactive sample. A Kolmogorov-Smirnov test revealed the redshift distributions of the inactive and agn-host samples are statistically indistinguishable (, ).
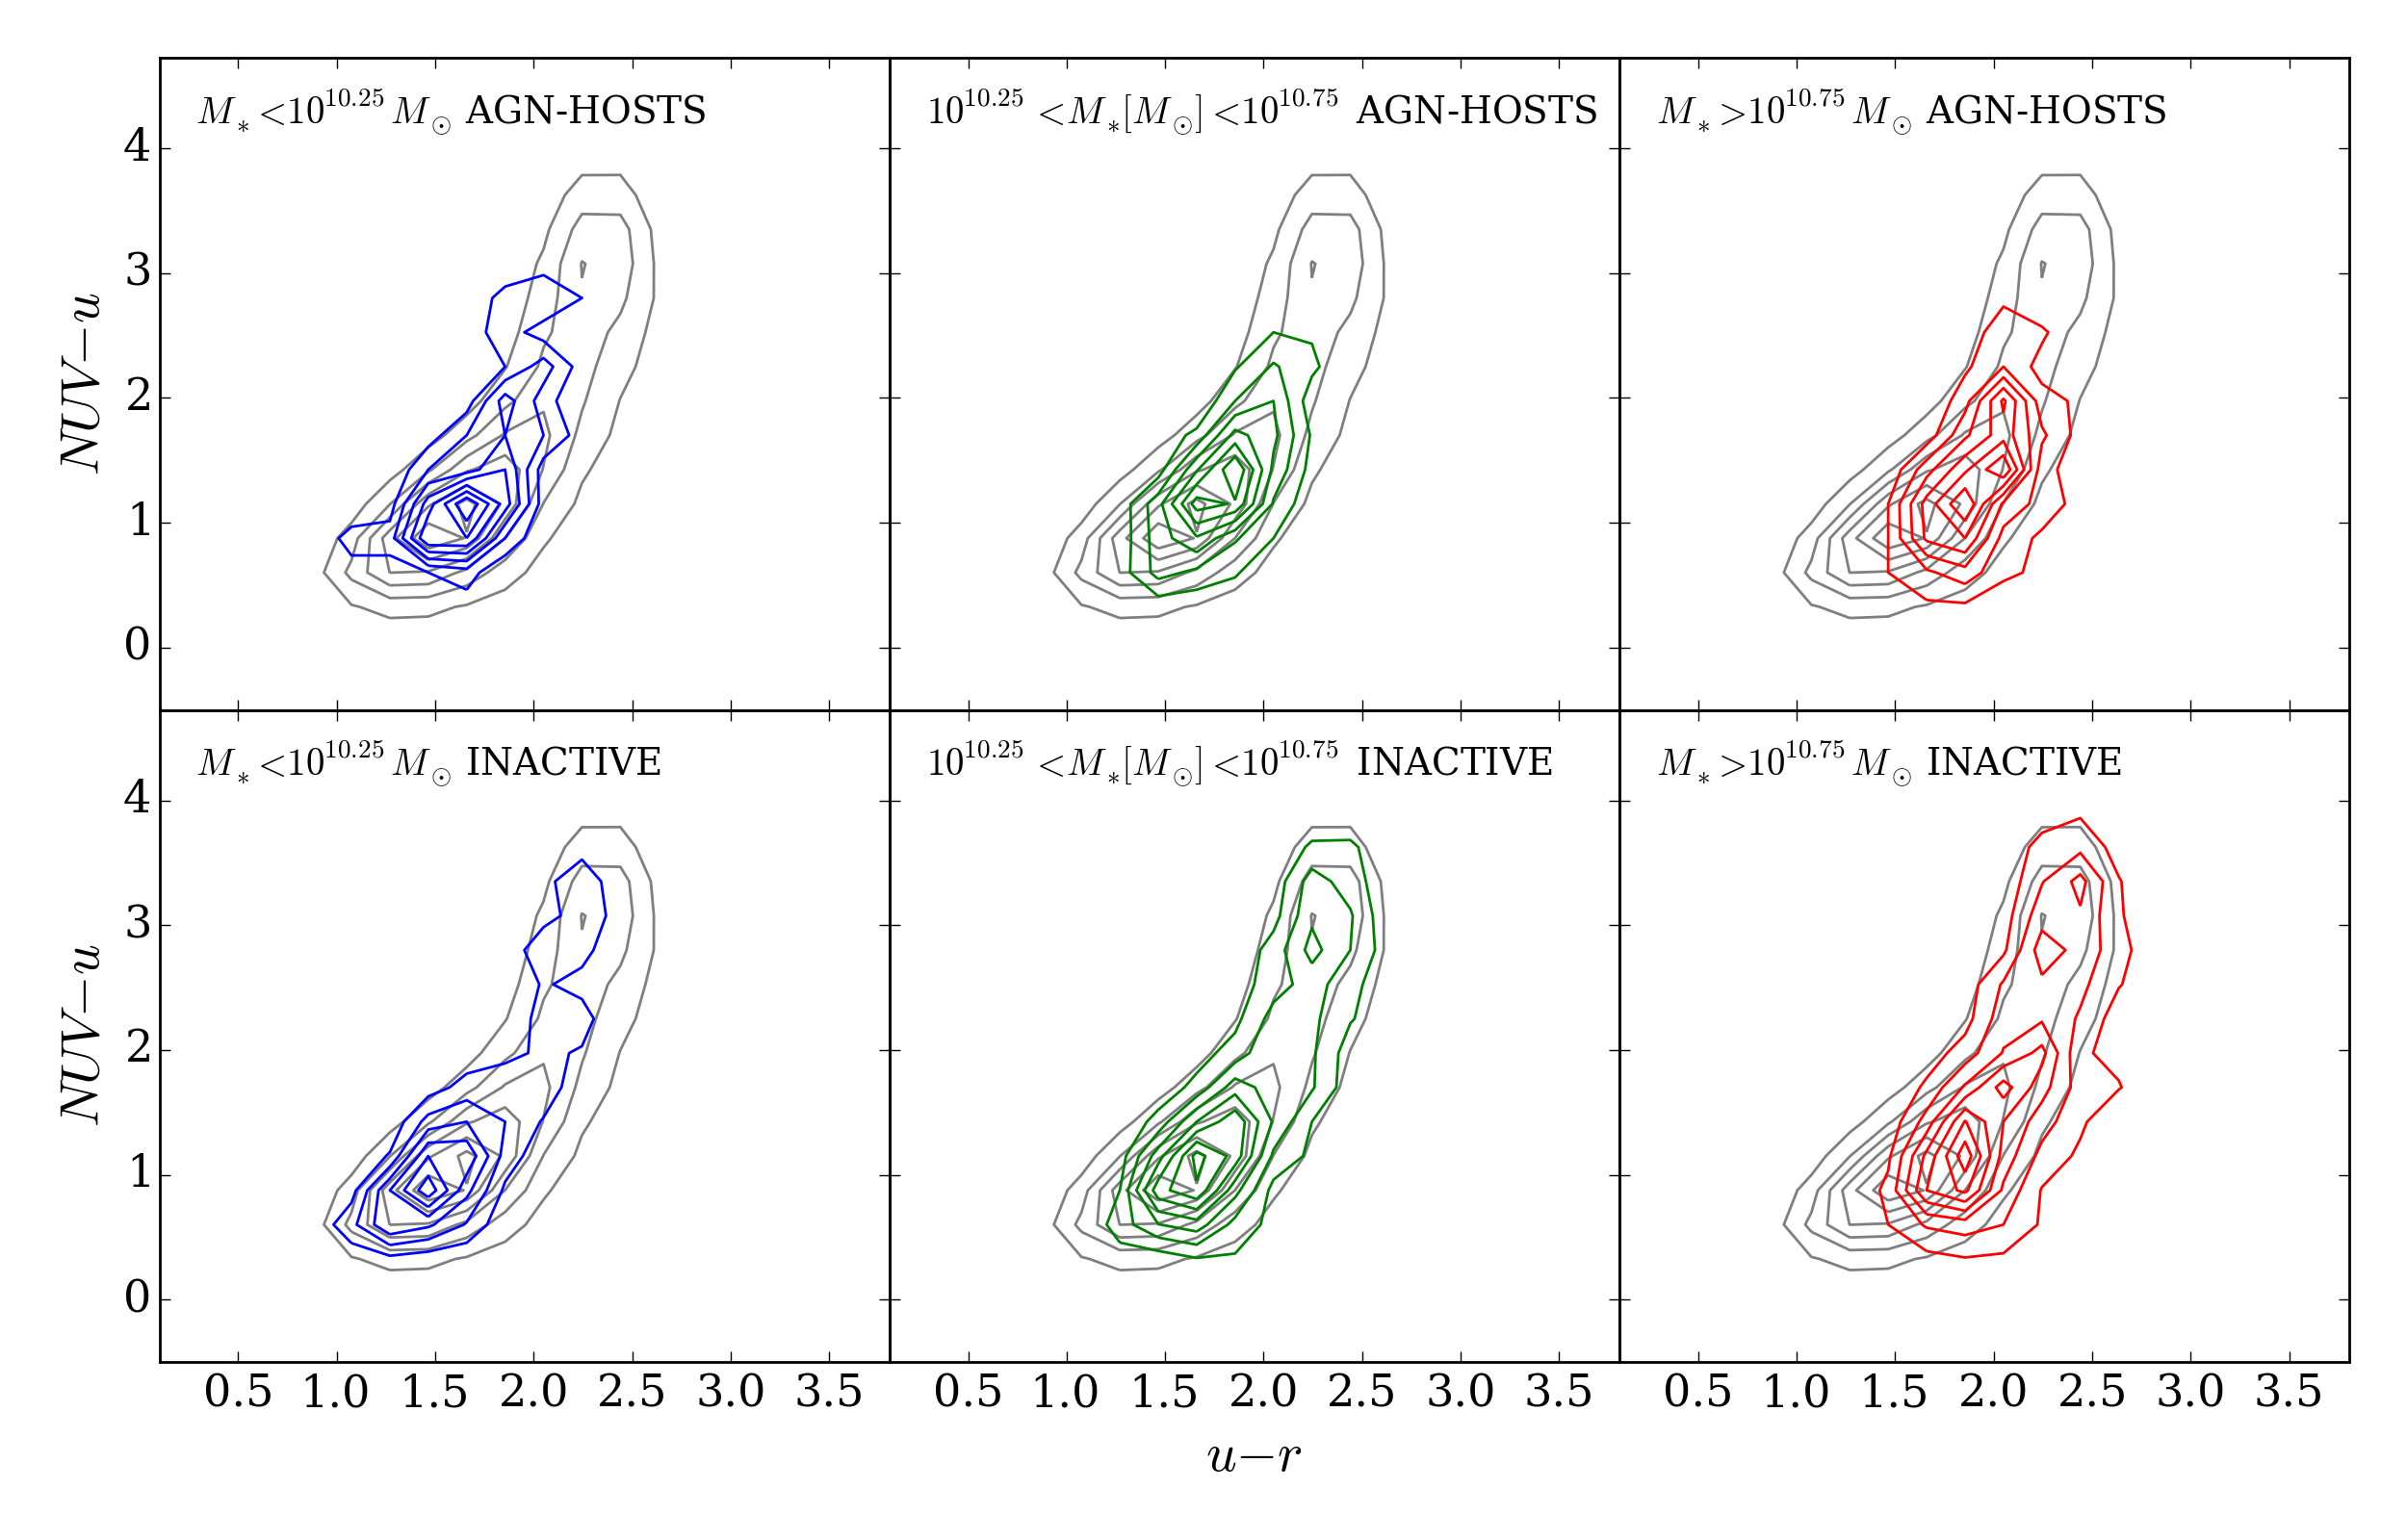
We show the agn-host and inactive samples on both an optical colour-magnitude diagram and in the SFR-stellar mass plane in Figure 3 in comparison to the distribution of SDSS DR7 galaxies. SFRs and stellar masses are obtained from the MPA JHU catalog, where available, which follow the prescriptions outlined in Brinchmann et al. (2004) and Salim et al. (2007) for calculating the total aperture corrected galaxy SFR in the presence of an AGN.
We note that the majority of the agn-host sample would be defined as residing in the blue cloud () on the optical colour-magnitude diagram despite the fact that a significant proportion of the sample () lie more than ( ) below the star forming “main sequence” (fit to the MPA-JHU catalog of SDSS DR7 of Kauffman et al. 2003a; Brinchmann et al. 2004, see Figure 3).
Ko et al. (2013) show that in a sample of quiescent red-sequence galaxies without emission, show NUV excess emission and that the fraction with recent star formation is . This is more clearly visible in Figure 3b, where a substantial fraction of both the agn-host and inactive samples, all of the sources in which have detected NUV emission, nevertheless lie more than below the star-formation sequence. We do not make a cut on either the agn-host or inactive samples for star formation rate. The SFH of the entire samples are fitted, however we describe in Section 2.3 how our method accounts for those galaxies not appropriately fit by a quenching model and down-weights their contribution to the final results.

Since this investigation is focussed on whether an AGN can have an impact on the SF of its host galaxy, we must also consider possible selection effects. The extent to which SF could obscure AGN emission was addressed by Schawinski et al. (2010). They showed, via analysis of simulated AGN emission added to star-forming galaxies, that BPT-based selection of AGN produces a complete sample at luminosities of . Above this limit we therefore assume we have selected a complete sample of AGN independent of host galaxy SFR.
2.3 Bayesian SFH Determination
starpy222Publicly available: http://github.com/zooniverse/starpy is a python code which allows the user to derive the quenching star formation history (SFH) of a single galaxy through a Bayesian Markov Chain Monte Carlo method (Foreman-Mackey et al., 2013)333http://dan.iel.fm/emcee/ with the input of the observed and colours, a redshift, and the use of the stellar population models of Bruzual & Charlot (2003). These models are implemented using solar metallicity (varying this does not substantially affect these results; Smethurst et al. 2015) and a Chabrier IMF (Chabrier et al., 2003) but does not model for intrinsic dust (see Section 2.2). The SFH is modelled as an exponential decline of the SFR described by two parameters , where is the time at the onset of quenching and is the exponential rate at which quenching occurs . Under the simplifying assumption that all galaxies formed at with an initial burst of star formation, the SFH can be described as:
| (1) |
where is an initial constant star formation rate dependent on (Schawinski et al., 2014; Smethurst et al., 2015). A smaller value corresponds to a rapid quench, whereas a larger value corresponds to a slower quench. We note that a galaxy undergoing a slow quench is not necessarily quiescent by the time of observation. Similarly, despite a rapid quenching rate, star formation in a galaxy may still be ongoing at very low rates, rather than being fully quenched. This SFH model has previously been shown to appropriately characterise quenching galaxies (Weiner et al., 2006; Martin et al., 2007; Noeske et al., 2007; Schawinski et al., 2014). We note also that star forming galaxies in this regime are fit by a constant SFR with a Age, (i.e. the age of the Universe at the galaxy’s observed redshift) with a very low probability.
The probabilistic fitting methods to these star formation histories for an observed galaxy are described in full detail in Section 3.2 of Smethurst et al. (2015), wherein the starpy code was used to characterise the SFHs of each galaxy in the gz2-galex sample. We assume a flat prior on all the model parameters and the difference between the observed and predicted and colours are modelled as independent realisations of a double Gaussian likelihood function (Equation 2 in Smethurst et al. 2015). We also make the simplifying assumption that the age of each galaxy, corresponds to the age of the Universe at its observed redshift, .
The output of starpy is probabilistic in nature and provides the posterior probability distribution across the two-parameter space for an individual galaxy the degeneracies for which can be seen in Figure 4 of Smethurst et al. (2015). To study the SFH across a population of galaxies, these individual posterior probability distributions are stacked in space and weighted by their probability. This is to minimise the contribution of galaxies poorly fit by this exponentially declining SFH, therefore galaxies in each sample which reside on the main sequence will not contribute to the final population distribution of quenching parameters shown in Figures 4 & 5. This is no longer inference but is a method to visualise the results across a population of galaxies. An alternative method would be to perform inference on hierarchical Bayesian parent parameters, to describe the population. Such a hierarchical method, however, requires an initial decision on the functional shape of this parent distribution, which introduces non-trivial assumptions. A discussion of this approach and the decision to use an alternative approach can be found in Section C.
We obtain separate stacked population distributions for both smooth and disc galaxies by using the GZ2 debiased vote fractions for disc () or smooth () morphologies as weights when stacking, as in Smethurst et al. (2015). This ensures that the entirety of the population is used, with galaxies with a higher contributing more to the disc weighted than the smooth weighted population density. This negates the need for a threshold on the GZ2 vote fractions (e.g., as used in Schawinski et al., 2014). These distributions will be referred to as the population densities.
We also split both the agn-host and inactive samples into low, medium and high mass ranges (see Table 1) to investigate any trends in the SFH with mass. The mass boundaries were chosen to give roughly equal numbers of inactive galaxies in each bin prior to the mass matching to the agn-host sample.
3 Results
| sample | mass bin | weighting | number | |||
|---|---|---|---|---|---|---|
| AGN-HOSTS | ||||||
| INACTIVE | ||||||
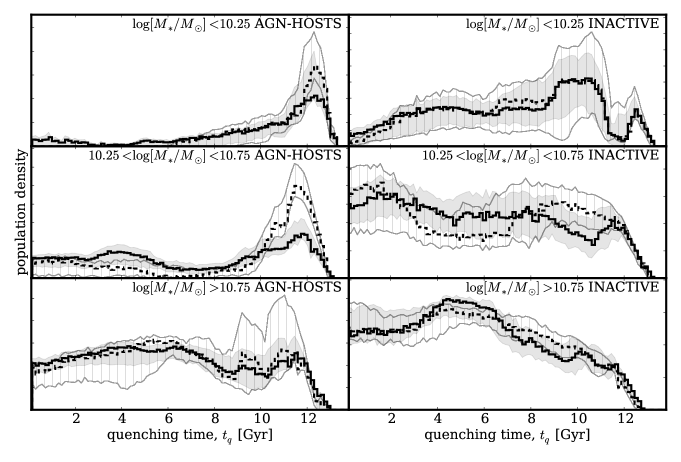
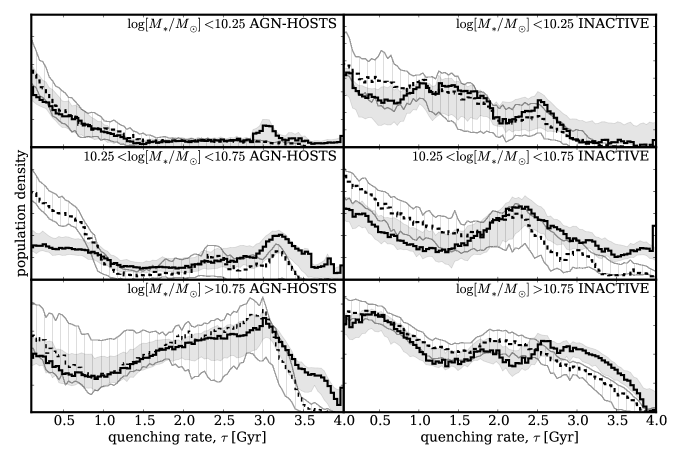
Figures 4 and 5 show the stacked population density distributions for the quenching time, and exponential quenching rate, , respectively. In each figure the population density, along with shaded regions to show the uncertainties, for a given parameter is shown for smooth and disc galaxy populations across three mass bins for the agn-host and inactive samples. No cut on the star formation rate is made to the galaxies which contribute to Figures 4 & 5, but those galaxies poorly fit by an exponentially declining SFH are down-weighted so that they do not contribute to the results presented here. In Table 1 the percentage of the population density in each quenching regime for rapid ( Gyr), intermediate () and slow ( Gyr) quenching timescales, are shown. Uncertainties on the population densities (shown by the shaded regions) are determined from the maximum and minimum values spanned by bootstrap iterations, each sampling of the galaxy population. uncertainties are quoted for the percentages in Table 1, calculated from the bootstrapped distributions.
These population densities should be interpreted as the spread of quenching times and rates occurring in galaxies which have either undergone or are undergoing quenching within a population. Figures 4 and 5 show a distinct difference between the population density of agn-host and inactive quenching parameters.
At all masses, the population density for galaxies within the agn-host population across the quenching time parameter (left panels of Figure 4) is different from that of the inactive galaxies (right panels of Figure 4). Recent quenching ( Gyr) is the dominant history for quenched and quenching low and medium mass agn-host galaxies, particularly for the smooth galaxies hosting an AGN. However, this effect is less dominant in higher mass galaxies where quenching at earlier times also has high density.
The population densities for the quenching rate, , in Figure 5 and Table 1 show the dominance of rapid quenching ( Gyr) within the agn-host population, particularly for smooth galaxies. With increasing mass the dominant quenching rate becomes slow ( Gyr) especially for disc galaxies hosting an AGN. Similar trends in the density are observed within the inactive population but the overall distribution is very different.
The distributions for the agn-host galaxies therefore show evidence for the dominance of rapid, recent quenching within this population. This result implies the importance of AGN feedback for the evolution of these galaxies.
4 Discussion
The differences between the population density distributions of the agn-host and inactive populations reveal that an AGN can have a significant effect on the SFH of its host galaxy. Both recent, rapid quenching and early, slow quenching are observed in the population density within the agn-host population.
There are minimal differences between the smooth and disc weighted distributions of the quenching parameters within the agn-host population. This is agreement with the conclusions of Kauffman et al. (2003b) who found that the structural properties of AGN hosts depend very little on AGN power.
The difference between the agn-host and inactive population distributions in Figure 5 for the rate of quenching, , tells a story of gas reservoirs. The density distribution for higher mass agn-host galaxies is dominated by slow, early quenching implying another mechanism is responsible for the cessation of star formation within a proportion of these high mass galaxies prior to the triggering of the current AGN. This preference for slow evolution timescales follows from the ideas of previously isolated discs evolving slowly by the Kennicutt-Schmidt (Schmidt, 1959; Kennicutt, 1997) law which can then undergo an interaction or merger to reinvigorate star formation, feed the central black hole and trigger an AGN (Varela et al., 2004; Emsellem et al., 2015). These galaxies would need a large enough gas reservoir to fuel both SF throughout their lifetimes and the recent AGN. These high mass galaxies also play host to the most luminous AGN (mean ) and so this SFH challenges the usual explanation for the co-evolution of luminous black holes and their host galaxies driven by merger growth.
Quenching at early times is also observed within a subsample of the inactive population, where the density for the quenching time is roughly constant until recent times where the distribution drops off. This drop-off occurs at earlier times with increasing mass with a significant lack of quenching occurring at early times for low mass inactive galaxies (right panels Figure 4). This is evidence of downsizing within the inactive galaxy population whereby stars in massive galaxies form first and quench early (Cowie et al., 1996; Thomas et al., 2010).
Some of the most massive agn-host galaxies also show a preference for earlier quenching (bottom left panel Figure 4) occurring at slow rates; we speculate that this is also due to the effects of downsizing rather than being caused by the current AGN. This earlier evolution would first form a slowly ‘dying’ or ‘dead’ galaxy typical of massive elliptical galaxies which can then have a recent infall of gas either through a minor merger, galaxy interaction or environmental change, triggering further star formation and feeding the central black hole, triggering an AGN (Kaviraj et al., 2014). In turn this AGN can then quench the recent boost in star formation. This track is similar to the evolution history proposed for blue ellipticals (Kaviraj et al., 2013; McIntosh et al., 2014; Haines et al., 2015). This SFH would then give rise to the distribution seen within the high mass agn-host population for both time and rate parameters.
These recently triggered AGN in both massive disc and smooth galaxies do not have have the ability to impact the SF across the entirety of a high mass galaxy in a deep gravitational potential (Ishibashi et al., 2012; Zinn et al., 2013). This leads to the lower peak for recent, rapid quenching within the high mass agn-host population for both morphologies.
Conversely, rapid quenching, possibly caused by the AGN itself through negative feedback, is the most dominant history within the low mass agn-host population with lower gravitational potentials from which gas may be more readily expelled or heated (Tortora et al., 2009).
Tortora et al. (2009) model the effects of jet-induced AGN feedback on a typical early type (i.e. smooth) galaxy and observe a drastic suppression of star formation on a timescale of . Comparing their synthetic colours with observed colours of SDSS elliptical galaxies, they find the time between the current galaxy age, and the time that the feedback began, , peaks at . This agrees with the location of the peak in Figure 4 for low mass galaxies which have undergone quenching, where the difference between the peak of the distribution and the average age of the population ( galaxy age is calculated as the age of the Universe at the observed redshift, by assuming all galaxies form at ) is . This implies that this SFH dominated by recent quenching is caused directly by negative AGN feedback.
However, there still remains the possibility that the AGN is merely a consequence of an alternative quenching mechanism. This idea is supported by simulations showing that the exhaustion of gas by a merger fuelled starburst could cause such a rapid quench in star formation and in turn also trigger an AGN (Croton et al., 2006; Wild et al., 2009; Snyder et al., 2011; Hayward et al., 2014). Yesuf et al. (2014) also showed that AGN are more commonly hosted by post starburst galaxies, with the peak AGN activity appearing after the starburst. Such a SFH is not accounted for in the models presented here, however this scenario is still consistent with the results presented in this paper; that AGN which are currently active have been detected in host galaxies after the onset of quenching.
This rapid quenching is particularly dominant for low-to-medium mass smooth galaxies. Smethurst et al. (2015) suggest that incredibly rapid quenching rates could be attributed to mergers of galaxies in conjunction with AGN feedback, which are thought to be responsible for creating the most massive smooth galaxies (Conselice et al., 2003; Springel, Di Matteo & Hernquist, 2005; Hopkins et al., 2008). This dominance of rapid quenching across the smooth agn-host population supports the idea that a merger, having caused a morphological transformation to a smooth galaxy, can also trigger an AGN, causing feedback and cessation of star formation (Sanders et al. 1988).
Within the medium mass agn-host population we see a bimodal distribution between these two quenching histories, highlighting the strength of this method which is capable of detecting such variation in the SFHs within a population of galaxies.
Indeed not all galaxies in the agn-host and inactive samples are quenching, as seen in Figure 3, with a significant proportion of both the agn-host and inactive samples lying on the star forming sequence. A galaxy can therefore still maintain star formation whilst hosting an AGN. The results presented in Section 3 only reflect the trends for galaxies that have undergone or are currently undergoing quenching within a population and can therefore be accurately fit by an exponentially declining SFH. This prevalence of star forming AGN host galaxies, combined with the results above allows us to consider that either: (i) the AGN are the cause of the rapid quenching observed but only in gas-poor host galaxies where they can have a large impact, (ii) the AGN are a consequence of another quenching mechanism but can also be triggered by other means which do not cause quenching, or (iii) the SFR of a galaxy can recover post-quench and return to the star forming sequence after a few Gyr (see recent simulations by Pontzen et al. 2016). Further investigation will therefore be required to determine the nature of this quenching.
We have used morphological classifications from the Galaxy Zoo 2 project to determine the morphology-dependent SFHs of a population of Type 2 Seyfert AGN host galaxies, in comparison to an inactive galaxy population, via a partially Bayesian analysis of an exponentially declining SFH model. We determined the population distribution for the quenching onset time, , and exponential quenching rate, , and find clear differences in the distributions, between inactive and AGN host galaxy populations. We have demonstrated a clear dependence on a galaxy currently hosting an AGN and its SFH for those galaxies which have undergone or are undergoing quenching. There is strong evidence for downsizing in massive inactive galaxies, which appears as a secondary effect in AGN host galaxies. The dominant mechanism for quenched and quenching galaxies currently hosting an AGN is for rapid quenching which has occurred very recently. This result demonstrates the importance of AGN feedback within the host galaxy population, in driving the evolution of galaxies across the colour-magnitude diagram.
Acknowledgements
The authors would like to thank S. Kaviraj and P. Marshall for helpful discussions. We also thank both of the anonymous referees for helpful comments that greatly improved the clarity of the paper.
RJS acknowledges funding from the STFC Grant Code ST/K502236/1. BDS gratefully acknowledges support from Balliol College, Oxford. KS gratefully acknowledges support from Swiss National Science Foundation Grant PP00P2 138979/1. SJK acknowledges funding from the STFC Grant Code ST/MJ0371X/1. KLM acknowledges funding from The Leverhulme Trust as a 2010 Early Career Fellow. KWW acknowledges funding from NSF grant AST-1413610. OIW acknowledges a Super Science Fellowship from the Australian Research Council. Support for this work was provided by the National Aeronautics and Space Administration through Einstein Postdoctoral Fellowship Award Number PF5-160143 issued by the Chandra X-ray Observatory Center, which is operated by the Smithsonian Astrophysical Observatory for and on behalf of the National Aeronautics Space Administration under contract NAS8-03060. The development of Galaxy Zoo was supported by the Alfred P. Sloan Foundation and The Leverhulme Trust. Based on observations made with the NASA GALEX444http://galex.stsci.edu/GR6/ and the SDSS555https://www.sdss3.org/collaboration/boiler-plate.php.
References
- Abazajian et al. (2009) Abazajian, K. N. et al., 2009, ApJS, 182, 543
- Baldry et al. (2006) Baldry, I. et al., 2006, MNRAS, 373, 469
- Baldwin, Phillips & Terlevich (1981) Baldwin, J. A., Phillips, M. M., & Terlevich, R. 1981, PASP, 93, 5
- Bamford et al. (2009) Bamford, S. et al., 2009, MNRAS, 393, 1324
- Blanton et al. (2005) Blanton, M. R. et al., 2005, AJ, 129, 2562
- Blanton & Roweis (2007) Blanton, M. R. & Roweis, S., 2007, AJ, 133, 734
- Bower et al. (2006) Bower, R. et al., 2006, MNRAS, 370, 645
- Brinchmann et al. (2004) Brinchmann, J. et al., 2004, MNRAS, 351, 1151
- Bruzual & Charlot (2003) Bruzual, G. & Charlot, S., 2003, MNRAS, 344, 1000
- Buat et al. (2005) Buat, V. et al., 2005, ApJ, 619, 51
- Cardelli et al. (1989) Cardelli, J. A. et al., 1989, ApJ, 345, 245
- Cisternas et al. (2011) Cisternas, M. et al., 2011, ApJ, 726, 57
- Chabrier et al. (2003) Chabrier, G., 2003, PASP, 115, 763
- Conselice et al. (2003) Conselice, C. J. et al., 2003, AJ, 126, 1183
- Cowie et al. (1996) Cowie, L. et al., 1996, AJ, 112, 839
- Cowie & Barger (2008) Cowie, L. & Barger, A. J., 2008, ApJ, 686, 72
- Croton et al. (2006) Croton, D. J. et al., 2006, MNRAS, 365, 11
- Emsellem et al. (2015) Emsellem, E. et al. 2015, MNRAS, 446, 2468
- Ellison et al. (2016) Ellison, S. et al. 2016, MNRAS, 458, L34
- Fabian (2006) Fabian, A. C. 2006, ARA&A, 50, 455
- Foreman-Mackey et al. (2013) Foreman-Mackey, D., Hogg, D. W., Lang, D., Goodman, J., 2013, PASP, 125, 306
- Haines et al. (2015) Haines, T. et al., 2015, arXiv:1505.01493
- Haring & Rix (2004) Haring, N. & Rix, H-W., 2004, ApJ, 604, 89
- Hayward et al. (2014) Hayward, C. C. et al., MNRAS, 442, 1992
- Hickox et al. (2009) Hickox, R. C., et al., 2009, ApJ, 696, 891
- Hopkins et al. (2008) Hopkins, F. et al., 2008, ApJSS, 175, 390
- Ishibashi et al. (2012) Ishibashi, W. et al., 2012, MNRAS, 427, 2998
- Kauffman et al. (2003a) Kauffman, G. et al., 2003, MNRAS, 341, 33
- Kauffman et al. (2003b) Kauffman, G. et al., 2003, MNRAS, 346, 1055
- Kaviraj et al. (2013) Kaviraj, S. et al., 2013, MNRAS, 428, 925
- Kaviraj et al. (2014) Kaviraj, S. et al., 2014, MNRAS, 440, 2944
- Kennicutt (1997) Kennicutt, R. C., 1997, ApJ, 498, 491
- Kewley et al. (2001) Kewley, L. J. et al., 2001, ApJ, 556, 121
- Kewley et al. (2006) Kewley, L. J. et al., 2006, MNRAS, 372, 961
- Kennicutt, Tamblyn & Congdon (1994) Kennicutt, R. C. Tamblyn, P. & Congdon, C. E., 1994, ApJ, 435, 22
- Ko et al. (2013) Ko, J., 2004, ApJ, 767, 90
- Kormendy & Kennicutt (2004) Kormendy, J. & Kennicutt, R. J., 2004, ARA&A, 42, 603
- Lahav et al. (2000) Lahav, O. et al., 2000, MNRAS 315, L45
- Lintott et al. (2011) Lintott, C. J. et al., 2011, MNRAS, 410, 166
- MacKay (2003) MacKay, D. J. C., 2003, Information Theory, Inference and Learning Algorithms, Cambridge University Press, ISBN 978-0-521-64298-9
- Magorrian et al. (1998) Magorrian, J. et al., 1998, AJ, 115, 2285
- Marconi & Hunt (2003) Marconi, A. & Hunt, L. K., 2003, ApJ, 589, 21
- Martin et al. (2005) Martin, D. C. et al., 2005, ApJ, 619, L1
- Martin et al. (2007) Martin, D. C. et al., 2007, ApJSS, 173, 342
- Masters et al. (2010) Masters, K. et al., 2010, MNRAS, 404, 792
- McIntosh et al. (2014) McIntosh, D. et al., 2014, MNRAS, 442, 533
- Noeske et al. (2007) Noeske, K. G. et al., 2007, ApJ, 660, L47
- Oh et al. (2011) Oh, K. et al., 2011, ApJS, 195, 13
- Oh et al. (2015) Oh, K. et al. 2015, arXiv: 1504.07247
- Padmanabhan et al. (2008) Padmanabhan, N. et al., 2008, ApJ, 674, 121
- Peng et al. (2010) Peng, Y. et al., 2010, ApJ, 721, 193
- Pontzen et al. (2016) Pontzen, A. et al., 2016, arXiv:1607.02507
- Salim et al. (2007) Salim, S. et al., 2007, ApJSS, 173, 267
- Sanders et al. (1988) Sanders, D. B. et al., 1988, ApJ, 325, 74
- Sarzi et al. (2010) Sarzi, M. et al., 2010, MNRAS, 402, 2187
- Schawinski et al. (2010) Schawinski, K. et al., 2010, MNRAS, 711, 284
- Schawinski et al. (2014) Schawinski, K. et al., 2014, MNRAS, 440, 889
- Schmidt (1959) Schmidt, M., 1959, ApJ, 129, 243
- Silk & Rees (1998) Silk, J. & Rees, M. J., 1998, A&A, 331, L1
- Simmons et al. (2011) Simmons, B. D. et al., 2011, ApJ, 734, 121
- Singh et al. (2013) Singh, R. et al., 2013, A&A, 558, 43
- Shimzu et al. (2015) Shimzu, T. et al., 2015, MNRAS, 452, 1841
- Snyder et al. (2011) Snyder, G. F. et al., 2011, ApJ, 741, 77
- Smethurst et al. (2015) Smethurst, R. J. et al., 2015, MNRAS, 450, 435
- Somerville et al. (2008) Somerville, R. S. et al., 2008, MNRAS, 391, 481
- Springel, Di Matteo & Hernquist (2005) Springel, V., Di Matteo, T. & Hernquist, L., 2005, ApJ, 620, L79
- Taylor (2005) Taylor, M. B., 2005, ASP Conference Series, 347
- Thomas et al. (2010) Thomas, D. et al., 2010, MNRAS, 404, 1775
- Tortora et al. (2009) Tortora, C. et al., 2009, MNRAS, 369, 61
- Varela et al. (2004) Varela, J. et al., 2004, A&A, 420, 873
- Weiner et al. (2006) Weiner, B. J. et al., 2006, ApJ, 653, 1049
- Wild et al. (2009) Wild, V. et al., 2009, MNRAS, 395, 144
- Willett et al. (2013) Willett, K. et al., 2013, MNRAS, 435, 2835
- Yan & Blanton (2012) Yan, R. & Blanton, M. R. 2012, ApJ, 747, 61
- Yesuf et al. (2014) Yesuf, H. M. et al., 2014, ApJ, 792, 84
- York et al. (2000) York, D. G. et al., 2000, AJ, 120, 1579
- Zinn et al. (2013) Zinn, P. et al., 2013, ApJ, 774, 66
Appendix A Mass matched INACTIVE sample
Each galaxy in the agn-host sample has been matched to at least one and up to five inactive galaxies. These were matched to within of the stellar mass and of each of the disc and smooth GZ2 vote fractions, and .
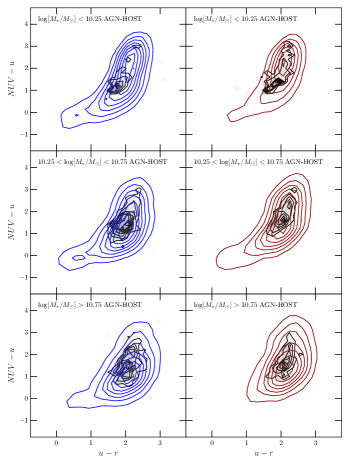
Both the agn-host and inactive galaxy samples are shown on an optical-NUV colour colour diagram in Figure 6. The inactive sample across all mass bins can be seen to encompass the entirety of the colour magnitude diagram, unlike the agn-host sample which reside at increasingly green colours with increasing mass.
Appendix B Luminosity dependence
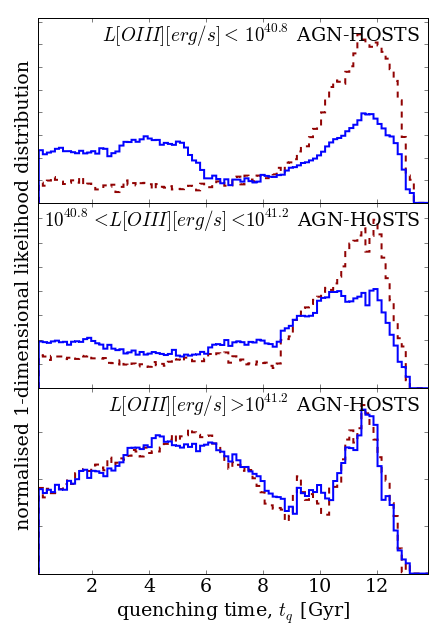

An investigation into the dependence of the quenching in the agn-host sample with was also conducted, with the summed weighted population density distributions for the quenching time and rate parameters shown in Figures 7 & 8. The agn-host sample was split into low, medium and high luminosity as with the stellar mass. Since the of the black hole is correlated to the accretion rate (Kauffman et al., 2003b), which is dependent on the black hole mass, which is in turn correlated to the mass of the host galaxy (Magorrian et al., 1998), the stellar mass was used in the main investigation to allow a direct comparison to the control inactive sample.
Appendix C Alternative Hierarchical Bayesian approach
The approach used in the paper to present the main results shown in Figures 4 & 5, relied upon a visualisation of the SFHs across each population, with no inference involved beyond the use of starpy to derive the individual galaxy SFHs. The preferred approach to this problem would be to use a hierarchical Bayesian method to determine the ‘hyper-parameters’ that describe the distribution of the parent population that each individual galaxy’s SFH is drawn from.
We want the posterior PDF for to describe a galaxy population:
| (2) |
where represents all of the optical and NUV colour data in a population . For one galaxy, , the marginalised likelihood is:
| (3) |
and for all galaxies, , therefore:
| (4) |
Using starpy for individual galaxies we sample from the ‘interim’ posterior which we can relate to so that:
| (5) |
In order to calculate this we draw random samples, , from the interim posterior, so that Equation 5 can be expressed as a sum over a number of random samples, (as with the calculation of an expected mean):
| (6) |
for the sample of total samples taken from one galaxy’s, , interim posterior PDF. This fraction is known as the ‘importance weight’, , in importance sampling.
However, we also have two morphological vote fractions that we can weight by to determine separate hyper-parameters, , for both disc, , and smooth, , galaxies. Therefore:
| (7) |
If we substitute equation 6 into equation 2 we find that the terms cancel and we are left with:
| (8) |
where is the assumed prior on the hyper-parameters, which is assumed to be uniform.
This approach is heavily dependent on what shape is assumed for the hyper-distribution; a decision which is not trivial. It is often common for this function to take the form of a multi-component Gaussian mixture model (MacKay, 2003; Lahav et al., 2000). For example a two component Gaussian mixture model in space is described by eight hyper-parameters for a single morphology, . Here we also assume no covariance between hyper-parameters for simplicity.
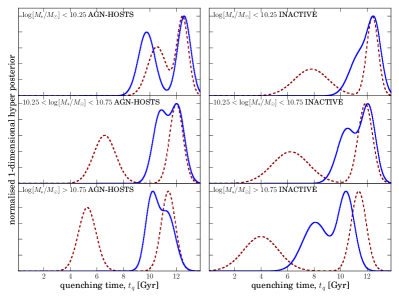
We used this assumption of a two component Gaussian mixture model, to infer the population parameters for both the agn-host and inactive populations and the results are shown in Figure 9. These results were produced by drawing random samples from each galaxy, , in each mass bin. We plot the distributions for a given morphology by taking the median value of the posterior distribution for each of the 8 parameters describing the two component Gaussian mixture. We can see in Figure 9 that this hierarchical method produces similar distributions for the agn-host and inactive samples. This finding is not expected given the differences between the two samples in colour-colour space seen in Figure 6.

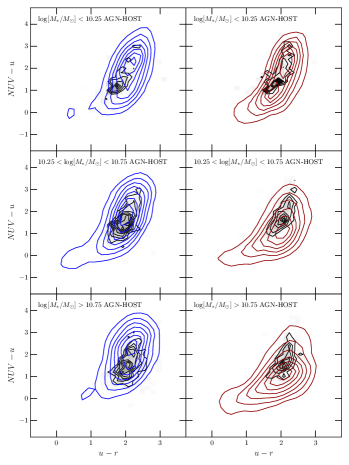
In order to test whether this assumption of a multi-component Gaussian mixture model is appropriate, we sampled the inferred hierarchical distributions to produce replica datasets in optical-NUV colour space. These are shown here in Figure 10 in comparison to the observed colour-colour distributions of the agn-host and inactive samples. For all masses and morphologies the replicated and colours do not accurately match the observed data.


We also varied the value of and found that increasing the number of samples drawn did not improve this fit for either the agn-host or inactive populations. Similarly increasing the number of components in the Gaussian mixture model did not immediately improve the accuracy of the fit. We therefore concluded that this functional form of the population distribution was unsatisfactory. An extensive exploration of a wide variety of functional forms is necessary to ensure the correct conclusions are drawn from the data. Such an investigation is beyond the scope of this paper.
The approach presented in the paper was motivated by the investigation increasing the number of samples, drawn from the posterior of each galaxy, k, until the point where all the samples were drawn. Instead of attempting to infer parameters to describe this distribution, as above, we presented the distribution itself. The distributions produced by this visualisation method, shown in Figures 4 and 5, reveal the complexity that the parent distribution must describe which, as we concluded earlier, cannot be effectively modelled.
We also tested whether this method is reasonable by producing replica datasets in optical-NUV colour space, as before, by drawing values from the unweighted summed distributions presented in Figures 4 and 5. These replica datasets are shown here in Figure 11 in comparison to the observed colour-colour distributions of the agn-host and inactive samples. Comparing these replica colours in Figure 11, with those produced by drawing from the inferred hierarchical distributions, shown in Figure 10, we can see that they produce a more accurate match to the observed data for the majority of masses and morphologies.
We therefore use this visualisation method to display the parent population distribution, rather than quoting inferred values to describe it.