Correspondence E-mail: santoshv@prl.res.in, Telephone: 079-2631 4616
In-orbit performance of AstroSat CZTI
Abstract
Cadmium-Zinc-Telluride Imager (CZTI) is one of the five payloads on-board recently launched Indian astronomy satellite AstroSat. CZTI is primarily designed for simultaneous hard X-ray imaging and spectroscopy of celestial X-ray sources. It employs the technique of coded mask imaging for measuring spectra in the energy range of 20 - 150 keV. It was the first scientific payload of AstroSat to be switched on after one week of the launch and was made operational during the subsequent week. Here we present preliminary results from the performance verification phase observations and discuss the in-orbit performance of CZTI.
keywords:
AstroSat, space observatory, CZTI, hard X-ray spectroscopy1 Introduction
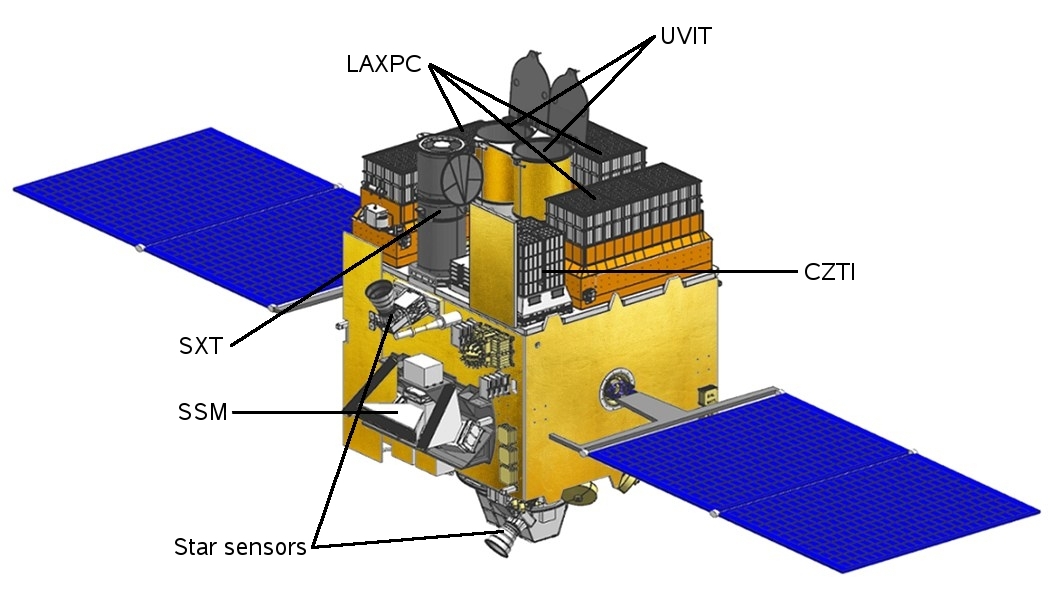
AstroSat is India’s first dedicated satellite mission for multi-wavelength Astronomy [1]. It was launched on September 28, 2015 by Polar Satellite Launch Vehicle PSLV C-30 of the Indian Space Research Organization (ISRO) into 650 km orbit with inclination of 6 degrees. AstroSat carries five instruments: (i) Large Area Xenon Proportional Counter (LAXPC), (ii) Soft X-ray Telescope (SXT), (iii) Cadmium Zinc Telluride Imager (CZTI), (iv) Ultra-violet Imaging Telescope (UVIT) and (v) Scanning Sky Monitor (SSM). The first four instruments are co-aligned to provide simultaneous multi-wavelength observations of astrophysical sources. The SSM is mounted on a rotating platform and scans the sky for detecting new transient X-ray sources as well as to monitor the variability of known X-ray sources. AstroSat also carries an auxiliary instrument - Charge Particle Monitor (CPM) to detect the presence of South Atlantic Anomaly (SAA). Figure 1 shows the location of all instruments of AstroSat in deployed condition.
All instruments on-board AstroSat as well as all satellite subsystems are functioning normally since the launch. The period of first six months after launch was designated as performance verification (PV) phase, which was successfully completed in March 2016. The observations during the PV phase were used to carefully characterize all instruments and to obtain actually realized values for various instrument parameters. The period of next six months (i.e. till September 2016) is reserved for the scientific observations by the instrument teams, which is successfully progressing at present. From October 2016 onwards, AstroSat will be available for guest observations, initially for the Indian astronomers for one year, and subsequently open to all. During this period, AstroSat will be operated as a proposal driven observatory. The nominal lifetime of AstroSat is planned to be five years. Thus it will provide a great opportunity to carry out observations of a variety of astrophysical sources in wavebands ranging from visible to hard X-rays.
Here we present the results of in-orbit characterization of the CZTI instrument carried out with the observations during the PV phase. Section 2 provides the detailed description of the instrument, a brief description of pre-flight calibration is presented in section 3, section 4 discusses the in-orbit operations and in section 5 preliminary results from CZT Imager are presented.
2 CZTI instrument description
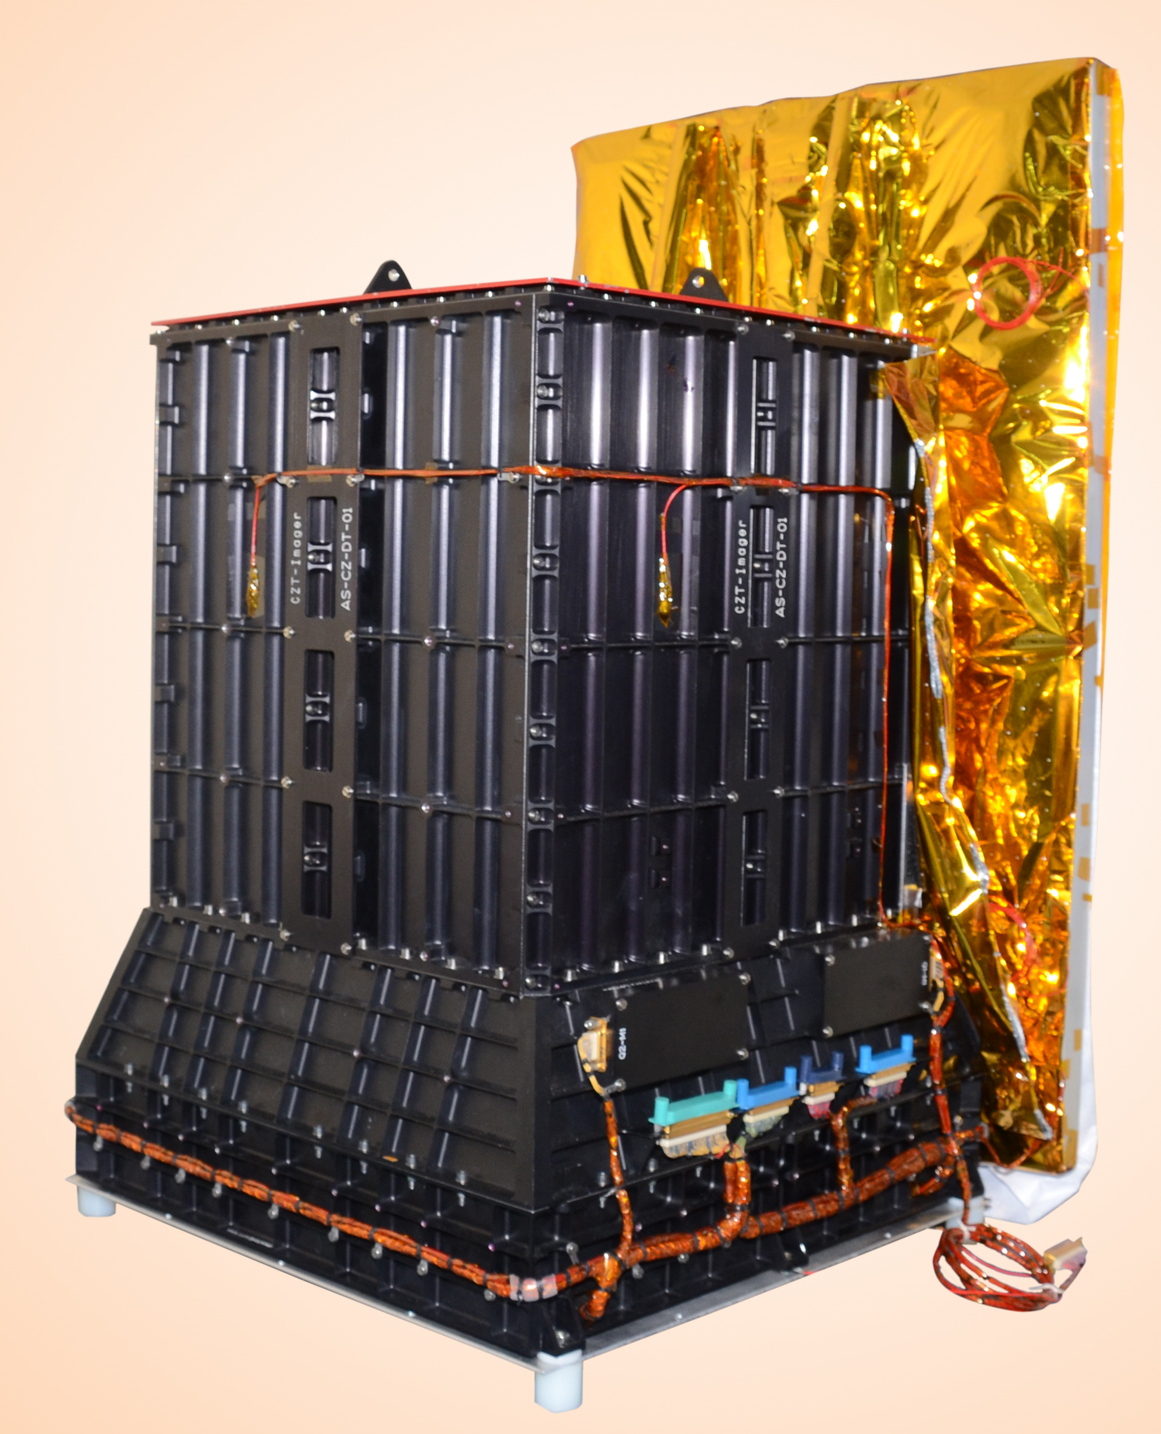
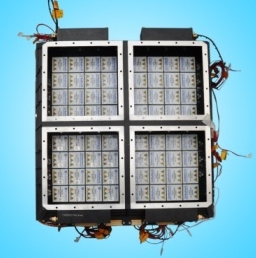
Cadmium Zinc Telluride Imager is a coded aperture telescope with the primary objective of simultaneous imaging and spectroscopy of bright X-ray sources in the hard X-ray band (20-150 keV). It consists of a large area, pixelated detector plane and a two dimensional coded aperture mask (CAM) placed at a distance of 478 mm from the detector plane. It has a total active area of 976 which is achieved by an array of 64 pixelated CZT detector modules. Each detector module is of size and has a pixel array. Each pixel is of size (except the edge and corner pixels which are of slightly smaller dimensions), resulting in a total of 16384 pixels.The whole CZTI instrument is designed as four independent but identical quadrants, each having array of the CZT detector modules and associated coded aperture mask. Figure 2a shows the fully assembled CZTI whereas figures 2b show the CZTI detector plane in the form of four identical quadrants.
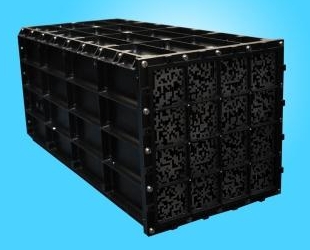
Passive collimators placed in each quadrant, restrict the field of view of the detector array to 4.67∘ x 4.67∘ at energies below 100 keV and support the coded aperture mask as shown in figure 2c. The mask is made of 0.5 mm thick Tantalum plate with open and closed square/rectangular elements of the same size as detector pixels. CZTI employs the box-type mask design where the size of the full mask is same as the detector plane in each quadrant. In such a design, detectors are exposed to the shadow of entire mask only for on-axis sources. At other off-axis locations, only a part of the shadow is recorded by the detectors. The mask patterns are based on 255 element pseudo-noise Hadamard set URAs (Uniformly Redundant Arrays). Seven of sixteen such possible patterns were chosen based on the considerations of mechanical support to each element. Each pattern which has an array of mask elements was used as coded mask for individual detector module and a random arrangement of these into array yielded the pattern for one quadrant. Mask patterns for other three quadrants were obtained by rotation of this mask pattern by 90∘, 180∘ and 270∘. One important aspect of the collimators and mask is that these are designed to be effective up to 100 keV and hence become progressively transparent beyond 100 keV. However, the CZT detectors themselves have significant detection efficiency beyond 100 keV. This enables CZTI to act as an all sky detector at higher energies resulting in the enhanced capability of CZTI as GRB detector as well as hard X-ray polarimeter, as discussed in subsequent sections.
The CZT detector modules, procured from Orbotech medical solutions, operate at near room temperatures. Each CZT detector module has 256 pixels which are read out by two Application Specific Integrated Circuits (ASIC) integrated within the module. Each ASIC has 128 channels consisting of analog chain of preamplifier, shaper, discriminator followed by self-triggering and interface circuitry. For each incident X-ray photon with energy above a set lower threshold, pixel address and pulse height are stored within the ASIC and are subsequently read by the Front-end Electronic Board (FEB) which assigns time stamps to the recorded events. The detector modules are mounted on a thermally conductive plate which is connected to the external radiator plate through heat pipes, so as to maintain the detector modules at temperature in the range of 5∘C - 15∘C.
Each CZTI quadrant has a 20 mm thick scintillator detector (CsI(Tl)) placed below the CZT detector plane, to act as a veto detector. The scintillator is read by photo multiplier tubes from two sides. High energy particles will interact with CZT detectors and then with CsI detector producing simultaneous signals allowing to filter out such events. Each quadrant also has one calibration module placed between the detector plane and base of the collimators. It contains radioactive source embedded in a cesium iodide crystal. The source is a standard source used for calibration of hard X-ray detectors with its mono-energetic X-rays of 59.54 keV. However, the emission of each photon of 59.54 keV in this source is also associated with the simultaneous emission of one alpha particle, which is absorbed by the CsI crystal being read by a photo diode. Thus the event in the CZT detector corresponding to the 59.54 keV photon can be easily identified by simultaneous detection of the alpha particle [2]. These alpha tagged photons are used for continuous in-flight calibration of CZT detectors.
All four quadrants are controlled by a common Processing Electronics (PE) of CZTI which also controls all interfaces with the spacecraft. Event data acquired from the 16 detector modules of each quadrant are packaged by the quadrant wise FEB and sent to the PE every second, which then further re-packages them into larger data frames and sends to spacecraft for on-board storage. Other functions of the FPGA based PE include distribution of power from the satellite to detector quadrants, forwarding telecommands to the detectors, identifying the mode of operation based on telecommand or environment and acquiring the house keeping parameters. PE also has an interface with a GPS based on-board satellite positioning system (SPS). The SPS provides a pulse every 16 seconds with accuracy of 200 ns, which is used for absolute time assignment for individual CZTI events. Though AstroSat is in a low inclination orbit, it has passages through South Atlantic Anomaly (SAA) region of increased particle concentrations. The Charge Particle Monitor (CPM) on-board AstroSat measures particle flux and provides SAA signal to all X-ray instruments including CZTI when particle flux is above a certain threshold. CZTI processing electronics detects this SAA signal and issues commands to turn off detector HV. Control of overall AstroSat spacecraft as well as data down link from all scientific instruments is carried out from the ISRO Telemetry, Tracking and Command Network (ISTRAC) located at Bengaluru. The Payload data is then sent for processing at the payload operation centers (POC) for individual payloads and the higher level data is archived by Indian Space Science Data Center (ISSDC) located at Bylalu. The payload operation center for CZTI is located at the Inter University Center for Astronomy & Astrophysics (IUCAA) at Pune.

3 CZTI pre-flight calibration
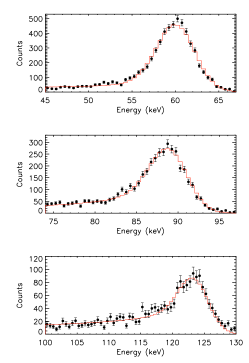
CZTI consists of total 16384 pixels and each pixel is essentially an independent X-ray detector. Thus each individual pixel must be properly characterized in terms various parameters such as energy resolution, relative efficiency, gain, offset etc. This massive exercise was carried out at the Vikram Sarabhai Space Center of ISRO. Each quadrant was tested with three radioactive sources (lines at 22.0 keV and 88.0 keV), (line at 59.54 keV) and (lines at 122.0 keV and 136.0 keV) at five temperates in the range of 0∘ C to 20∘ C with a step of 5∘ C. Spectrum from each pixel was fitted for these energies in order to obtained pixel wise energy resolution, linearity, gain, offset; which were then stored in the calibration database (CALDB) of CZTI. It is well known that the spectrum of a mono-energetic line recorded by CZT detector typically has a strong tail at low energies and thus can not be approximated by a Gaussian shape. Such an asymmetric line shape of the CZT detector can be explained as arising due to the charge trapping and can be quantitatively fitted by a semi-numerical function [3]. The same method, with inclusion of an additional effect of charge sharing, was used to fit the CZTI spectra [4]. Spectra at three energies 59.54, 88.0 and 122.0 keV from each pixel at every temperature were fitted simultaneously to obtain pixel wise parameters such as mobility-lifetime product () for the charge carriers, effective charge sharing radius (), energy resolution etc. Figure 3a show the typical fit at three energies. Since such simultaneous fitting of the semi-numerical function takes a few minutes for one pixel, fitting for the whole data comprising of about 80000 spectra was carried out using the high performance computing facility at Physical Research Laboratory, Ahmedabad. Figure 3b shows the distribution of the four key parameters , , and for all pixels. These parameters are stored in the CALDB and are used to generate the response matrix of the CZTI, full details of which is beyond the scope of this paper and will be presented elsewhere.
4 In-orbit operations
CZTI was the first of the five scientific instruments on-board AstroSat to be switched on. After the absolutely flawless launch on 28th September 2015, the first four days were devoted for monitoring the health and performance of various spacecraft subsystems and all of them were found to be functioning normally.
On the fifth day after the launch, CZTI processing electronics was powered on and the instrument health was monitored for one day. All four quadrants were powered-on one-by-one on the following day. All house keeping parameters were found to be nominal in-orbit and continues to be so till date. The detector temperatures were also found to be within the design limit.
Subsequent three days were devoted for adjusting the detector energy thresholds and disabling noisy pixels. Pixels which were found to be consistently noisy during the ground calibration and testing were already disabled before launch. Some additional pixels were found to be noisy after switching on the high voltage. These were identified and quickly disabled. A stable operation of all four quadrants was achieved within two days. All detector modules were set to the energy threshold of 40 keV prior to launch as a precautionary measure. This was gradually brought down to 20 keV during the initial days. Later in February 2016 thresholds of large fraction of modules were brought down to 15 keV. SAA entry and exit operations were initially being carried out by time tagged ground command, however, later these were automated based on the flag from the CPM and since then these operations are being performed without any fault. On day nine after the launch, AstroSat was pointed to its first astrophysical target, the Crab nebula.
4.1 CZTI ‘bunch-cleaning’
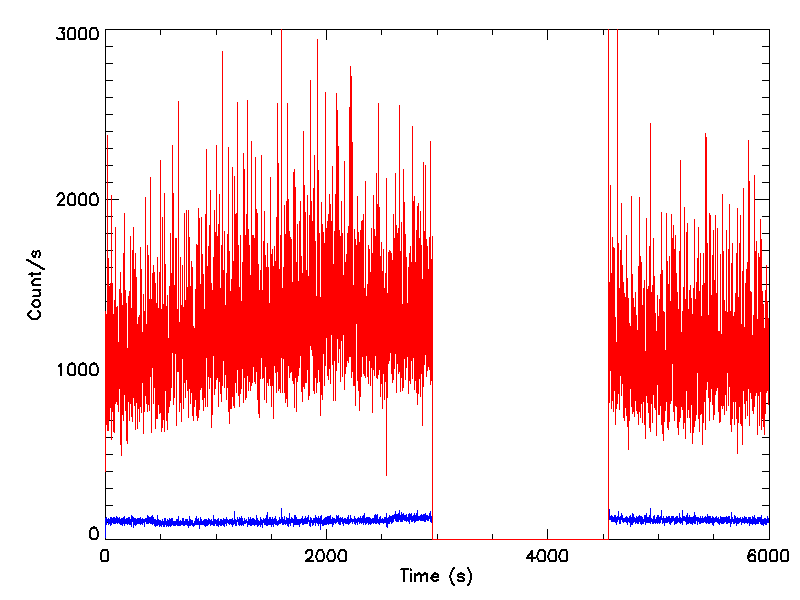
One important observation immediately after switching on the detector HV, was that the observed count rate was much higher than expected. It was further observed that the variance of the observed light curve was much higher than that expected from a Poissonian distribution, indicating that these events were inter-related and not truly random. On a closer inspection it was found that most of these events occur within a very short duration, typically less then 100 micro-second. It was observed that most of the events are thus ‘bunched’ in time, but these ‘bunches’ themselves are random in time. With a detailed analysis of the ‘bunched’ events in terms of both spatial and temporal correlation, these were postulated to be due to the secondaries from a high energy charged particle interaction. High energy charged particles interacting with the instrument or spacecraft body typically produce a shower of secondary particles and X-ray photons. As CZTI is composed of pixelated detectors, each pixel acts as an independent X-ray detector and thus these secondaries can be detected as separate events but very closely spaced in time. Thus one charged particle can produce events in many pixels of CZTI at the same time. Once the origin of the high count rate was understood, we developed appropriate algorithms to identify such multi-hit events and clean the event data. The data reduction pipeline was suitably modified to include these changes. Figure 4 show the effect of the ‘bunch-cleaning’ algorithm. It can be seen that after cleaning the variance in counts is comparable to Poisson level.
One adverse side effect of the bunched events was that they were consuming large data volume which was some times touching the on-board data storage limit for CZTI. These were also increasing the overall volume requirements for the later data analysis as well as storage. Hence after detailed deliberations, it was decided to suppress these events on-board. This was made possible due to the flexibility of the CZTI firmware as well as feasibility of on-board reprogramming. A software patch was developed to identify and reject the ‘bunched’ events. After extensive testing of the patch on ground with qualification model of CZTI PE, it was uploaded in February 2016 to modify the the on-board software on CZTI Processing Electronics. Since then the modified software has been functioning without any issue and the total data volume has been reduced by a factor of four.

4.2 On-board Gain monitoring
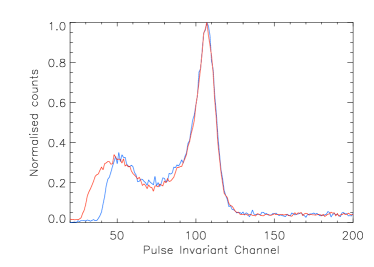
CZT Imager has an on-board calibration source for continuous monitoring of detector gain. The calibration source illuminates the detectors with 59.54 keV photons, which are identified with simultaneous alpha-tag. Along with this fluorescence lines of Tantalum (K line at 57.5 keV and K line at 65.2 keV) provides the in-flight gain calibration. In order to check any gain variation over time, the Alpha-tagged events from all observations are extracted and examined. Figure 5a shows the spectra from on-board calibration source for two different observations separated by approximately eight months, which look nearly identical except for the difference in detector thresholds. Figure 5b show more comprehensive analysis of the alpha-tagged events extracted from large number of observations where the fitted peak channel is plotted as a function of time. It can be seen that, so far the gain of CZTI detectors has not changed significantly.
5 Initial results
The first six month period of AstroSat observation was designated for Performance Verification (PV) and calibration of all the payloads. Observations for performance verification of CZT Imager during these six months were designed to characterize various aspects of the instrument like effective area, coded-mask response, imaging capability, timing capability and off-axis response. Primary target for these observations was the Crab nebula which is widely used as standard candle for hard X-ray instruments. PV phase observations also included other bright sources Cygnus X-1, GRS 1915+105 and Cygnus X-3. Some initial results from these observations are presented here.
5.1 Crab
Crab being the standard candle in hard X-rays has been observed several times by AstroSat during the PV phase. Crab was the first source to be imaged by CZTI. CZTI employs indirect imaging where image is obtained by deconvolution of detector plane histogram with the mask pattern. There are several image reconstruction methods and imaging by FFT is much faster compared to the other methods. Figure 6a shows the image of Crab from CZTI, reconstructed using FFT method. Observations were made with crab at different positions in the field of view to characterize the coded-mask response and imaging performance. These are analyzed to obtain the accurate alignment between the mask and detector pixels.


CZTI records time stamps of photons with an accuracy of 20, and thus allows high time resolution studies. The Crab nebula also hosts the Crab pulsar which has pulse period of 33.5 milli-seconds and thus is a good candidate for establishing the timing capabilities of CZTI. Crab pulse profile generated from barycentric corrected event time stamps is shown in figure 6b. The pulse profile matches well with observations from other instruments in the same energy range. Preliminary analysis with radio ephemeris suggests that absolute time accuracy of CZTI is within 200. Simultaneous observations with GMRT and INTEGRAL is available for some of the PV observations of crab. Detailed analysis is under progress.
Spectral response for CZTI is generated based on modeling extensive ground calibration data. A model based on charge trapping and charge sharing is developed for generation of redistribution matrix. Crab spectrum is used to verify the response of X-ray instruments. In CZTI, background subtracted spectrum is obtained by mask-weighting where photons in each pixel is assigned weights based on the mask open fraction. Mask-weighted spectrum of Crab for an observation with exposure time of 110 ks is shown in figure 6c. The spectrum is fitted with canonical crab spectral model, power law, with 2% systematic error. Fitted power law index 2.09 is consistent with widely accepted value [5], which validates the response matrix of the instrument. Effective area estimation using multiple crab observations is under progress.
5.2 Gamma Ray Bursts
At energies beyond 100 keV CZT Imager acts as an open detector. This provides CZTI with the capability to monitor transient events like Gamma Ray Bursts (GRB). GRBs are most energetic explosions in the universe which makes them detectable at cosmological distances. A typical GRB spectrum peaks at 100 keV to 1 MeV energy range. Observations with CZTI can complement the data from dedicated GRB missions like [6] and [7, 8] to provide broad band spectral coverage.

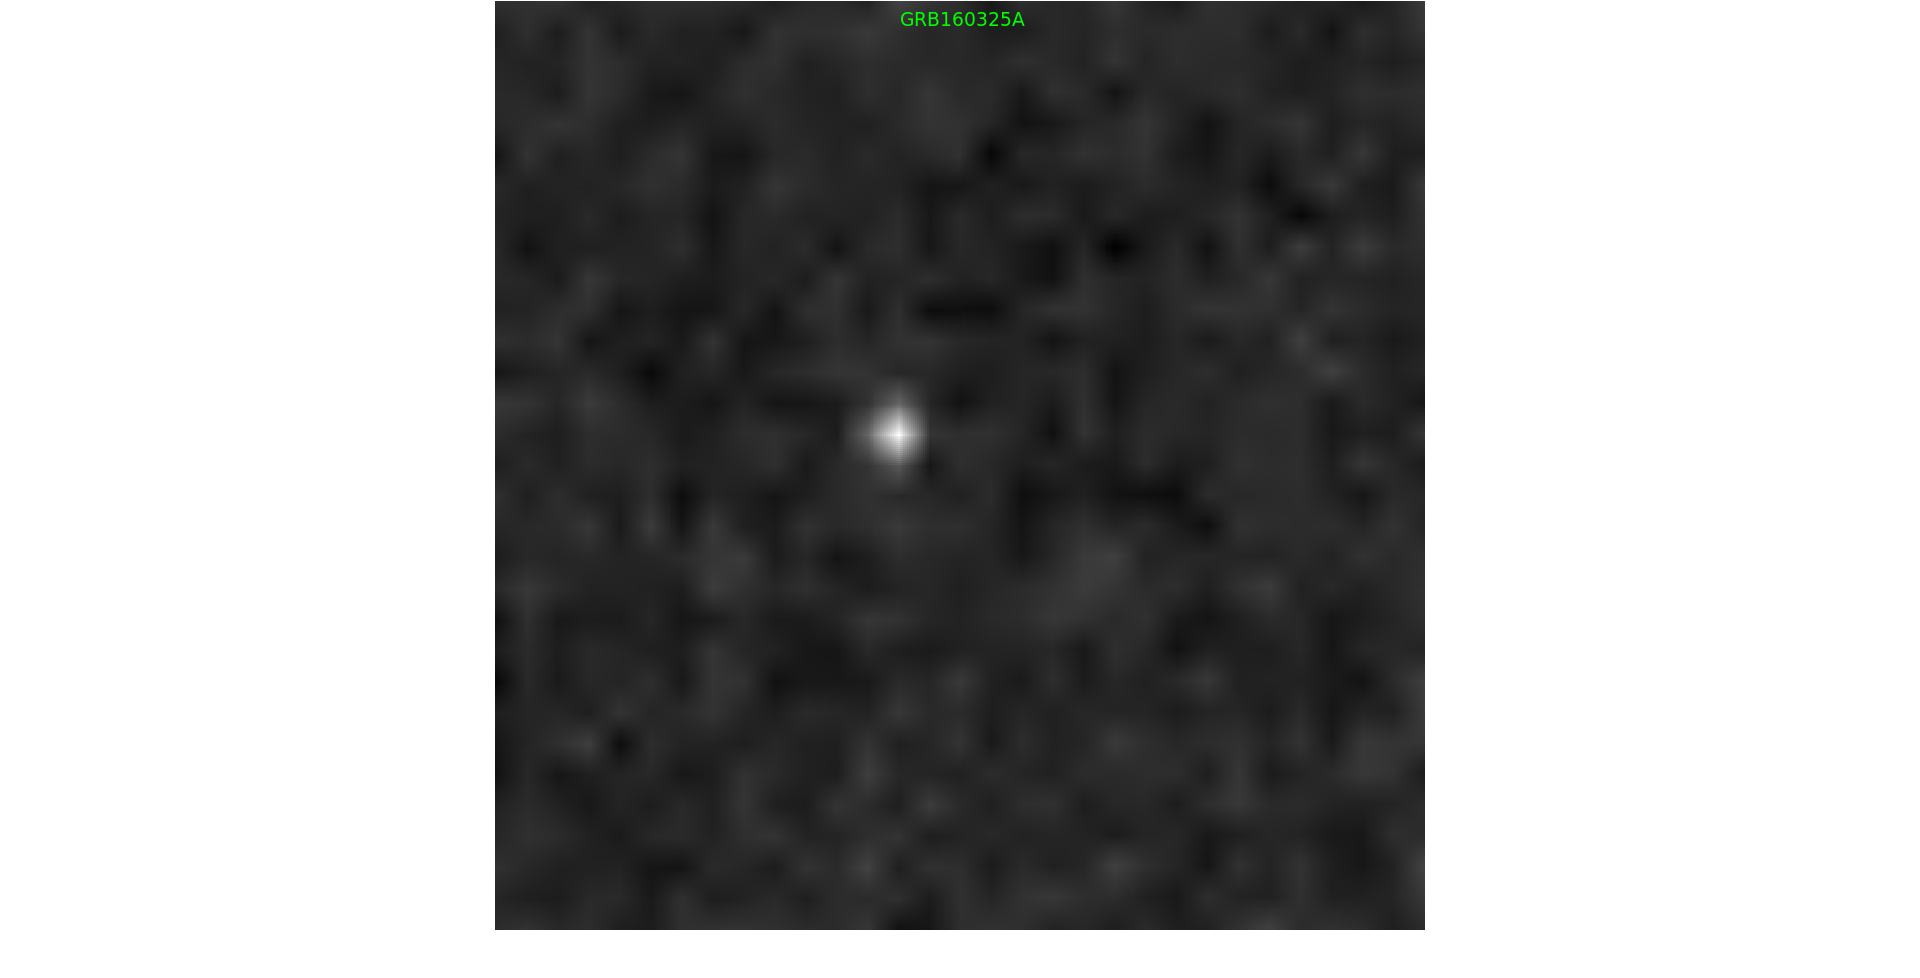
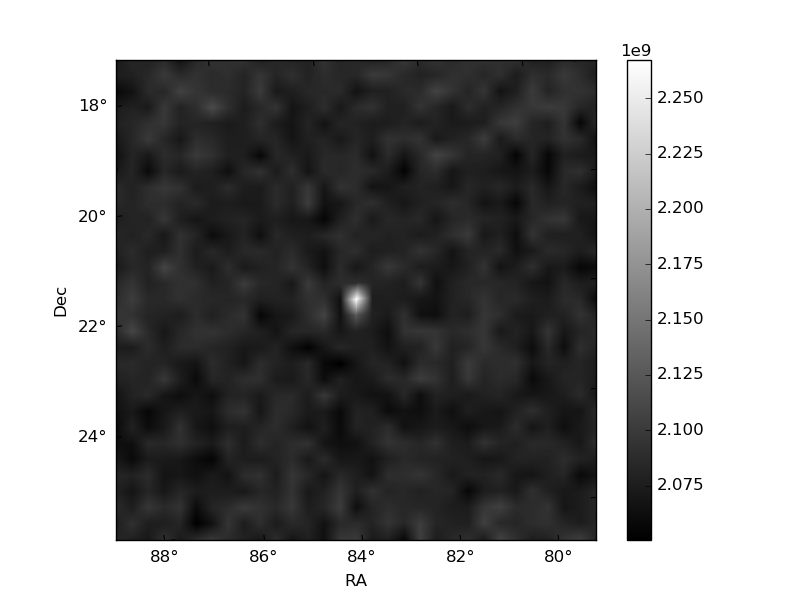
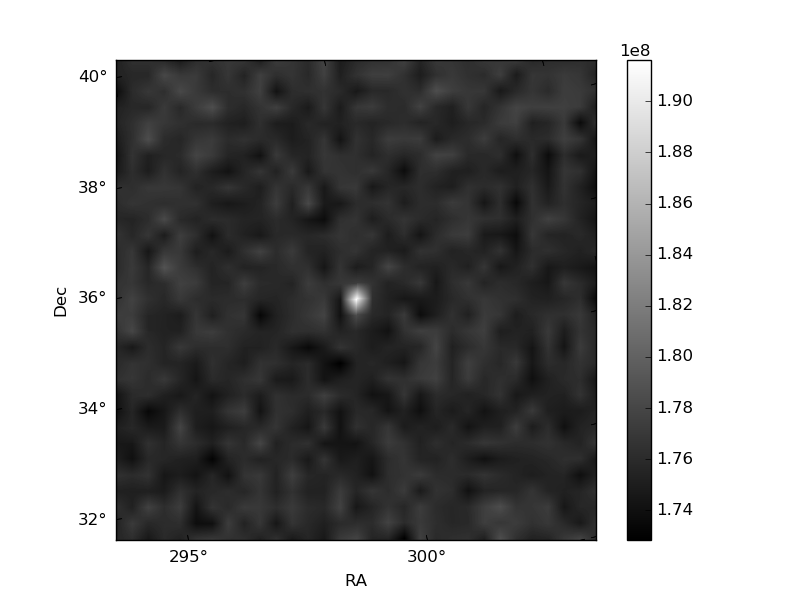
Incidentally, on the first day of observations with CZTI, Swift BAT reported a GRB at 60.7 degrees off-axis to AstroSat pointing direction. This GRB (GRB151006A) was clearly detected by CZTI [9] and the light curve is shown in figure 7a. Detailed broad-band spectral analysis of this GRB is performed and will be reported elsewhere. Since then CZTI has detected 9 GRBs till May 2016. This includes triggered searches and independent detections. One of these GRBs (GRB 160325A) was detected within the primary field of view of CZTI. This allowed accurate localization of the GRB. Image reconstructed by deconvolution is shown in figure 7b, the source coordinates obtained from CZTI matches with the value from Swift. Coarse localization is possible for GRBs which occur outside the primary field of view as well. The collimators cast shadow on the detector plane which can be used to reconstruct the source location.
5.3 Cygnus X-1
It is well known that the wide band X-ray spectra of galactic black hole binaries like Cygnus X-1 consist of various spectral components such as accretion disk emission, reflection component, Comptonized emission, non-thermal power-law etc and the relative contribution of these components vary with the spectral state [10]. Resolving various components of the emission from such systems require sensitive simultaneous broad band spectral measurements at energies ranging from 1 keV to 100 keV. AstroSat with its wide band coverage provides the right kind of observations required.
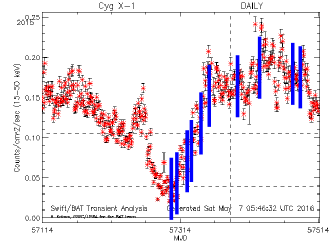
The galactic micro quasar Cygnus X-1 has been observed several times during the PV phase of AstroSat. In figure 8a, CZTI image of Cygnus X-1 in its hard state is shown. Figure 8b shows the Swift BAT monitoring light curve of Cygnus X-1 for about 400 days and AstroSat observation is marked by the vertical lines. Incidentally AstroSat CZTI started its observations when the source was in very peculiar ultra soft state with hard X-ray flux of 150 mCrab. In the last eight months, Cygnus X-1 has undergone transition from ultra soft state to hard state and AstroSat has nicely covered the whole state transition by frequent pointed observations. Spectra from CZTI along with other AstroSat instruments will provide valuable information on the changes in the radiative processes and the accretion geometry during such state transitions. For some of these observations of AstroSat, simultaneous observation by NuStar is also available. Also contemporaneous observations at other wavebands like Infra-red (from Mt. Abu Infrared Observatory) and and Radio (from GMRT) are also available. Detailed analysis is under progress.

5.4 Polarimetry
X-ray polarimetry is a largely unexplored area in the field of X-ray astronomy. Thus exploring any avenue which can provide polarimetric measurements is of great importance. CZTI having pixelated detectors is sensitive to the Compton scattered events which allows polarization measurements in the energy range of 100-300 keV. Polarimetric capability of CZTI has been explored in detail using Monte-Carlo simulations [11] and has also been experimentally verified on ground with the flight module. Detailed study of polarimetric sensitivity shows that sensitive polarization measurements of bright sources like Crab and Cygnus X-1 is possible with CZTI [12].
Gamma Ray Bursts being very bright, are found very useful to validate the criteria applied in the selection of Compton scattered events in CZTI. Figure 9 shows the light curve of Compton scattered double events for GRB160131A. This validates the criterion used in the selection of double events and is a firm demonstration of detection of Compton events from an astrophysical source. Azimuthal distribution of selected Compton events show clear modulation [13]. Further work is under progress to perform detailed mass-modeling of the instrument and satellite which is required to quantify the degree and angle of polarization. Crab and Cygnus X-1 are the other candidates for hard X-ray polarization measurement with CZTI. Both these sources have been extensively observed by AstroSat. Results from the preliminary analysis of data for these sources are very promising and will be reported elsewhere after more detailed scrutiny.
6 Summary
The Cadmium-Zinc-Telluride Imager (CZTI) on-board AstroSat is designed for simultaneous hard X-ray imaging and spectroscopy in energy range of 20 - 150 keV. The full instrument, in terms of both hardware and software, is functioning exactly as designed and is performing very satisfactorily. The enhanced capabilities of CZTI i.e. hard X-ray monitoring and polarimetry in the extended energy range of 100 - 300 keV, are also functioning as per expectation. Detailed characterization of the CZTI imaging, spectroscopic and timing performance has been carried out during the first six months of performance verification observations. During the initial observations, it was found that CZTI is highly sensitive to the ‘particle shower’ like events due to the large number of pixels, resulting in much larger data volume mostly consisting of events useless for the scientific objectives of CZTI. A remedy for this problem has been implemented in the onboard software as well as in the CZTI data processing pipeline. The full data analysis software, including the calibration database (CALDB) and the higher level data products generation software, is fully functional and is released for wider use/testing. Overall the CZTI instrument is performing as per the expectations.
Acknowledgements.
The CZT-Imager is designed and developed with the help of a large number of organisations and teams; the basic design conceptualization, initial development and overall project coordination was carried out by TIFR group, the coded mask design and imaging algorithms were developed by the IUCAA group, instrument mechanical and thermal design was carried out by ISRO Satellite Center (ISAC), assembly and testing was carried out at the Avionics group of Vikram Sarabhai Space Center (VSSC), the pipe-line software was developed at Space Application Center (SAC), the CALDB and the polarimetry algorithms were developed at Physical Research Laboratory (PRL). The CZTI payload operation center is hosted by IUCAA. The authors would particularly like to acknowledge the help received from the AstroSat mission team at ISRO in all aspects of the CZTI realisation and operation. We would also like to acknowledge the support from the Computer center at PRL while using the high performance computing facility Vikram 100.References
- [1] Singh, K. P., Tandon, S. N., Agrawal, P. C., Antia, H. M., Manchanda, R. K., Yadav, J. S., Seetha, S., Ramadevi, M. C., Rao, A. R., Bhattacharya, D., Paul, B., Sreekumar, P., Bhattacharyya, S., Stewart, G. C., Hutchings, J., Annapurni, S. A., Ghosh, S. K., Murthy, J., Pati, A., Rao, N. K., Stalin, C. S., Girish, V., Sankarasubramanian, K., Vadawale, S., Bhalerao, V. B., Dewangan, G. C., Dedhia, D. K., Hingar, M. K., Katoch, T. B., Kothare, A. T., Mirza, I., Mukerjee, K., Shah, H., Shah, P., Mohan, R., Sangal, A. K., Nagabhusana, S., Sriram, S., Malkar, J. P., Sreekumar, S., Abbey, A. F., Hansford, G. M., Beardmore, A. P., Sharma, M. R., Murthy, S., Kulkarni, R., Meena, G., Babu, V. C., and Postma, J., “ASTROSAT mission,” in [Space Telescopes and Instrumentation 2014: Ultraviolet to Gamma Ray ], Proc. SPIE 9144, 91441S (July 2014).
- [2] Rao, A. R., Naik, S., Patil, M., Malkar, J. P., and Kalyan Kumar, R. P. S., “An alpha tagged X-ray source for the calibration of space borne X-ray detectors,” Nuclear Instruments and Methods in Physics Research A 616, 55–58 (Apr. 2010).
- [3] Vadawale, S. V., Shanmugam, M., Purohit, S., Acharya, Y. B., and Sudhakar, M., “Experimental measurements of charge carrier mobility: lifetime products for large sample of pixilated CZT detectors,” in [High Energy, Optical, and Infrared Detectors for Astronomy V ], Proc. SPIE 8453, 84532K (July 2012).
- [4] Chattopadhyay, T., Vadawale, S. V., Rao, A. R., Bhattacharya, D., Mithun, N. P. S., and Bhalerao, V. B., “Line profile modelling for multi-pixel CZT detectors,” in [In this Volume ], Proc. SPIE (2016).
- [5] Kirsch, M. G., Briel, U. G., Burrows, D., Campana, S., Cusumano, G., Ebisawa, K., Freyberg, M. J., Guainazzi, M., Haberl, F., Jahoda, K., Kaastra, J., Kretschmar, P., Larsson, S., Lubiński, P., Mori, K., Plucinsky, P., Pollock, A. M., Rothschild, R., Sembay, S., Wilms, J., and Yamamoto, M., “Crab: the standard x-ray candle with all (modern) x-ray satellites,” in [UV, X-Ray, and Gamma-Ray Space Instrumentation for Astronomy XIV ], Siegmund, O. H. W., ed., Proc. SPIE 5898, 22–33 (Aug. 2005).
- [6] Gehrels, N., Chincarini, G., Giommi, P., Mason, K. O., Nousek, J. A., Wells, A. A., White, N. E., Barthelmy, S. D., Burrows, D. N., Cominsky, L. R., Hurley, K. C., Marshall, F. E., Mészáros, P., Roming, P. W. A., Angelini, L., Barbier, L. M., Belloni, T., Campana, S., Caraveo, P. A., Chester, M. M., Citterio, O., Cline, T. L., Cropper, M. S., Cummings, J. R., Dean, A. J., Feigelson, E. D., Fenimore, E. E., Frail, D. A., Fruchter, A. S., Garmire, G. P., Gendreau, K., Ghisellini, G., Greiner, J., Hill, J. E., Hunsberger, S. D., Krimm, H. A., Kulkarni, S. R., Kumar, P., Lebrun, F., Lloyd-Ronning, N. M., Markwardt, C. B., Mattson, B. J., Mushotzky, R. F., Norris, J. P., Osborne, J., Paczynski, B., Palmer, D. M., Park, H.-S., Parsons, A. M., Paul, J., Rees, M. J., Reynolds, C. S., Rhoads, J. E., Sasseen, T. P., Schaefer, B. E., Short, A. T., Smale, A. P., Smith, I. A., Stella, L., Tagliaferri, G., Takahashi, T., Tashiro, M., Townsley, L. K., Tueller, J., Turner, M. J. L., Vietri, M., Voges, W., Ward, M. J., Willingale, R., Zerbi, F. M., and Zhang, W. W., “The Swift Gamma-Ray Burst Mission,” ApJ 611, 1005–1020 (Aug. 2004).
- [7] Meegan, C., Lichti, G., Bhat, P. N., Bissaldi, E., Briggs, M. S., Connaughton, V., Diehl, R., Fishman, G., Greiner, J., Hoover, A. S., van der Horst, A. J., von Kienlin, A., Kippen, R. M., Kouveliotou, C., McBreen, S., Paciesas, W. S., Preece, R., Steinle, H., Wallace, M. S., Wilson, R. B., and Wilson-Hodge, C., “The Fermi Gamma-ray Burst Monitor,” ApJ 702, 791–804 (Sept. 2009).
- [8] Atwood, W. B., Abdo, A. A., Ackermann, M., Althouse, W., Anderson, B., Axelsson, M., Baldini, L., Ballet, J., Band, D. L., Barbiellini, G., and et al., “The Large Area Telescope on the Fermi Gamma-Ray Space Telescope Mission,” ApJ 697, 1071–1102 (June 2009).
- [9] Bhalerao, V., Bhattacharya, D., Rao, A. R., and Vadawale, S., “GRB 151006A: Astrosat CZTI detection.,” GCN Circ. 18422 (2015).
- [10] Remillard, R. A. and McClintock, J. E., “X-Ray Properties of Black-Hole Binaries,” ARA&A 44, 49–92 (Sept. 2006).
- [11] Chattopadhyay, T., Vadawale, S. V., Rao, A. R., Sreekumar, S., and Bhattacharya, D., “Prospects of hard X-ray polarimetry with Astrosat-CZTI,” Experimental Astronomy 37, 555–577 (Nov. 2014).
- [12] Vadawale, S. V., Chattopadhyay, T., Rao, A. R., Bhattacharya, D., Bhalerao, V. B., Vagshette, N., Pawar, P., and Sreekumar, S., “Hard X-ray polarimetry with Astrosat-CZTI,” A&A 578, A73 (June 2015).
- [13] Vadawale, S. V., Chattopadhyay, T., Mithun, N. P. S., Rao, A. R., Bhattacharya, D., and Bhalerao, V., “GRB160131A: detection of polarisation by Astrosat CZTI.,” GCN Circ. 19011 (2016).