CNRS, IPAG, F-38000 Grenoble, France 3333institutetext: Department of Physics and Astronomy, The University of Leicester, University Road, Leicester, LE1 7RH, United Kingdom 3434institutetext: Nicolaus Copernicus Astronomical Center, ul. Bartycka 18, 00-716 Warsaw, Poland 3535institutetext: Institut für Physik und Astronomie, Universität Potsdam, Karl-Liebknecht-Strasse 24/25, D 14476 Potsdam, Germany 3636institutetext: Friedrich-Alexander-Universität Erlangen-Nürnberg, Erlangen Centre for Astroparticle Physics, Erwin-Rommel-Str. 1, D 91058 Erlangen, Germany 3737institutetext: DESY, D-15738 Zeuthen, Germany 3838institutetext: Obserwatorium Astronomiczne, Uniwersytet Jagielloński, ul. Orla 171, 30-244 Kraków, Poland 3939institutetext: Centre for Astronomy, Faculty of Physics, Astronomy and Informatics, Nicolaus Copernicus University, Grudziadzka 5, 87-100 Torun, Poland 4040institutetext: Department of Physics, University of the Free State, PO Box 339, Bloemfontein 9300, South Africa 4141institutetext: Heisenberg Fellow (DFG), ITA Universität Heidelberg, Germany 4242institutetext: GRAPPA, Institute of High-Energy Physics, University of Amsterdam, Science Park 904, 1098 XH Amsterdam, The Netherlands 4343institutetext: W. W. Hansen Experimental Physics Laboratory, Kavli Institute for Particle Astrophysics and Cosmology, Department of Physics and SLAC National Accelerator Laboratory, Stanford University, Stanford, CA 94305, USA 4444institutetext: Department of Physics, Rikkyo University, 3-34-1 Nishi-Ikebukuro, Toshima-ku, Tokyo 171-8501, Japan 4545institutetext: Department of Physical Sciences, Hiroshima University, Higashi-Hiroshima, Hiroshima 739-8526, Japan 4646institutetext: Now at Santa Cruz Institute for Particle Physics and Department of Physics, University of California at Santa Cruz, Santa Cruz, CA 95064, USA
The supernova remnant W49B as seen with H.E.S.S. and Fermi-LAT
The supernova remnant (SNR) W49B originated from a core-collapse supernova that occurred between one and four thousand years ago, and subsequently evolved into a mixed-morphology remnant, which is interacting with molecular clouds (MC). -ray observations of SNR/MC associations are a powerful tool to constrain the origin of Galactic cosmic-rays, as they can probe the acceleration of hadrons through their interaction with the surrounding medium and subsequent emission of non-thermal photons. The detection of a -ray source coincident with W49B at very high energies (VHE; GeV) with the H.E.S.S. Cherenkov telescopes is reported together with a study of the source with 5 years of Fermi-LAT high energy -ray (0.06 – 300 GeV) data. The smoothly-connected combined source spectrum, measured from 60 MeV to multi-TeV energies, shows two significant spectral breaks at MeV and GeV, the latter being constrained by the joint fit from the two instruments. The detected spectral features are similar to those observed in several other SNR/MC associations and are found to be indicative of -ray emission produced through neutral-pion decay.
Key Words.:
-rays: general – ISM: supernova remnants – ISM: clouds;
∗ Corresponding authors
† Deceased
1 Introduction
The strong shocks associated with supernova remnants (SNRs) are very good candidates for accelerating hadronic Galactic cosmic rays to at least eV through the diffusive shock acceleration mechanism (e.g. Drury, 1983). The detection of very-high energy -rays above TeV in objects such as RX J1713.7-3946 (Aharonian et al., 2006b) or RCW 86 (Aharonian et al., 2009) shows that these objects can accelerate particles up to at least TeV. However, whether the bulk of accelerated particles that radiate in the high energy (HE; GeV) and very-high energy (VHE; GeV) -ray range is of leptonic or hadronic nature is still under debate (Blasi, 2013).
A growing number of SNRs interacting with molecular clouds (SNR/MC) are being revealed in the GeV and TeV -ray domain. This includes W44 (Abdo et al., 2010b), W28 (Aharonian et al., 2008b; Abdo et al., 2010a), CTB 37A (Aharonian et al., 2008a; Castro & Slane, 2010) and IC 443 (Albert et al., 2007; Acciari et al., 2009; Abdo et al., 2010c). Even though isolated SNRs are obviously cleaner laboratories to study cosmic-ray acceleration processes, SNR/MC associations are good candidates to test the presence of hadronic acceleration in SNRs, partly because the HE and VHE -ray emissions from the decay of mesons are expected to be strongly enhanced. The neutral pions, produced when high energy protons (or nuclei) collide with interstellar material, each decay into two rays with equal energies in the pion’s rest-frame. This translates into a steep rise below 200 MeV in the -ray spectral energy distribution (often referred to as the “pion-decay bump”). This characteristic spectral feature has been recently detected at high energies for three interacting SNRs: IC 443, W44 (Ackermann et al., 2013) and W51C (Jogler & Funk, 2016). However, whether this feature is the signature of the acceleration of freshly injected protons may be questioned as re-acceleration of diffuse cosmic rays for a limited time period is also possible (Uchiyama et al., 2010; Cardillo et al., 2016).
In this context, the W49 region, discovered in the 22 cm survey of Westerhout (1958), represents one of the most interesting regions in the Galaxy to study cosmic-ray acceleration. This region contains two remarkable objects: a young SNR (W49B) and a star-forming region (W49A). The SNR W49B (G43.3–0.2) is another example of a SNR/MC association. It is a mixed-morphology (Rho & Petre, 1998) SNR with a bright shell of diameter resolved at radio wavelengths and centrally filled with thermal X rays (Hwang et al., 2000). With a flux density of Jy at GHz, this source is one of the brightest SNRs of the Galaxy at radio wavelengths. Extensive infrared and X-ray studies revealed that W49B’s progenitor was a supermassive star that created a wind-blown bubble in a dense molecular cloud in which the explosion occurred (Keohane et al., 2007). It has recently been shown that W49B’s progenitor experienced a jet-driven core collapse explosion (Lopez et al., 2013; González-Casanova et al., 2014). Observations of mid-infrared lines from shocked molecular hydrogen show that W49B is interacting with molecular clouds. Near-infrared Fe II observations revealed filamentary structures which is evidence of radiative shocks (Keohane et al., 2007). This interaction is also suggested by H I line observations (Brogan & Troland, 2001). The age of the remnant is estimated to be between and years (Moffett & Reynolds, 1994; Hwang et al., 2000; Zhou et al., 2011) and the distance of this object is still not very well constrained. From H I absorption analyses, Radhakrishnan et al. (1972) derived a distance, which Moffett & Reynolds (1994) later re-calculated to be (using an updated Galactic rotation model). Brogan & Troland (2001), using more recent VLA data, have shown that an association of W49B with the nearby star forming region W49A is also possible, extending the range of possible distances ( kpc) for this source. More recently, Zhu et al. (2014) obtained a distance of 10 kpc.
As mentioned above, the other notable component of the W49 region is W49A (Mezger et al., 1967). It is one of the brightest giant radio H II regions in the Galaxy. This star forming region is located in the densest 15 pc of a giant molecular cloud of 100 pc in size. It contains numerous compact and ultra-compact (UC) H II regions and its emission is equivalent to the presence of about O7 stars (Brogan & Troland, 2001). The presence of a very massive star with an initial mass of has been reported by Wu et al. (2014). W49A is associated with a molecular outflow and strong masers (Walker et al., 1982; Scoville et al., 1986), the proper motion of which was used by Zhang et al. (2013) to determine a distance of kpc. Star forming regions are considered as potential VHE -ray emitters since they generally host massive stars which could accelerate particles to VHEs through interactive or collective wind effects. As an example, the TeV -ray source coincident with Westerlund 1 (Abramowski et al., 2012), detected with the High Energy Stereoscopic System (H.E.S.S.), may be the site of such processes.
In the HE domain, a bright source coincident with W49B is detected with the Fermi Large Area Telescope (LAT) (3FGL J1910.9+0906 in the Fermi-LAT 3FGL catalog, Acero et al., 2015)). It was one of the 205 most significant sources after the first three months of observation111It was designated as 0FGL J1911.0+0905 in this so-called Bright Sources List (Abdo et al., 2009a). and is one of the 360 sources detected above 50 GeV in 80 months of data (Ackermann et al., 2016). This source is the subject of a detailed analysis presented in Abdo et al. (2010d). In that paper, the detection of HE -ray emission was reported towards W49B at a significance of with 17 months of data. The authors disfavored a possible pulsar origin for the emission observed towards W49B in the GeV range. Furthermore, from X-ray measurements, the presence of a neutron star as the result of the progenitor star’s collapse appears unlikely (Lopez et al., 2013).
In the present paper, the detection of a source coincident with the SNR W49B in the VHE -ray domain with H.E.S.S. is reported. The analysis of the Fermi-LAT data is applied in this work to 5 years of data using an updated calibration and updated source and background models. The spectral and morphological results in the GeV and TeV regime are discussed in the context of a SNR interacting with a molecular cloud.
2 Data analysis
2.1 H.E.S.S. observations and analysis
2.1.1 H.E.S.S. data set and analysis methods
H.E.S.S. is an array of five imaging Cherenkov telescopes located in the Khomas Highland in Namibia ( S, E), at an altitude of 1800 m above sea level (Hinton, 2004). The fifth telescope was added in July 2012 but observations with the upgraded system are not used in this work. With the initial four-telescope array, rays are detected above an energy threshold of 100 GeV with an angular resolution better than and an energy resolution below .
A standard data quality selection procedure was used to remove observations affected by bad weather or instrumental problems (Aharonian et al., 2006a). Extrapolating the Fermi-LAT -ray spectrum to higher energies, W49B is expected to have a steep spectrum in the TeV range (this is also a common feature for GeV-detected SNRs interacting with molecular clouds). Therefore, observations with an energy threshold above – which can be determined a priori from the observation conditions – were not used in this study. This resulted in a data set comprising hours (live time) of observations towards the W49 region taken from 2004 to 2013 with a mean pointing offset of and a mean zenith angle of . The data set comprises dedicated observations as well as observations of other nearby sources or dedicated to the survey of the Galactic Plane (H.E.S.S. Collaboration et al., 2016).
The data were analysed using the Model Analysis (de Naurois & Rolland, 2009), in which shower images of all triggered telescopes are compared to a pre-calculated model by means of a log-likelihood optimisation. This advanced reconstruction technique improves the sensitivity with respect to more conventional ones. The “Standard cuts” of the Model Analysis were adopted. This set of cuts includes a minimum charge in the shower images of photoelectrons resulting, for this dataset, in an energy threshold of . This set of cuts was used for signal extraction as well as for the spectral and morphological analyses. The results presented in this paper have been cross-checked with the analysis methods described in Ohm et al. (2009) and Parsons & Hinton (2014) and yield compatible results.
2.1.2 H.E.S.S. analysis results
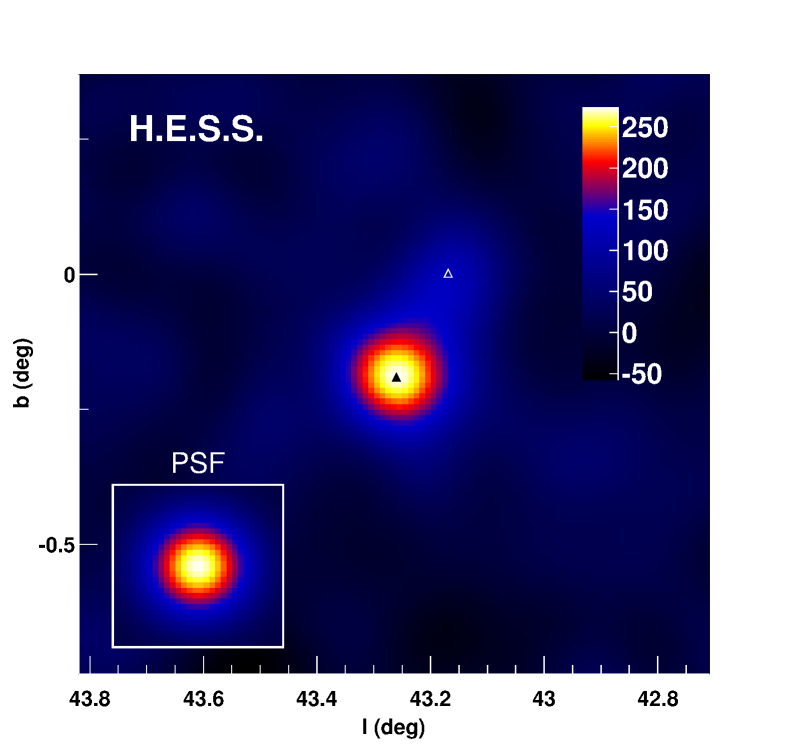
The signal was extracted from a circular region with a radius of around the position of W49B, taken inside the radio shell (at the position of the maximum of the emission in X-rays determined by Hwang et al. (2000)) : . From the correlated excess map, computed using the ring background subtraction method (Berge et al., 2007) and displayed in Fig. 1, a significant excess of VHE -rays is detected at the position of W49B, with a peak significance of (Eq. 17 of Li & Ma, 1983). VHE -ray emission is observed towards W49A with the primary analysis but it could not be confirmed (above ) with the cross-check analysis. Therefore, only the VHE emission coincident with W49B is discussed in the following.
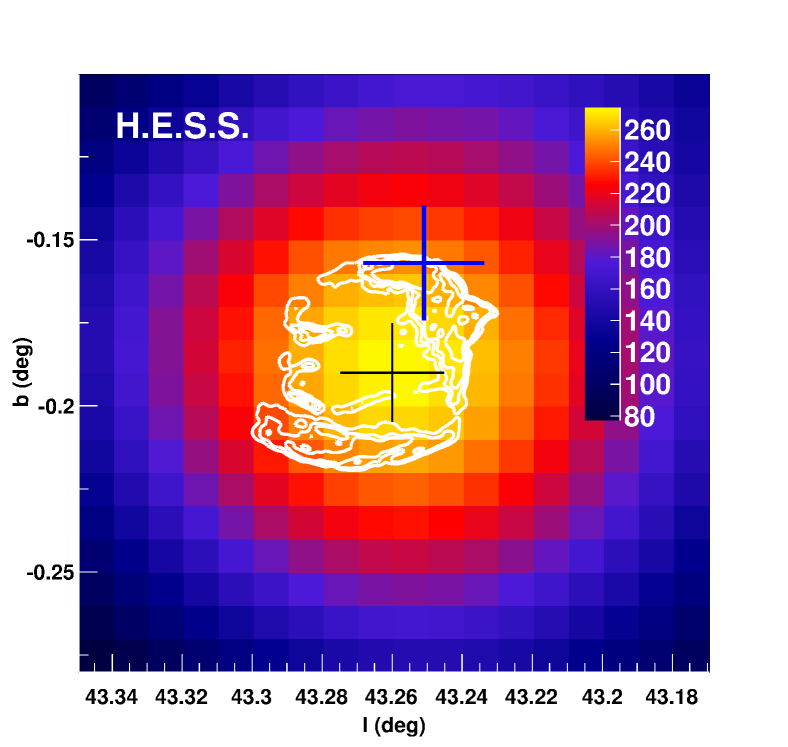
In order to derive the source position at VHE and therefore the best-suited spectral extraction region, the excess map of VHE -rays towards the W49 region was fitted with a two-source model222This is done in order to model the region in the best possible way, given the possible excess towards W49A which is away from W49B (a model with only one source for the fit leads to compatible results). The model is convolved with the H.E.S.S. point spread function before being fit to the measured excess counts.. The VHE -ray emission towards W49B is found to be point-like with a best-fit position of with a systematic error of on each axis. As can be seen in Fig. 2, the obtained position is compatible with the center of the SNR observed in radio and X-rays (e.g. Pye et al., 1984). This position corresponds to , and the detected source is therefore given the identifier HESS J1911+090.
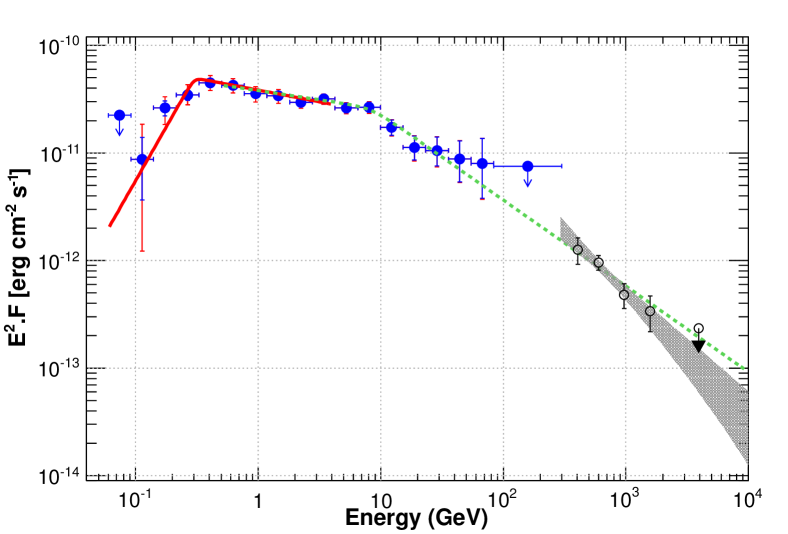
The reflected background subtraction method (Berge et al., 2007) was used at the best fit position to derive the spectrum of the VHE emission coincident with W49B. From a region of radius around this position, the total number of counts is 1141, while 16017 events are used to estimate the background with an average normalisation factor . This corresponds to an excess of events detected with a significance of . The differential energy spectrum is derived above using a forward folding method described in Piron et al. (2001). The data are well described () by a power-law model with a flux normalisation and a spectral index of (see Fig. 3). The integrated flux above 1 TeV is , corresponding to of the Crab Nebula flux above the same energy (Aharonian et al., 2006a). Two other spectral shapes were tested (log parabolic power-law and power-law with exponential cutoff) but they do not fit the data significantly better.
2.2 Fermi-LAT analysis
2.2.1 -LAT observations and data reduction
The LAT detects -ray photons by conversion into electron-positron pairs in the energy range between 20 MeV to higher than 300 GeV, as described by Atwood et al. (2009). It contains a high-resolution converter/tracker (for direction measurement of the incident rays), a CsI(Tl) crystal calorimeter (for energy measurement), and an anti-coincidence detector to identify the background of charged particles. The following analysis was performed using 5 years of Fermi-LAT data collected primarily in survey mode (2008 August 04 – 2013 August 04). This new dataset consists of Pass 7 LAT data that have been reprocessed using updated calibration constants for the detector systems (Bregeon et al., 2013). The primary differences with respect to the Pass7_V6 instrument response functions (IRFs) are the correction of a slight (1% per year) expected degradation in the calorimeter light yield and significant improvement of the position from the calorimeter reconstruction, which in turn significantly improves the LAT point-spread function above 5 GeV. Only rays in the Source class events were selected, excluding those coming from a zenith angle larger than 100∘ to the detector axis to reduce -ray contamination from protons interacting with the Earth’s atmosphere. The version of the reprocessed Pass 7 IRFs for this class of events (P7REP_SOURCE_V15, Bregeon et al., 2013) were adopted.
Two different tools were used to perform the spatial and spectral analysis: and . is a binned maximum-likelihood method (Mattox et al., 1996) implemented in the Science Tools distributed by the Science Support Center (FSSC)333More information about the performance of the LAT can be found at the FSSC ().. is an alternate binned likelihood technique, optimized for characterizing the extension of a source, something that is not implemented in . was extensively tested against (Lande et al., 2012). These tools fit a source model to the data along with models for isotropic -ray emission that also accounts for the residual charged particles and a diffuse -ray emission model. The obtained log likelihood is then compared between different source model assumptions to find an optimal description of the region. For quantitative evaluation between models, the test-statistic value () was defined as , where corresponds to the likelihood value for the source/no-source hypothesis (Mattox et al., 1996). The TS value is a measure of the detection significance or description improvement.
For this work, the Galactic diffuse emission model
gll_iem_v05_rev1.fits and isotropic diffuse model
iso_source_v05.txt provided by the Fermi-LAT
collaboration were used444These models are available at:
http://fermi.gsfc.nasa.gov/ssc/data/access/lat/BackgroundModels.html. A
20 20 region of interest binned in 0.1
bins and centered on the position of W49B, was defined. Sources within
25∘ of W49B were extracted from the Fermi-LAT 3FGL
catalog (Acero et al., 2015) and included in the likelihood fit. The spectral
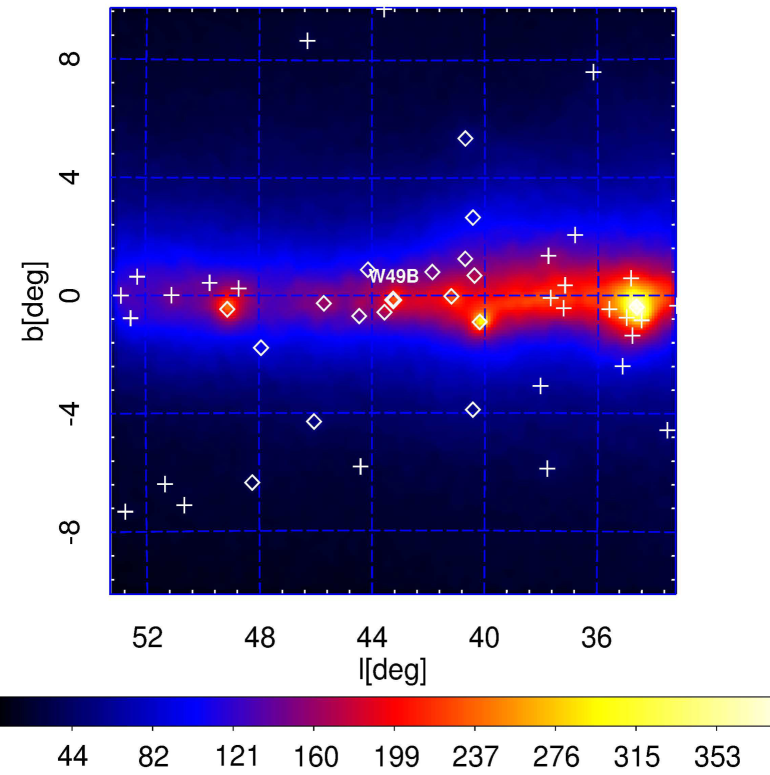
parameters of sources closer than 5∘ to W49B or with a TS
larger than 400 were left free and shown with diamonds in
Fig. 4, while the parameters of all other sources
were fixed at the values from the 3FGL catalog.
Two main systematic errors have been taken into account: imperfect modeling of the Galactic diffuse emission and uncertainties in the effective area calibration. The first was estimated by comparing the results obtained using the standard Galactic diffuse model with the results based on eight alternative interstellar emission models (IEMs) as performed in de Palma et al. (2013). We note that the alternative IEMs do not necessarily bracket the standard IEM but provide a good insight into deviations from fit results obtained by the standard IEM expected due to variations in the IEM. Comparing results between analyses performed using the standard and alternative IEMs is currently the best method to estimate systematic uncertainties related to the IEM modeling. The second major systematic uncertainty was estimated by using modified IRFs whose effective areas bracket the nominal ones. These bracketing IRFs are defined by envelopes above and below the nominal energy dependence of the effective area by linearly connecting differences of (10%, 5%, 5%, 15%) at of (2, 2.5, 4, 6), respectively555http://fermi.gsfc.nasa.gov/ssc/data/analysis/LAT_caveats.html.
2.2.2 -LAT analysis results
The spatial analysis was performed using all events above 1 GeV, thus providing a good compromise between statistics and angular resolution. The source position, determined by is with a statistical uncertainty of (95% CL), compatible with the radio shell of W49B (see Fig. 2). At this position, the TS value above 1 GeV is 1504. No significant extension was found with .
The spectral analysis was then performed with including all events between 0.06 and 300 GeV. Here the best fit point-source position for W49B obtained by was used in the log likelihood fit. Figure 3 shows the spectral energy distribution obtained for W49B through the maximum likelihood estimation. To derive the flux points, the 0.06 – 300 GeV range was divided into 20 logarithmically-spaced energy bins and a maximum likelihood spectral analysis was performed in each interval, assuming a power-law shape with a fixed spectral index of = 2 for W49B. The normalizations of the diffuse Galactic and isotropic emission were left free in each energy bin as well as those of sources located within from W49B. A 95% CL upper limit is computed when the statistical significance is lower than . At the highest energies, bins containing no significant signal were combined to compute a meaningful upper limit. The errors on the spectral points represent the statistical and systematic uncertainties added in quadrature.
The spectrum below 300 MeV is steeply rising, clearly exhibiting a break at around 300 MeV. To quantify the significance of this spectral break, a log likelihood fit of W49B between 60 MeV and 4 GeV was performed – below the high-energy break previously found in the 1-year spectra (Abdo et al., 2010d) – with both a single power law of the form and a smoothly broken power law of the form where is the differential flux at MeV and , as was done previously for the cases of IC 443 and W44 (Ackermann et al., 2013). The improvement in log likelihood when comparing the broken power law to a single power law corresponds to a formal statistical significance of for the low-energy break (TS of 84 for 2 additional degrees of freedom), as reported in Table 1. Another fit in the same energy band using a log-parabola was also performed, showing that the log-parabola improves the likelihood by only (TS of 28 for 1 additional degree of freedom). Therefore the best spectral shape for this energy band is the broken power law.
| Model | Source TS | ||||
|---|---|---|---|---|---|
| Fermi-LAT: | |||||
| 60 MeV – 4 GeV: | (MeV) | ||||
| PL | 906 | ||||
| SBPL | 990 | ||||
| 500 MeV – 300 GeV: | (GeV) | ||||
| PL | 1570 | ||||
| SBPL | 1584 | ||||
| H.E.S.S.: | |||||
| ¿290 GeV: | |||||
| PL | |||||
| Fermi-LAT & H.E.S.S.: | |||||
| 500 MeV – 10 TeV: | (GeV) | ||||
| SBPL |
2.3 H.E.S.S. and Fermi-LAT combined results
The best-fit position obtained with the Fermi-LAT is coincident with the radio shell while the fitted position in the TeV range is more compatible with its center (see Fig. 2). However, the size of the shell detected at radio wavelengths is comparable to the size of the H.E.S.S. point spread function, preventing the discrimination between the emission originating from the center of the remnant or from its shell. Furthermore, the spectra derived in the GeV and TeV energy ranges are in good agreement (see Fig. 3). The positions and spectra are also compatible with those reported in the recently published second Fermi-LAT catalog of sources above 50 GeV (Ackermann et al., 2016). It is therefore reasonable to assume that the detected -ray photons are emitted in the same physical region of the W49B remnant.
Taking advantage of the smooth connection between the HE and VHE spectra, the presence of another break at high energy was evaluated through a likelihood ratio test statistic applied to both the H.E.S.S. and Fermi-LAT data. For this test, a single power-law and a smoothly broken power-law between 500 MeV and 10 TeV – above the low energy break found above – were used and the statistical and systematic uncertainties have been taken into account. The minimum of the likelihood ratio is reached at 8.4 GeV with a improvement of the smoothly broken power-law model with respect to the power-law one. The 68% confidence interval is [5.9; 10.6] GeV and the spectral indices below and above the break are respectively and . This result has been checked by fitting the Fermi-LAT fluxes of W49B between 500 MeV and 300 GeV with both a single power-law and a smoothly broken power-law. A (TS of 14 for 2 additional degrees of freedom) improvement is obtained for an energy break at GeV. This energy, as well as the spectral indices above and below the break (listed in Table 1), are compatible with the values obtained from the Fermi-LAT and H.E.S.S. joint fit.
3 Discussion of the results
3.1 General considerations
A spectral break is detected at MeV with the Fermi-LAT, with properties (break energy, spectral indices) similar to those detected in the SNRs IC 443 and W44 (Ackermann et al., 2013) and interpreted as the signature of -ray emission produced through neutral-pion decay. In addition, the H.E.S.S. and Fermi-LAT joint spectral fit allowed for the estimation of a second spectral break at GeV, compatible with the break energy position found using the Fermi-LAT data alone ( GeV). Such a spectral break has been found in several other interacting SNRs, as for instance in W51C (Abdo et al., 2009b), W28 (Abdo et al., 2010a) or G349.7+0.2 (H.E.S.S. Collaboration et al., 2015). The energy at which this break occurs is found to be in the range GeV, except for G349.7+0.2 where it is found at a higher energy ( GeV). Interestingly, while W49B is estimated to be thousand years old, it exhibits spectral features similar to the other detected SNR/MC systems which are believed to be times older. Likewise, G349.7+0.2 which has roughly the same age as W49B, shows an energy break which is times higher. This emphasises the importance of the environment in the evolution of the -ray luminosity of these objects.
The origin of the break in the GeV range has been the subject of several theoretical works. It could be explained either by the diffusion of particles escaping the shock (e.g. Ohira et al., 2011; Li & Chen, 2012), by acceleration and wave evanescence effects (e.g. Inoue et al., 2010; Malkov et al., 2012), or time-limited re-acceleration of CRs already present in the surroundings (e.g. Uchiyama et al., 2010; Cardillo et al., 2016). Other phenomena might be at play in such objects, such as a so-called neutral return flux that can modify the dynamics of the shock when propagating into a partially neutral medium (Blasi et al., 2012). The maximum energy that accelerated particles can achieve could be limited by the ion-neutral damping (Ptuskin & Zirakashvili, 2005) and their spectrum could be steepened due to the feedback of amplified magnetic fields (Ptuskin et al., 2010; Caprioli, 2012). Future precision modeling may be able to take the whole history and environment of W49B into account to predict the spectra of accelerated particles in this source and resultant radiation from radio to TeV energies. In this work, a simple one-zone model that assumes an empirical distribution of accelerated particles is used specifically to constrain the energetics and the dominant processes in the source.
3.2 Molecular gas density estimates
In order to use appropriate values for the modeling, the mass and density of the molecular gas inside a spherical volume of radius , consistent with that of the radio SNR radius, were estimated using the Galactic Ring Survey data (Jackson et al., 2006). For the three velocity ranges (1-15, 38-47 and 57-67 km/s at their kinematic distances of 11, 9.3 and 5 kpc respectively) examined by Zhu et al. (2014) (see also Chen et al. (2014)), and using the “X-factor” of from Simon et al. (2001), masses of to with densities of 400 to 4 000 cm-3 were obtained. Allowing for a larger radius to the outer edge of the radio SNR features () reduces the molecular gas densities by a factor 2 to 3.
One can note that Chen et al. (2014) and Zhu et al. (2014) have argued that the CO bubble in the 38-47 km/s range was blown out by the W49B progenitor star, suggesting a distance of about 10 kpc for the SNR. Additionally for this, and the 57-67 km/s ranges, the column densities (about ) inferred in this work are consistent with that derived from the X-ray spectral studies of Keohane et al. (2007).
3.3 High-Energy Particles in W49B
The observed -ray emission is most likely to originate from SNR W49B, as discussed in Abdo et al. (2010d). In this section, the properties of the relativistic particles that radiate at -ray energies are investigated. Given the smooth connection of the observed Fermi-LAT and H.E.S.S. spectra (see Fig. 3), it is assumed that the -ray photons are emitted in the same region. In addition, the observed radio emission (e.g. Moffett & Reynolds, 1994) is assumed to come from the same shell region where a constant hydrogen density and magnetic field strength are considered. Given the evidences that W49B interacts with the surrounding molecular clouds (e.g., Keohane et al., 2007; Zhu et al., 2014), we consider a scenario where the -ray emission comes from the shocked molecular clouds in the SNR shell. Note that the emitting region may originate from swept-up stellar wind and/or interstellar gas as discussed in Abdo et al. (2010d). However, adopting such a scenario would not significantly change the spectra calculated in this section.
The -ray emission is reproduced using the (relatively) simple model described in Abdo et al. (2009b). Empirical injection distributions of protons and electrons are assumed:
| (1) |
where , is the break momentum, is the spectral index below and is the difference between the spectral indices values below and above . The kinetic equation for the momentum distribution of high-energy particles in the shell can be written as:
| (2) |
where is the momentum loss rate (only the radiative losses – synchrotron, inverse-Compton, bremsstrahlung and neutral pion decay – were considered), and (assumed to be time-independent) is the particle injection rate. To obtain the radiation spectrum from the remnant, is numerically calculated for yr.
The -ray emission mechanisms include the -decay rays due to high-energy protons, bremsstrahlung and inverse-Compton scattering processes by high-energy electrons. The radio emission is calculated by considering the synchrotron radiation from the population of high-energy electrons. To reproduce the multi-wavelength spectra, two cases for the relativistic electrons to protons number ratio () were considered, and . The value of 0.01 is similar to what is locally observed for cosmic rays at GeV energies (e.g., Beischer et al., 2009) whereas corresponds to an upper limit of the ratio that is most likely too high for realistic applications due to the faster cooling of the electrons compared to protons. In the calculation, the same indices and break momenta for both the electrons and the protons were chosen. Given that the radio synchrotron index (Moffett & Reynolds, 1994) corresponds to , three values for were considered: 1.8, 2.0, and 2.2. The observed -ray spectra are calculated by adjusting spectral parameters of the relativistic particles: the normalization, the break momentum , and . The magnetic field is then determined to explain the observed radio data. Only thermal X-rays, which are not useful in constraining the non-thermal electron population energy distribution, are observed from the SNR (Hwang et al., 2000). In the energy range 1–10 keV, our model synchrotron X-ray predictions would be at least one order of magnitude below the measured thermal X-ray values; thus no constraining limits exist in this part of the spectrum. Two conservative cases of 100 cm-3 and 1000 cm-3 for the ambient medium density were considered (see Sec. 3.2). The seed photons for inverse-Compton scattering processes include infrared ( eV, ), optical ( eV, ), and the CMB. These values were taken to match the axisymmetric estimates of the GALPROP code at the assumed distance of W49B (Porter et al., 2008, and references therein). For a more precise modeling, dedicated analysis of the infrared and optical emission around the source should be performed. The derived parameters and spectra are shown in Tables 2 and 3, and Figs. 5 and 6.
| Model | ||||||
|---|---|---|---|---|---|---|
| () | (GeV ) | (G) | ( erg) | |||
| (a1) | 100 | 1.8 | 1.0 | 15 | 100 | 12 |
| (a2) | 100 | 2.0 | 0.8 | 30 | 100 | 11 |
| (a3) | 100 | 2.2 | 0.7 | 100 | 90 | 12 |
| (a4) | 1000 | 1.8 | 1.0 | 15 | 500 | 1.1 |
| (a5) | 1000 | 2.0 | 0.8 | 30 | 500 | 1.1 |
| (a6) | 1000 | 2.2 | 0.7 | 100 | 400 | 1.1 |
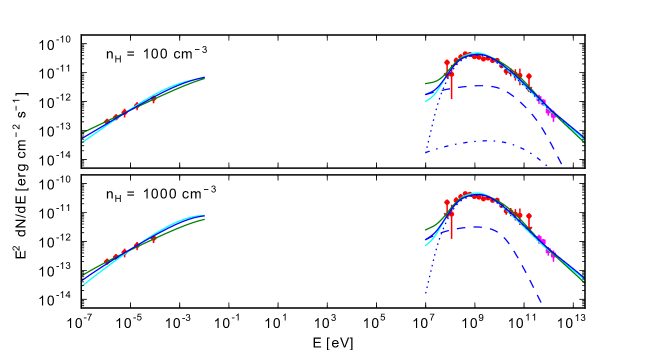
In the case of (the hadronic scenario), the obtained -ray spectrum is dominated by the -decay emission due to the relativistic protons as shown in Fig. 5. The observed spectra can be formally explained in all the cases except for the case (a4) where the reproduced synchrotron spectrum seems a little harder than the observed radio data. The rather high values derived for the magnetic field of models (a4–6) are needed to explain the radio data. This is due to the fact that is fixed to , allowing for higher values of would imply higher total kinetic energies for the electrons and lower magnetic field values would be needed to explain the radio data.
Note that the reproduced spectral shape is independent of the value of , as long as the range is set to reasonable values ().
| Model | ||||||
|---|---|---|---|---|---|---|
| () | (GeV ) | (G) | ( erg) | |||
| (b1) | 100 | 1.8 | 1.1 | 7 | 22 | 1.6 |
| (b2) | 100 | 2.0 | 0.9 | 10 | 25 | 1.6 |
| (b3) | 100 | 2.2 | 0.8 | 30 | 22 | 2.0 |
| (b4) | 1000 | 1.8 | 0.9 | 7 | 100 | 0.16 |
| (b5) | 1000 | 2.0 | 0.7 | 10 | 100 | 0.16 |
| (b6) | 1000 | 2.2 | 0.5 | 15 | 90 | 0.19 |
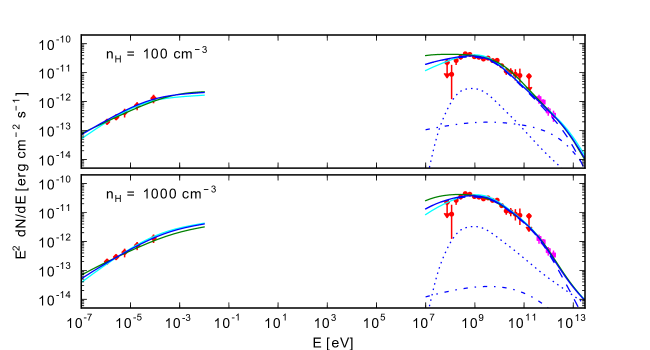
In the case of (the leptonic scenario), the obtained rays are dominated by the bremsstrahlung emission due to the relativistic electrons as shown in Fig. 6. The figure shows that is required to explain the LAT data below MeV. The synchrotron radiation loss modifies the reproduced spectra at the range; its break momentum of the electrons are 16 TeV and 0.6 TeV for of 20 G (corresponding to the cases (b1–3)) and 100 G (corresponding to the cases (b4–6)) respectively. On the other hand, the spectral shape does not significantly change in the energy band below the break.
As discussed in Sect. 2.2, the LAT data show a clear spectral break at MeV. Given the systematic errors of the data, both the hadronic and the leptonic scenarios can explain this spectral shape. In the leptonic scenario, however, a limit to the spectral index of must be set to reproduce such a sharp break. On the other hand, the hadronic scenario can naturally explain the break by the -decay bump irrespective of the spectral index. The obtained B-field values in Table 2 and 3 are significantly larger than typical interstellar values. To some extent, these values correspond to those expected in a MC (Crutcher et al., 2010). They are also consistent with predictions of magnetic field amplification from cosmic-ray-excited turbulence (Bell, 2004; Zirakashvili et al., 2008). The values adopted in this modeling are set to reasonable values and different assumptions for the parameters (age, distance, , ) would slightly change the quantitative results of the modeling (derived magnetic field or energy values) but would not change these conclusions.
4 Conclusions
A source of very-high energy rays is detected towards the supernova remnant W49B with H.E.S.S. and a joint study is conducted together with the analysis of 5 years of Fermi-LAT data towards the source. The point spread functions of these instruments are comparable to the physical size of the SNR and do not allow for detailed morphology studies. However, the significantly increased data set compared to previous publications allowed for the derivation of the -ray spectrum of the source between 60 MeV and a few TeV. Two spectral breaks could be identified in the -ray spectrum: one at 304 MeV and the other at 8.4 GeV. The latter, constrained from a joint fit of the Fermi-LAT and H.E.S.S. data, is similar to the spectral breaks observed in other supernova remnants interacting with molecular clouds and further supports the evidence of interaction observed in other wavelengths for this object. The broad band spectrum of W49B could be explained either by leptonic or hadronic models. However, the sharp break detected with the Fermi-LAT data at 304 MeV seems to favor a hadronic origin of the -ray emission since the leptonic models would require an even harder spectrum for the electron population than the ones tested in this work which would fail to explain the radio observations.
In the near future, W49B as well as the nearby star forming region W49A will be of particular interest to study at VHE with improved analysis methods and with the next generation of instruments such as the Cherenkov Telescope Array. Observations or analyses of the W49 region with improved angular resolution and higher sensitivity would help to constrain the morphology and the origin of the emission towards W49B and possibly confirm the hint of emission towards W49A. Furthermore, if one assumes that the distances to W49A and W49B are comparable, then the observed difference between the -ray luminosities of the two sources would become especially interesting. It would imply that in the absence of recognizable supernova remnants – as in W49A – the other possible energetic particle sources like the shocks expected from interacting or collective stellar winds appear not very effective for HE and VHE -ray emission in this case. Therefore, a truly reliable distance determination for these sources (see Sect. 1) would be of great astrophysical importance.
Acknowledgements.
The support of the Namibian authorities and of the University of Namibia in facilitating the construction and operation of H.E.S.S. is gratefully acknowledged, as is the support by the German Ministry for Education and Research (BMBF), the Max Planck Society, the German Research Foundation (DFG), the French Ministry for Research, the CNRS-IN2P3 and the Astroparticle Interdisciplinary Programme of the CNRS, the U.K. Science and Technology Facilities Council (STFC), the IPNP of the Charles University, the Czech Science Foundation, the Polish Ministry of Science and Higher Education, the South African Department of Science and Technology and National Research Foundation, the University of Namibia, the Innsbruck University, the Austrian Science Fund (FWF), and the Autrian Federal Ministry for Science, Research and Economy, and by the University of Adelaide and the Australian Research Council. We appreciate the excellent work of the technical support staff in Berlin, Durham, Hamburg, Heidelberg, Palaiseau, Paris, Saclay, and in Namibia in the construction and operation of the equipment. This work benefited from services provided by the H.E.S.S. Virtual Organisation, supported by the national resource providers of the EGI Federation.The Fermi LAT Collaboration acknowledges generous ongoing support from a number of agencies and institutes that have supported both the development and the operation of the LAT as well as scientific data analysis. These include the National Aeronautics and Space Administration and the Department of Energy in the United States, the Commissariat à l’Energie Atomique and the Centre National de la Recherche Scientifique / Institut National de Physique Nucléaire et de Physique des Particules in France, the Agenzia Spaziale Italiana and the Istituto Nazionale di Fisica Nucleare in Italy, the Ministry of Education, Culture, Sports, Science and Technology (MEXT), High Energy Accelerator Research Organization (KEK) and Japan Aerospace Exploration Agency (JAXA) in Japan, and the K. A. Wallenberg Foundation, the Swedish Research Council and the Swedish National Space Board in Sweden.
Additional support for science analysis during the operations phase is gratefully acknowledged from the Istituto Nazionale di Astrofisica in Italy and the Centre National d’Études Spatiales in France.
This publication makes use of molecular line data from the Boston University-FCRAO Galactic Ring Survey (GRS). The GRS is a joint project of Boston University and Five College Radio Astronomy Observatory, funded by the National Science Foundation under grants AST-9800334, AST-0098562, AST-0100793, AST-0228993 & AST-0507657.
References
- Abdo et al. (2010a) Abdo, A. A., Ackermann, M., Ajello, M., et al. 2010a, ApJ, 718, 348
- Abdo et al. (2009a) Abdo, A. A., Ackermann, M., Ajello, M., et al. 2009a, ApJS, 183, 46
- Abdo et al. (2009b) Abdo, A. A., Ackermann, M., Ajello, M., et al. 2009b, ApJ, 706, L1
- Abdo et al. (2010b) Abdo, A. A., Ackermann, M., Ajello, M., et al. 2010b, Science, 327, 1103
- Abdo et al. (2010c) Abdo, A. A., Ackermann, M., Ajello, M., et al. 2010c, ApJ, 712, 459
- Abdo et al. (2010d) Abdo, A. A., Ackermann, M., Ajello, M., et al. 2010d, ApJ, 722, 1303
- Abramowski et al. (2012) Abramowski, A., Acero, F., Aharonian, F., et al. 2012, A&A, 537, A114
- Acciari et al. (2009) Acciari, V. A., Aliu, E., Arlen, T., et al. 2009, ApJ, 698, L133
- Acero et al. (2015) Acero, F., Ackermann, M., Ajello, M., et al. 2015, ApJS, 218, 23
- Ackermann et al. (2013) Ackermann, M., Ajello, M., Allafort, A., et al. 2013, Science, 339, 807
- Ackermann et al. (2016) Ackermann, M., Ajello, M., Atwood, W. B., et al. 2016, ApJS, 222, 5
- Aharonian et al. (2008a) Aharonian, F., Akhperjanian, A. G., Barres de Almeida, U., et al. 2008a, A&A, 490, 685
- Aharonian et al. (2008b) Aharonian, F., Akhperjanian, A. G., Bazer-Bachi, A. R., et al. 2008b, A&A, 481, 401
- Aharonian et al. (2006a) Aharonian, F., Akhperjanian, A. G., Bazer-Bachi, A. R., et al. 2006a, A&A, 457, 899
- Aharonian et al. (2006b) Aharonian, F., Akhperjanian, A. G., Bazer-Bachi, A. R., et al. 2006b, A&A, 449, 223
- Aharonian et al. (2009) Aharonian, F., Akhperjanian, A. G., de Almeida, U. B., et al. 2009, ApJ, 692, 1500
- Albert et al. (2007) Albert, J., Aliu, E., Anderhub, H., et al. 2007, ApJ, 664, L87
- Atwood et al. (2009) Atwood, W. B., Abdo, A. A., Ackermann, M., et al. 2009, ApJ, 697, 1071
- Beischer et al. (2009) Beischer, B. et al. 2009, New J. Phys., 11, 105021
- Bell (2004) Bell, A. R. 2004, MNRAS, 353, 550
- Berge et al. (2007) Berge, D., Funk, S., & Hinton, J. 2007, A&A, 466, 1219
- Blasi (2013) Blasi, P. 2013, A&A Rev., 21, 70
- Blasi et al. (2012) Blasi, P., Morlino, G., Bandiera, R., Amato, E., & Caprioli, D. 2012, ApJ, 755, 121
- Bregeon et al. (2013) Bregeon, J., Charles, E., & M. Wood for the Fermi-LAT Collaboration. 2013, 2012 Fermi Symposium Proceedings [arXiv:1304.5456]
- Brogan & Troland (2001) Brogan, C. L. & Troland, T. H. 2001, ApJ, 550, 799
- Caprioli (2012) Caprioli, D. 2012, J. Cosmology Astropart. Phys., 7, 038
- Cardillo et al. (2016) Cardillo, M., Amato, E., & Blasi, P. 2016, ArXiv e-prints [arXiv:1604.02321]
- Castro & Slane (2010) Castro, D. & Slane, P. 2010, ApJ, 717, 372
- Chen et al. (2014) Chen, Y., Jiang, B., Zhou, P., et al. 2014, in IAU Symposium, Vol. 296, IAU Symposium, ed. A. Ray & R. A. McCray, 170–177
- Crutcher et al. (2010) Crutcher, R. M., Wandelt, B., Heiles, C., Falgarone, E., & Troland, T. H. 2010, ApJ, 725, 466
- de Naurois & Rolland (2009) de Naurois, M. & Rolland, L. 2009, Astroparticle Physics, 32, 231
- de Palma et al. (2013) de Palma, F., Brandt, T. J., Johannesson, G., Tibaldo, L., & for the Fermi-LAT Collaboration. 2013, 2012 Fermi Symposium Proceedings [arXiv:1304.1395]
- Drury (1983) Drury, L. O. 1983, Reports on Progress in Physics, 46, 973
- González-Casanova et al. (2014) González-Casanova, D. F., De Colle, F., Ramirez-Ruiz, E., & Lopez, L. A. 2014, ApJ, 781, L26
- Green (2014) Green, D. A. 2014, Bulletin of the Astronomical Society of India, 42, 47
- Helfand et al. (2006) Helfand, D. J., Becker, R. H., White, R. L., Fallon, A., & Tuttle, S. 2006, AJ, 131, 2525
- H.E.S.S. Collaboration et al. (2016) H.E.S.S. Collaboration, Abdalla, H., Abramowski, A., et al. 2016, A&A, forthcoming
- H.E.S.S. Collaboration et al. (2015) H.E.S.S. Collaboration, Abramowski, A., Aharonian, F., et al. 2015, A&A, 574, A100
- Hinton (2004) Hinton, J. A. 2004, New A Rev., 48, 331
- Hwang et al. (2000) Hwang, U., Petre, R., & Hughes, J. P. 2000, ApJ, 532, 970
- Inoue et al. (2010) Inoue, T., Yamazaki, R., & Inutsuka, S.-i. 2010, ApJ, 723, L108
- Jackson et al. (2006) Jackson, J. M., Rathborne, J. M., Shah, R. Y., et al. 2006, ApJS, 163, 145
- Jogler & Funk (2016) Jogler, T. & Funk, S. 2016, ApJ, 816, 100
- Keohane et al. (2007) Keohane, J. W., Reach, W. T., Rho, J., & Jarrett, T. H. 2007, ApJ, 654, 938
- Lande et al. (2012) Lande, J., Ackermann, M., Allafort, A., et al. 2012, ApJ, 756, 5
- Li & Chen (2012) Li, H. & Chen, Y. 2012, MNRAS, 421, 935
- Li & Ma (1983) Li, T.-P. & Ma, Y.-Q. 1983, ApJ, 272, 317
- Lockman (1989) Lockman, F. J. 1989, ApJS, 71, 469
- Lopez et al. (2013) Lopez, L. A., Ramirez-Ruiz, E., Castro, D., & Pearson, S. 2013, ApJ, 764, 50
- Malkov et al. (2012) Malkov, M. A., Diamond, P. H., & Sagdeev, R. Z. 2012, Physics of Plasmas, 19, 082901
- Mattox et al. (1996) Mattox, J. R., Bertsch, D. L., Chiang, J., et al. 1996, ApJ, 461, 396
- Mezger et al. (1967) Mezger, P. G., Schraml, J., & Terzian, Y. 1967, ApJ, 150, 807
- Moffett & Reynolds (1994) Moffett, D. A. & Reynolds, S. P. 1994, ApJ, 437, 705
- Ohira et al. (2011) Ohira, Y., Murase, K., & Yamazaki, R. 2011, MNRAS, 410, 1577
- Ohm et al. (2009) Ohm, S., van Eldik, C., & Egberts, K. 2009, Astroparticle Physics, 31, 383
- Parsons & Hinton (2014) Parsons, R. D. & Hinton, J. A. 2014, Astroparticle Physics, 56, 26
- Piron et al. (2001) Piron, F., Djannati-Atai, A., Punch, M., et al. 2001, A&A, 374, 895
- Porter et al. (2008) Porter, T. A., Moskalenko, I. V., Strong, A. W., Orlando, E., & Bouchet, L. 2008, ApJ, 682, 400
- Ptuskin et al. (2010) Ptuskin, V., Zirakashvili, V., & Seo, E.-S. 2010, ApJ, 718, 31
- Ptuskin & Zirakashvili (2005) Ptuskin, V. S. & Zirakashvili, V. N. 2005, A&A, 429, 755
- Pye et al. (1984) Pye, J. P., Becker, R. H., Seward, F. D., & Thomas, N. 1984, MNRAS, 207, 649
- Radhakrishnan et al. (1972) Radhakrishnan, V., Goss, W. M., Murray, J. D., & Brooks, J. W. 1972, ApJS, 24, 49
- Rho & Petre (1998) Rho, J. & Petre, R. 1998, ApJ, 503, L167+
- Scoville et al. (1986) Scoville, N. Z., Sargent, A. I., Sanders, D. B., et al. 1986, ApJ, 303, 416
- Simon et al. (2001) Simon, R., Jackson, J. M., Clemens, D. P., Bania, T. M., & Heyer, M. H. 2001, ApJ, 551, 747
- Uchiyama et al. (2010) Uchiyama, Y., Blandford, R. D., Funk, S., Tajima, H., & Tanaka, T. 2010, ApJ, 723, L122
- Walker et al. (1982) Walker, R. C., Matsakis, D. N., & Garcia-Barreto, J. A. 1982, ApJ, 255, 128
- Westerhout (1958) Westerhout, G. 1958, Bull. Astron. Inst. Netherlands, 14, 215
- Wu et al. (2014) Wu, S.-W., Bik, A., Henning, T., et al. 2014, A&A, 568, L13
- Zhang et al. (2013) Zhang, B., Reid, M. J., Menten, K. M., et al. 2013, ApJ, 775, 79
- Zhou et al. (2011) Zhou, X., Miceli, M., Bocchino, F., Orlando, S., & Chen, Y. 2011, MNRAS, 415, 244
- Zhu et al. (2014) Zhu, H., Tian, W. W., & Zuo, P. 2014, ApJ, 793, 95
- Zirakashvili et al. (2008) Zirakashvili, V. N., Ptuskin, V. S., & Völk, H. J. 2008, ApJ, 678, 255