A model for pressurized hydrogen induced thin film blisters
Abstract
We introduce a model for hydrogen induced blister formation in nanometer thick thin films. The model assumes that molecular hydrogen gets trapped under a circular blister cap causing it to deflect elastically outward until a stable blister is formed. In the first part, the energy balance required for a stable blister is calculated. From this model, the adhesion energy of the blister cap, the internal pressure and the critical H-dose for blister formation can be calculated. In the second part, the flux balance required for a blister to grow to a stable size is calculated. The model is applied to blisters formed in a Mo/Si multilayer after being exposed to hydrogen ions. From the model the adhesion energy of the Mo/Si blister cap was calculated to be around 1.05 J/m2 with internal pressures in the range of 175-280 MPa. Based on the model a minimum ion dose for the onset of blister formation was calculated to be ions/cm2. From the flux balance equations the diffusion constant for the Mo/Si blister cap was estimated to be cm2/s.
I introduction
Nanometer thick multilayer structures can be designed and fabricated to form an artificial Bragg structure that can be used to reflect light of a specific wavelength. These mirrors can be found in synchrotrons, telescopes and extreme ultraviolet optical systems Pelizzo et al. (2011); Teyssier et al. (2002). Over time, the surfaces of such mirrors can become contaminated, with a loss in reflectance as a result. One way to remove these contaminants from the surface is by exposing the surface to a flux of ionic and/or atomic hydrogen. However, under certain hydrogen exposure conditions, surface blisters may appear which irreversibly damage the mirror surface.
Blister formation is not exclusively related to multilayer mirrors but can also be found in a much broader research field. For example in fusion reactor wall studies and the smart-cut process for silicon on insulator fabrication Evans (1976); Feng and Huang (2004); Höchbauer et al. (2005); Sharafat et al. (2009); Xie et al. (2015). Blisters have been observed in both heterogeneous nanometer thick layered structures, and also in bulk materials. In addition to hydrogen, helium ions have been found to induce blistering Johnson, Thomson, and Reader (1999). Based on the experimentally observed blisters, several models have been developed to predict the critical dose for the onset of blister formation, adhesion energy and radius of the blisters Freund (1997); Hong and Cheong (2006); Mitani and Gösele (1992); Selvadurai (2007). In general these models are based on calculating the potential energy of the blister cap as a function of pressure, volume and elastic constants of the cap material. When the strain energy of deformation plus the surface energy is balanced by the mechanical work of the gas trapped inside the blister a stable blister cap is formed.
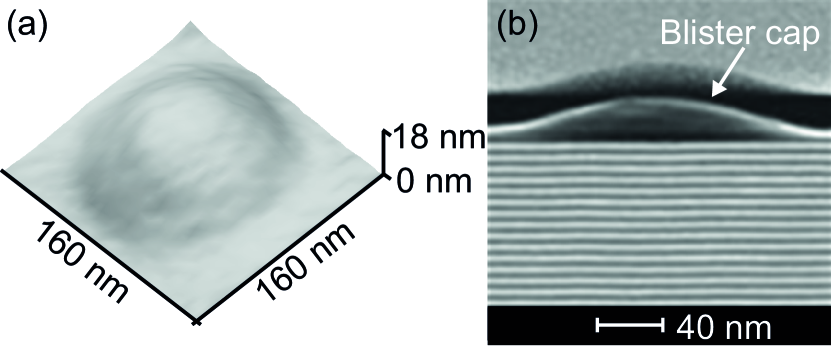
In this article, a blister formation model, based on pressure driven elastic deformation, is introduced. Special attention is paid to blisters formed in a Mo/Si multilayer by hydrogen ions, of which examples are shown in figure 1. Here, we extend the previously described models in the following way. The compressive stress introduced during deposition is taken into account and in place of the ideal gas law an empirical equation of state (EOS), suitable for high pressure is used. Furthermore, we use the stable blister size to estimate the diffusion of molecular hydrogen through the blister cap. We show that the model agrees with experimental data. Finally, the model predictions for the influence of initial intrinsic stress, the adhesion energy, the blister’s internal pressure, and a minimum hydrogen dose for the onset of blisters are discussed.
II theory
Blister formation is a multi-step mechanism that can qualitatively be described by the following steps: i) Atomic and/or ionic hydrogen penetrates into the substrate; ii) Because the solubility of hydrogen in the target material is limited, hydrogen segregates into micro cavities and defect sites where it can recombine to molecular hydrogen and gets trapped; iii) The pressure inside the cavity increases as more molecular hydrogen is accumulated up to the point a blister is formed iv) The blister either stops growing or bursts depending on the transport of hydrogen through the material Terreault (2007).
To calculate the blister’s energy balance, a blister shape must be assumed. Under the assumption that the blister cap can be described as an isotropic elastic thin film that deflects due to the pressure in the blister cavity a stable blister size can be calculated depending on the number of trapped molecular hydrogen particles .
II.1 Blister shape function
A commonly used function for describing the blister shape is a bell shaped profile function as given by Hong and Cheong (2006); Selvadurai (2007); Coupeau et al. (2013):
| (1) |
In this formula, is the height of the blister cap at a distance from the blister top, which has a deflection . The blister radius is given by . This function is a solution of the classical plate equation from Poisson-Kirchhoff-Germain thin plate theory for small deflections Timoshenko and Woinowsky-Krieger (1959):
| (2) |
with the pressure inside the blister and
the plate constant. The plate constant is determined by the blister cap thickness , Young’s modulus, , and Poisson’s ratio, . For a circular plate with fixed boundaries, i.e.
| (3) |
the differential equation can be solved analytically to obtain equation 1 with blister radius, , and a maximum deflection given by:
| (4) |
The above equation relates the blister shape to the internal pressure of the blister but only takes into account the bending moment of the blister. This means that for small deflections the blister height scales linearly with pressure. As will be shown in the next section, a correction due to stretching should be taken into account for large deflections. The analytical solution presented in equation 1 is fitted in figure 2 (solid lines) to experimentally measured AFM profiles of Mo/Si blister caps. To fit equation 1, and are taken as free parameters. As can be seen in figure 2, there is a good fit between the analytical shape function and the measured AFM profiles of the blister cap. The residual of the fit as given in the bottom graph is typically less than 8%. The fit of equation 1 overestimates the measured blister radius, which can be seen by the increase in the residual near the edge of the blister.

II.2 Energy balance of blister cap
Several other calculations for the energy of the blister cap can be found in literature. For example Selvadurai (2007) balance the elastic strain energy including substrate deformation by the surface energy to determine the adhesion energy of thin films, while Freund (1997) and Hong and Cheong (2006) take only the strain energy and surface energy into account to determine the minimal ion dose required for blisters to form.
For the blisters formed in a Mo/Si multilayer the following equation is used to calculate the total potential energy of the blister cap:
| (5) |
In which the surface energy, , the elastic bending energy, , and the stretching energy, , is balanced by the expansion work done by the blister’s internal pressure, , and the release of intrinsic compressive stress energy, . In this calculation, the strain energy of the substrate is neglected as no significant deformation is observed in TEM images (see for example figure 1). To calculate and , the blister cap is assumed to be isotropic and elastic with a shape given by equation 1.
For small deflections () of a thin film, the bending energy in cylindrical coordinates is defined asTimoshenko and Woinowsky-Krieger (1959):
| (6) | |||||
If the deflection of the blister cap becomes comparable to the thickness, , the stretching term, , becomes significant. In this case, the in plane radial displacement must be taken into account. Following the procedure of virtual displacement from Timoshenko and Woinowsky-Krieger (1959), and taking for the radial displacement:
| (7) |
the corresponding stretching energy is given by:
| (8) |
By minimizing the stretching energy, constants and can be calculated by taking the partial derivatives . This reduces equation 8 to:
| (9a) | |||
| (9b) |
The surface energy released by the blister is given by the delaminated area as:
| (10) |
with the surface energy of the blister cap to substrate interface.
The work done by isothermally expanding gas particles inside a blister cavity in terms of pressure and volume is:
| (11) |
Where is the pressure as a function of volume, which is given by the equation of state (EOS). For large blisters the EOS is simply the ideal gas law, but as the blister volume approaches zero, the gas significantly deviates from the ideal gas law due to particle interactions. Around the stationary point of the blister, the following EOS of state can be used, as found experimentally by Michels et al. (1959) for H2 pressures in the range of 2-300 MPa Michels et al. (1959):
| (12) | |||||
with the number of particles in moles, the volume in cubic meter and coefficients through as given in table 1. With the above EOS, the molar density approaches that of solid hydrogen for pressures around 300 MPa.
| Value | Value | |||
|---|---|---|---|---|
| A(=RT) | D | |||
| B | E | |||
| C | F |
For the expansion work, this leads to the equation:
| (13a) | |||
| (13b) | |||
| (13c) |
where is the expansion work done for pressures above 300 MPa, and is the expansion work done for pressures within the validity range of the EOS. We assume that is constant for all blisters formed. The blister volume is calculated by taking the volume integral of equation 1.
Depending on the deposition process of the multilayer, the average stress of the Mo/Si bilayer can vary from hundreds of MPa pressure compressive to tensile Windt et al. (1995). For an initially compressively stressed blister cap the energy released by the delaminated layer is given by:
| (14) |
Where is the average compressive stress in the thin layer. If the film has a tensile stress the sign of the energy is changed and additional energy needs to be added to deflect the surface outward. One can show that for a deposited multilayer with material parameters as shown in table 2, the intrinsic stress has only a minor effect on the energy balance. (Compared to and , the intrinsic stress is about two orders of magnitude lower, J compared to J).
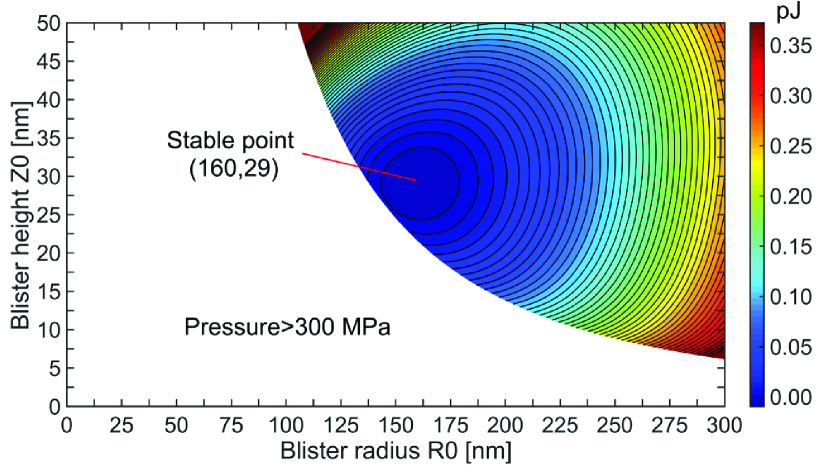
Adding all energy terms as given by equation 5, the total energy of the blister cap as a function of blister radius and height can be found for a fixed number of hydrogen particles inside the blister cavity. For a Mo/Si multilayer the contour lines of the energy surface for 15 million trapped particles is shown in figure 3. In this calculation material constants and dimensions are used as shown in table 2.
| Parameter | Value | ||
|---|---|---|---|
| 215 GPa111Calculated values taken from Loopstra et al. (1991). | |||
| 0.18111Calculated values taken from Loopstra et al. (1991). | |||
| 1.05 J/m2 | |||
| 500 MPa | |||
| 7 nm |
In the white area the pressure inside the blister exceeds 300 MPa. At those pressure the hydrogen densities approaches that of solid hydrogen and the expansion work can no longer be calculated from the EOS. For the limiting case it can be seen that as the volume goes to zero, the expansion work tends to infinity. On the other hand, the surface energy (blister radius) and stretching energy (blister height) will increase continuously for an increasing blister size. Thus, for a fixed number of trapped molecular hydrogen inside the blister, a stable minimum in the blister cap energy can be found, as indicated by the red arrow in figure 3.
II.3 Stable blister shape
To find the stable point as shown in figure 3 the partial derivatives of with respect to and are taken. This leads to the following equations for the stable point:
| (15a) | |||
| (15b) |
The first equation relates the blister’s internal pressure to its dimensions and . It is comparable with equation 4 but an additional term is included that takes the stretching of the blister cap into account. With increasing number of particles the stable blister size increases. The second equation gives the minimum in blister cap energy surface. If there is a linear dependence between the blister radius and blister height. In figure 4 the stable blister dimensions for four different surface energies are calculated taken the values as given in table 2. It can be seen that for increasing surface energies the ratio between blister height and radius increase. To verify the model, data is taken from an atomic force microscope measurement on a blistered Mo/Si multilayer surface being exposed to hydrogen. From the graph it is seen that the surface energy of the delaminated surface is around 1.05 J/m2 which equals the surface energy of a-Si as can be found in literature: 1.050.14 J/m2 Hara et al. (2005). For comparison the surface energy of (001) Mo and (001) MoSi2 is around 3.97 J/m2 and 3.86 J/m2 respectively Hong et al. (1992). So based on the model it is expected that the delamination has taken place within the a-Si layer.

II.4 Hydrogen density and pressure inside a Mo/Si multilayer blister
From a measured blister shape, the hydrogen density and pressure inside the blister can be calculated with equations 15 and 12. In figure 5 the blister pressure and density is given as a function of the stable blister radius. For blister radii smaller than 90 nm the hydrogen density necessary for stable blisters to form approach values of solid hydrogen (dotted line). The dash dotted line gives the measured blister radius range and the corresponding range in blister density (20.1-25.3 H2/nm3) and pressure (175-280 MPa).

When the stable blister shape and density are known, an estimate can be made on the minimum dose required to form the blister. For an observed blister with a radius of 98 nm and corresponding height of 17 nm, the local hydrogen density has to be 25.3 H2/nm3. This means that =4.3 million particles have to get trapped in the blister cavity. The number of hydrogen particles reaching the blister volume is given by:
| (16) |
In this equation, is the incident hydrogen ion dose per unit area and the fraction of the incoming ions that can penetrate through the blister cap. The factor of one half takes into account recombination of hydrogen ions to stable molecular hydrogen. In this equation the diffusion of hydrogen after implantation is neglected. To estimate , an SRIM calculation was performed for a Mo/Si multilayer irradiated by 100 eV hydrogen ions (see figure 6) Ziegler, Biersack, and Littmark (1985); zie . The fraction of the total flux that can penetrate through the first bilayer is . Filling in those number in equation 16 gives a minimum required ion dose of ions/cm2. This is indeed below the actual measurement dose of ions/cm2.
II.5 Blister stabilization
In the analysis above only the static case of the blister is considered where the number of trapped hydrogen particles inside the blister is fixed. But in general, depending on the in- and outflux of hydrogen (, ), three cases can be distinguished: i) : the number of trapped hydrogen particles is increasing and the blister grows, ii) : the number of trapped hydrogen particles is fixed and the blister is stable at its energetically most favorable shape, iii) : the number of trapped hydrogen particles is decreasing and the blister size decreases assuming the deformation is completely elastic. By knowing the in- and outflux as function of time the dynamic behavior of the blister can be described.
The influx of hydrogen per unit of time H2/s is given by:
| (17) |
with ions/cm2s the hydrogen ion flux at the surface and the fraction of ions that can penetrate through the blister cap. The out diffusion, H2/s, of hydrogen can be estimated using Fick’s law:
| (18) |
The diffusion constant cm2/s depends on the blister cap material and is the number of hydrogen particles that are trapped inside the blister with a volume . is the blister cap surface area:
| (19a) | |||
| (19b) |

From the final shape of the blister, the diffusion constant can be calculated by combining equation 17 and 18:
| (20) |
Taking the blister shape of the measured data with a number density between 20.1-25.3 H2/nm3 exposed at a constant flux of ions/cm2s, the diffusion constant is around cm2/s. This is about an order of magnitude higher than the literature value for hydrogen diffusion in c-SiSharma (2005): cm2/s.
Before the blister is stabilized the blister is growing what means that . Because the influx of hydrogen particles per unit area is constant during the experiment, the outflux of hydrogen per unit area has to increase during the blister growth until the influx is balanced and the blister growth will stop. This means that regarding equation 18 that the hydrogen density, n/V, and/or the diffusion constant, , has to increase in time. At the start of the hydrogen exposure the concentration inside the multilayer is zero and it is slowly increasing with time. While the influx is set instantaneously by the ion flux and energy, the outflux is increasing towards the influx value with a certain delay depending on the diffusion constant and thickness of the blister cap. The timescale for out diffusion can be estimated with:
| (21) |
This is the typical time it takes for a hydrogen particle to diffuse through the blister cap. During this time about 4 million H2 particles have penetrated through the blister cap. This is about the number of particles needed to form a stable blister of 100 nm in radius. For a large diffusion constant the delay between in and outflux becomes smaller and no blisters will form at all as not sufficient hydrogen can get trapped. On the other hand a lower diffusion coefficient will increase the blister size as more particles get trapped before a balance between in and outflux is established.
Although it is possible to form a stable blister where fluxes are balanced, this point doesn’t have good stability. As the blister radius increases beyond the stable point, the influx of hydrogen per unit area becomes larger than the outflux and the blister can continue to grow until it bursts. This contradicts the stable blister shape observed on a Mo/Si multilayer. A possible explanation for this can be found in a time dependent diffusion constant. Studies on the hydrogenation of amorphous silicon have shown that the permeability of a-Si can change significantly during the hydrogenation Beyer (2016). These studies suggest that before the Si layer is fully saturated, only atomic hydrogen can diffuse through the silicon layer, and the rate of diffusion is rather low. However, once a-Si:H is fully hydrogenated, can freely and rapidly diffuse through the layer. This means that during the blister formation process this enhanced outdiffusion of hydrogen may prevent further blister growth. If a certain change in the diffusion is sufficient to stop the blister from growing depends on the time and scale of the change. If the change in diffusion is around the initiation point of the blister, a doubling in the diffusion constant could be enough to stop the blister growth process. In addition, Coupeau et al. (2013) also suggest that changes in the diffusion process occur during blister formation. Coupeau et al. show that the evolution of blisters on a pure silicon surface has small discontinuities over time, which the authors address to changes in the diffusion process.
III conclusion
The results presented here show that an elastic energy balance of a blister cap can be applied to hydrogen induced blister formation in Mo/Si multilayer mirrors. The model shows that the blister formation is mainly caused by the accumulation of hydrogen under the blister cap and a that a stable blister can be formed with a fixed number of particles inside. From the measured blister radius and height the surface energy, pressure and minimum hydrogen dose for blister formation could be calculated from the model. In second part the diffusion and penetration through the blister cap was considered. Given a fixed influx of hydrogen and assuming a linear outdiffusion of hydrogen, a diffusion constant for hydrogen through the blister cap could be calculated. Furthermore, the lack of blister expansion once the a stable blister has been formed is likely caused by a time dependent permeability of the blister cap.
Acknowledgements.
The authors would like to thank Dimitry Lopaev and Slava Medvedev for their contributions to the scientific discussions about this model. This work is part of the research programme CP3E (Controlling photon and plasma induced processes at EUV optical surfaces) of FOM (Stichting voor Fundamenteel Onderzoek der Materie) with the financial support of NWO (Nederlandse organisatie voor Wetenschappelijk Onderzoek). The CP3E programme is co-financed by Carl Zeiss SMT and ASML, and AgentschapNL through the EXEPT programme.References
- Pelizzo et al. (2011) M. G. Pelizzo, A. J. Corso, P. Zuppella, D. L. Windt, G. Mattei, and P. Nicolosi, Optics express 19, 14838 (2011).
- Teyssier et al. (2002) C. Teyssier, E. Quesnel, V. Muffato, and P. Schiavone, Microelectronic Engineering 61-62, 241 (2002).
- Evans (1976) J. H. Evans, Journal of Nuclear Materials 61, 1 (1976).
- Feng and Huang (2004) X. Q. Feng and Y. Huang, International Journal of Solids and Structures 41, 4299 (2004).
- Höchbauer et al. (2005) T. Höchbauer, A. Misra, K. Hattar, and R. G. Hoagland, Journal of Applied Physics 98, 123516 (2005).
- Sharafat et al. (2009) S. Sharafat, A. Takahashi, K. Nagasawa, and N. Ghoniem, Journal of Nuclear Materials 389, 203 (2009).
- Xie et al. (2015) D. G. Xie, Z. J. Wang, J. Sun, J. Li, E. Ma, and Z. W. Shan, Nature Materials 14, 899 (2015).
- Johnson, Thomson, and Reader (1999) P. B. Johnson, R. W. Thomson, and K. Reader, Journal of Nuclear Materials 273, 117 (1999).
- Freund (1997) L. B. Freund, Applied Physics Letters 70, 3519 (1997).
- Hong and Cheong (2006) J. W. Hong and S. Cheong, Journal of Applied Physics 100, 094322 (2006).
- Mitani and Gösele (1992) K. Mitani and U. M. Gösele, Applied Physics A: Solids and Surfaces 54, 543 (1992).
- Selvadurai (2007) A. P. S. Selvadurai, Acta Materialia 55, 4679 (2007).
- Terreault (2007) B. Terreault, Physica Status Solidi A 204, 2129 (2007).
- Coupeau et al. (2013) C. Coupeau, G. Parry, J. Colin, M. L. David, J. Labanowski, and J. Grilhé, Applied Physics Letters 103, 031908 (2013).
- Timoshenko and Woinowsky-Krieger (1959) S. Timoshenko and S. Woinowsky-Krieger, Theory of plates and shells, 2nd ed. (McGraw-Hill, 1959).
- Michels et al. (1959) A. Michels, W. de Graaff, T. Wassenaar, J. M. H. Levelt, and P. Louwerse, Physica 25, 25 (1959).
- Windt et al. (1995) D. L. Windt, W. L. Brown, C. A. Volkert, and W. K. Waskiewicz, Journal of Applied Physics 78, 2423 (1995).
- Loopstra et al. (1991) O. B. Loopstra, E. R. van Snek, T. H. de Keijser, and E. J. Mittemeijer, Physical Review B 44, 13519 (1991).
- Hara et al. (2005) S. Hara, S. Izumi, T. Kumagai, and S. Sakai, Surface Science 585, 17 (2005).
- Hong et al. (1992) T. Hong, J. R. Smith, D. J. Srolovitz, J. G. Gay, and R. Richter, Physical Review B 45, 8775 (1992).
- Ziegler, Biersack, and Littmark (1985) J. Ziegler, J. Biersack, and U. Littmark, The Stopping and Range of Ions in Matter (Pergamon, New York, 1985).
- (22) “SRIM,” http://www.srim.org/, consulted on July 2016.
- Sharma (2005) B. L. Sharma, “CRC handbook of Chemistry and Physics,” (CRC Press, 2005) Chap. 12, internet version 2005.
- Beyer (2016) W. Beyer, Physica Status Solidi A 213, 1661 (2016).