Chemistry in confined spaces: Reactivity of the Zn-MOF-74 channels
Abstract
Using infrared spectroscopy combined with ab initio methods we study reactions of H2O and CO inside the confined spaces of Zn-MOF-74 channels. Our results show that, once the water dissociation reaction H2OOH+H takes place at the metal centers, the addition of 40 Torr of CO at 200 ∘C starts the production of formic acid via OH+H+COHCO2H. Our detailed analysis shows that the overall reaction H2O+COHCO2H takes place in the confinement of MOF-74 without an external catalyst, unlike the same reaction on flat surfaces. This discovery has several important consequences: It opens the door to a new set of catalytic reactions inside the channels of the MOF-74 system, it suggests that a recovery of the MOF’s adsorption capacity is possible after it has been exposed to water (which in turn stabilizes its crystal structure), and it produces the important industrial feedstock formic acid.
I Introduction
Metal organic framework (MOF) materials are porous crystals widely studied for important applications and industrial processes such as gas storage and sequestration,Liu et al. (2012); Murray et al. (2009); Li et al. (2011); Qiu and Zhu (2009); Nijem et al. (2012); Lee et al. (2015); Zhao et al. (2008); Rosi et al. (2003); Wu et al. (2012); He et al. (2014) molecular sensing,Kreno et al. (2012); Canepa et al. (2015); Serre et al. (2007); Allendorf et al. (2008); Tan and Cheetham (2011); Hu et al. (2014) polymerization,Uemura et al. (2009); Vitorino et al. (2009) luminescence,Allendorf et al. (2009); White et al. (2009) non-linear optics,Bordiga et al. (2004) magnetic networks,Kurmoo (2009) targeted drug delivery,Horcajada et al. (2010) multiferroics,Stroppa et al. (2011, 2013); Di Sante et al. (2013) and catalysis.Wu and Lin (2007); Lee et al. (2009); Zou et al. (2006); Luz et al. (2010) In particular, MOF-74 [(dobdc), = Mg2+, Zn2+, Ni2+, Co2+, and dobdc=2,5-dihydroxybenzenedicarboxylic acid] has shown great potential for the adsorption of small molecules such as H2,Liu et al. (2008); Zhou et al. (2008) CO2, Wu et al. (2010); Dietzel et al. (2008); Caskey et al. (2008) N2, Valenzano et al. (2010) and CH4, Wu et al. (2009) among others.
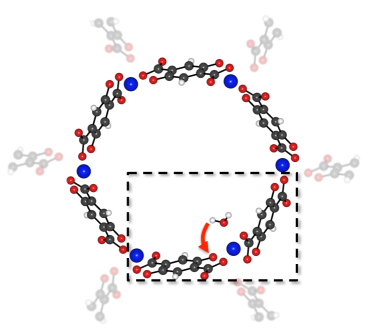
The favorable reactivity of MOF-74 has been widely studied.Valvekens et al. (2014); Yao et al. (2014); Kim et al. (2015); Sun et al. (2015); Zhang et al. (2015); Ruano et al. (2015) For example, Co-MOF-74 exhibits a catalytic activity towards CO oxidation,Kim et al. (2015) originating from the high density of lewis acidic coordinatively unsaturated sites and the MOF’s porosity. The inclusion of Co atoms into Ni-MOF-74 results in a mixed system (Co/Ni-MOF-74) that shows activity towards the oxidation of cyclohexene, where the catalytic performance of the mixed system is higher than the one of pure Co-MOF-74.Sun et al. (2015) On the other hand, our previous results have shown that several members of the MOF-74 family are able to catalyze the dissociation of water into H and OH groups (H2OOH+H, see Fig. 1) at low temperatures and pressures, i.e. above 150 ∘C and at 8 Torr of H2O.Zuluaga et al. (2016a); Tan et al. (2014, 2015) This particular catalytic reaction is responsible for the loss of crystal structure and adsorption capacity after exposure of MOF-74 to water,Zuluaga et al. (2016a) and constitutes one of the main hurdles for wide-spread applications of MOFs in general and MOF-74 in particular. This challenge has motivated our efforts to look for new catalytic reactions inside the confined channels of MOF-74, further reacting the undesirable products of the H2OOH+H reaction in order to overcome these hurdles.
In this work, we show that introducing CO molecules into the pores of MOF-74—after the H2OOH+H reaction has taken place—enables the reaction OH+H+COHCO2H. Our results show that the overall reaction H2O+COHCO2H takes place in the confinement of the MOF without an external catalyst, with a number of important consequences: First, it showcases the reactivity inside the well-controlled and isolated environment of the MOF-74 channels. This aspect is very important, as the confinement of the MOF-74 environment catalyzes reactions that would otherwise require very high pressure, bringing significant simplifications for experiments and possible MOF applications. Next, it shows initial indications of a partial adsorption capacity recovery after exposure of MOF to water, as the OH groups that otherwise poison the metal centers are now bound to and removed as formic acid. In turn, it increases the crystal structure stability of MOF-74 by removing the OH and H groups that cause the instability (note that, due to their strong binding, those groups cannot be removed by thermal activation).Zuluaga et al. (2016a) And finally, it binds the toxic CO and produces formic acid, a non-toxic liquid with 4.4 wt% hydrogen and thus a promising hydrogen carrier Gu et al. (2011); Tedsree et al. (2011); Zell et al. (2013); Zhang et al. (2013); Joó (2008) and an important feedstock medical/industrial chemical. The use of Pd as catalytic material in direct formic acid fuel cells has brought interesting developments in this area,Ha et al. (2006); Chang et al. (2014); Shen et al. (2013); Feng et al. (2011) highlighting formic acid as a valuable asset for a hydrogen economy.
II Experimental and Theoretical Methods
II.1 Zn-MOF-74
Out of the isostructural -MOF-74 family, Zn-MOF-74 exhibits the highest catalytic activity towards the H2OOH+H reaction.Tan et al. (2014) We thus use this system to study the H2O+COHCO2H reaction through a combination of ab initio simulations and experiments.
II.2 Hydrogen vs. Deuterium
Only recently, our work showed direct evidence of the water dissociation reaction H2OOH+H at the metal centers of MOF-74 above 150 ∘C.Tan et al. (2014, 2015) In this reaction, the water first binds to an open-metal site and then donates one H to the nearby O at the linker; the remaining OH group stays at the open-metal site, see Fig. 1. Interestingly, this reaction can only be observed when heavy water D2O is used. Its fingerprint is a sharp peak at 970 cm-1 in the IR spectrum, corresponding to the O–D vibration at the linker.Tan et al. (2014) When H2O is used instead, the peak appears at a higher frequency, where it couples with and is masked by the vibrational modes of the MOF and becomes impossible to detect. Therefore, the main focus of our experiments is on the water reaction with D2O. We refer to the resulting deuterated formic acid as FA(D). Nonetheless, we do show that the reaction also occurs with H2O, referring to the resulting formic acid as FA(H). For simplicity, throughout the text we may generally say water, even when experiments are done with heavy water.
II.3 Experimental Details and Procedure
Our experiments are divided into 3 steps:
(i) Preparation and activation of the sample: Zn-MOF-74 powder (2 mg) was pressed onto a KBr pellet (1 cm diameter, 1–2 mm thick). The sample was placed into a high-pressure high-temperature cell (product number P/N 5850c, Specac Ltd, UK) at the focal point of an infrared spectrometer (Nicolet 6700, Thermo Scientific, US). The sample was activated under vacuum at 180 ∘C for 4 hours and then cooled down to room temperature to measure CO2 absorption by introducing 6 Torr of CO2 into the cell until saturation (30 minutes). Then, the area under the peak at 2338 cm-1 was determined, which is a characteristic peak of CO2 adsorbed on the Zn site and thus a quantitative measure of the CO2 uptake.Yao et al. (2012) Thereafter, the cell was evacuated under vacuum ( 20 mTorr) at a temperature of 150 ∘C for a period of 4 hours.
(ii) Dissociation reaction: The sample was heated to 200 ∘C. 8 Torr of D2O were then introduced into the cell until saturation occurred (8 hours) to start the dissociation reaction. Spectra were recorded as a function of time during the adsorption process to evaluate the 970 cm-1 peak, i.e. the fingerprint of the D2OOD+D reaction. Thereafter, evacuation under vacuum ( 20 mTorr) for a period of 4 hours at 150 ∘C was required to evacuate the water gas phase completely and avoid further reaction. Note that this temperature is not high enough to also remove the OD and D products of the dissociation reaction. Then, at room temperature, CO2 adsorption was measured again and the cell was evacuated as in step (i).
(iii) Formic acid production and removal: The temperature in the cell was raised back to 200 ∘C and 40 Torr of CO were introduced for 1 hour to start the formic acid production. Spectra were recorded. Thereafter, the cell was evacuated for 3 hours under vacuum ( 20 mTorr) at 200 ∘C, removing the formic acid and unreacted CO, while spectra were recorded. Then, CO2 adsorption at room temperature was measured and the cell was evacuated as in step (i). This production and removal step was repeated two times and we refer to each occurrence as removal 1 and removal 2.
II.4 Computational Details
Ab initio modeling was performed at the density functional theory level, using quantum espressoGiannozzi et al. (2009) with the vdW-DF functional.Thonhauser et al. (2015); Berland et al. (2015); Langreth et al. (2009); Thonhauser et al. (2007) Ultrasoft pseudo potentials were used with cutoffs of 544 eV and 5440 eV for the wave functions and charge density. Due to the large dimensions of the unit cell, only the -point was used. During relaxations all atom positions were optimized until forces were less than 2.610-4 eV/Å. Reaction barriers were found with a transition-state search algorithm, i.e. the climbing-image nudged-elastic band method.Henkelman et al. (2000); Henkelman and Jónsson (2000) The primitive cell of our pristine Zn-MOF-74 system contained 54 atoms and has space group R. Additional atoms/molecules were added as appropriate for the reactants. The rhombohedral axes are Å and .Zhou et al. (2008)
III Results and Discussion
III.1 Confirming Formic Acid Production and Removal
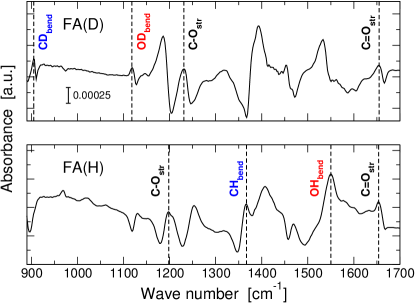
We begin by showing experimental evidence that the reactive environment inside the MOF-74 channels catalyses the formic acid production (through water dissociation) OH+H+COHCO2H after the water dissociation H2OOH+H has taken place. To this end, we follow the three-step procedure outlined in Sec. II.3. After the introduction of CO in step (iii), our IR spectra in Fig. 2 clearly show the presence of FA(D) and FA(H) molecules.Millikan and Pitzer (1958) As expected, due to the deuterium presence, the FA(D) peaks (CD and OD) are red shifted with respect to FA(H) peaks (CH and OH) by a factor of 1.4. C–O and C=O modes are less disturbed (shifted), as they are not directly affected by the presence of deuterium or hydrogen. The OH vibrational mode signal at 1550 cm-1 for FA(H) appears very close to a strong MOF mode at 1530 cm-1, and this vibrational mode may be contributing to the OH signal. On the other hand, the signal at 1530 cm-1 in the FA(D) spectrum may be due to a hydrogen contamination of the deuterated water, increased by the vibrations of the MOF modes.
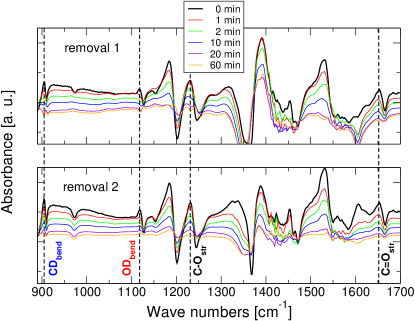
In Fig. 3 we show how the characteristic peaks of FA(D) disappear as a function of time during the removal in step (iii), showing that the produced formic acid can readily be removed. Note that these experiments rely on the detection of the linker O–D mode at 970 cm-1 and are thus only performed for the deuterated case (see Sec. II.2). We will henceforth only discuss the deuterated case. It is interesting to note that—while the starting point for removal 1 and 2 are comparable to within 6%—the desorption becomes faster. For example, in the former case 35% of FA(D) was removed after 20 min, while in the latter 62% was removed during the same time. This fact, together with the fact that several removals are necessary to react all OD and D groups suggests a bottleneck in diffusion of the reactants and products, discussed further below.
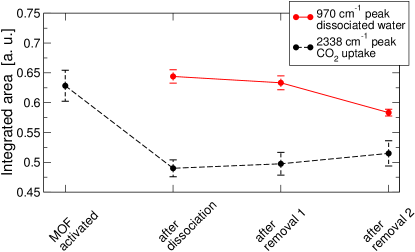
After the water dissociation reaction happens, its products (OD or OH) are strongly bound to primary adsorption site in the MOF and take up valuable adsorption sites. This undesirable decrease of the MOF’s adsorption capacity is well knownTan et al. (2014, 2015); Zuluaga et al. (2016b) and unfortunately limits the applicability of MOF materials to non-humid environments. Note that the water dissociation products bind so strongly to the MOF that a simple removal through activation is not possible before the MOF disintegrates. Other means to recover the uptake capacity of MOFs after exposure to water are thus highly desirable. Our production and removal of formic acid reacts those unwanted groups that are otherwise bound to the MOF after the water dissociation reaction. We now show that this process also partially restores the MOF’s small-molecule uptake capacity. In Fig. 4 we track the 970 cm-1 peak (a measure for the amount of dissociated heavy water present in the MOF cavity)Tan et al. (2014) as well as the 2338 cm-1 peak (a measurement of the CO2 adsorption capacity)Yao et al. (2012) at different stages of our experiment. We see that the former decreases as we introduce CO into the system, i.e by 1.6% after removal 1 and 7.9% after removal 2. This confirms that we have successfully removed the D groups from the linkers of the MOF. On the other hand, the latter—after an expected big reduction in the CO2 uptake capacity after the D2O dissociation (22%)—increases by 1.5% and 5.1% after removal 1 and 2. While the MOF’s uptake capacity recovery is relatively small per removal cycle, our results constitute the first proof-of-principle that such a recovery is even possible.
As expected, the decrease in the amount of dissociated water (area under the peak at 970 cm-1) goes hand-in-hand with the increase of the CO2 uptake capacity (area under the peak at 2338 cm-1). However, it is interesting to see that more than one removal cycle is necessary to restore a significant amount of uptake capacity. In principle, the partial pressure of 40 Torr CO introduced into the system should be more than enough (we estimate that it results in at least 6 CO molecules per unit cell) to react all OD and D groups. However, this is not the case, see Fig 4. We conclude that the produced formic acid inhibits diffusion of CO deeper into the bulk. After each removal of formic acid and the renewed introduction of CO, the process picks up where it had left off earlier, working from the MOF surface into the bulk until, eventually, all OD and D groups have been reacted. Work to reduce the number of cycles thus needs to focus on diffusion in MOF-74 Canepa et al. (2013a); Lee et al. (2012); Lin et al. (2013) as well as using similar reactions with different products.
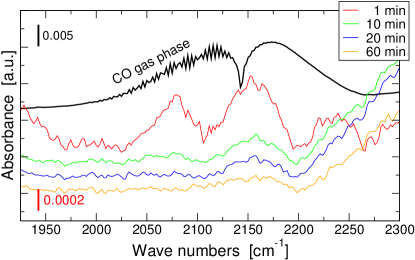
The CO region in the IR spectrum also provides information on the mechanism of formic acid formation. Figure 5 shows the CO region during removal 1 at several stages. When CO gas is still inside the MOF, the predominant signal is at 2173 cm-1. However, after 1 min of desorption, a shift to lower frequencies (2150 cm-1) is observed. This indicates that the majority of the CO gas phase has been evacuated and now the IR spectrum is dominated by a signal that suggests a stronger interaction between the CO and the MOF, such as in the CO2H+H state (see Fig. 6). After longer periods of desorption, the intensity of the signal is reduced as the chamber is evacuated.
Before we continue to study the nature of the reaction, we give an estimate of how much formic acid is produced. From our calculations we know that the crystal density of Zn-MOF-74 is 1.231 g/mL, with a volume of 3944.65 Å3 for the hexagonal cell (note that the hexagonal cell contains 18 metal centers and is three times bigger than the rhombohedral representation).Zhou et al. (2008) Based on that, we calculate that in our sample (2 mg of Zn-MOF-74) we have 4.121017 hexagonal unit cells. According to Fig. 4, we observe a reduction of 22% in the CO2 adsorption capacity, suggesting that we produced 4 OD+D groups every 18 metal centers. Therefore, when CO is introduced into the cell and 5.1% of the CO2 adsorption capacity is recovered, we estimate a production of 3.951017 formic acid molecules. This corresponds to 2.31110-5 mL of formic acid in the 2 mg of Zn-MOF-74, or 11.55 L/g. Clearly, this is a small quantity, but as mention before, our goal is to investigate the chemistry in the confined spaces of Zn-MOF-74 and not the mass production of formic acid.
III.2 Pathway of the Formic Acid Reaction
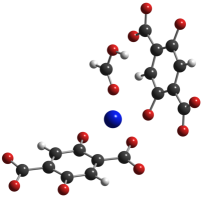
H2O+CO OH+H+CO CO2H+H HCO2H
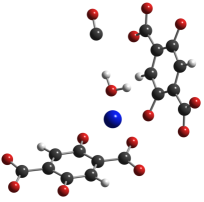
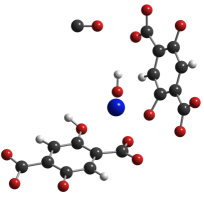
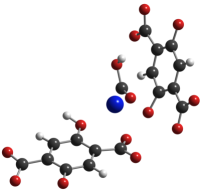
We now investigate the nature of the formic acid reaction H2O+COHCO2H and give and explanation of how it takes place. We know that the first step is the dissociation of water at the metal centers H2OOH+H, which we have studied in detail before.Tan et al. (2014); Zuluaga et al. (2016a, b) We find that the water dissociation takes place above 150 ∘C with an energy barrier up to 1.09 eV, depending on the number of water molecules involved in the reaction.Zuluaga et al. (2016b) The second step of the reaction starts by the introduction of CO at 200 ∘C, which catalyses the OH+H+COHCO2H reaction. Based on this information, and taking into account that the metal centers are poisoned by the OH groups after the H2OOH+H reaction, we propose the following mechanism for the overall reaction: Once the H2OOH+H reaction takes place, the added CO molecules interact with the OH groups at the metal centers to form CO2H adsorbed at the metal center. Thereafter, the CO2H molecule interacts with the H at the linker to form formic acid HCO2H. Overall, the reaction pathway follows H2O+CO OH+H+CO CO2H+H HCO2H, as depicted in Fig. 6.
We now use our ab initio transition-state search to find the energetically most favorable pathway (i.e. lowest energy barriers) for our proposed reaction pathway. Results for the structures of reactants, stable states, and products are depicted in Fig. 6 and the energy profile along the entire reaction is plotted in Fig. 7. The first step of the reaction is the endothermic water dissociation H2O+CO OH+H+CO. We have previously calculated its reaction barrier (1.09 eV) and confirmed the separate OH (bound to the open-metal site) and H (bound to the O of the linker) experimentally inside MOF-74 above 150 ∘C.Tan et al. (2014) Thereafter, the reaction proceeds exothermic via OH+H+CO CO2H+H HCO2H, resulting in the formation of formic acid adsorbed on the metal centers of Zn-MOF-74. Our calculations show that the energy barrier between the states OH+H+CO and CO2H+H is 0.8 eV, while the barrier between CO2H+H and HCO2H is 1.04 eV. The final state, i.e. HCO2H, has an energy 0.23 eV lower than the energy of the initial state H2O+CO, and the formic acid binds to the metal centers with an energy of 0.68 eV (65.61 kJ/mol), comparable to the binding of other molecules to Zn-MOF-74.Canepa et al. (2013b); Lee et al. (2015) Thus, removal of the formic acid product from the open-metal sites can proceed through simple activation of the sample, as confirmed in Fig 3.
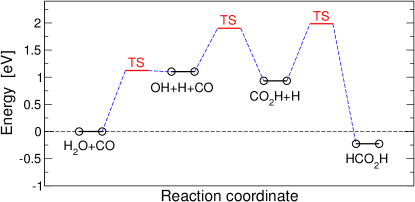
The overall barrier for the reaction in Fig. 7 is significant and explains why only a small amount of formic acid is produced. But, that barrier corresponds to the presence of only one water molecule. In related work, we show that the barrier to the first step of the reaction is lowered by 37% when the water molecules create clusters above the linkers.Zuluaga et al. (2016b) It is conceivable that the presence of several CO and/or H2O molecules can also lower the energy barrier of the OH+H+COHCO2H reaction. However, due to the large number of stable geometries and possible paths for the H2O+COHCO2H reaction when more than one molecule is involved, a comprehensive ab initio transition-state search becomes computational prohibitively expensive.
IV Conclusions
Our experimental and theoretical work confirms that we can use the OH and H groups—produced by the H2OOH+H reaction—to start a new reaction mechanism catalyzed inside the confined environment of the Zn-MOF-74 channels through water dissociation and produce formic acid via H2O+COHCO2H. This discovery has several important consequences: It opens the door to a new set of catalytic reactions inside a well controlled system (MOF-74), it provides a proof-of-principle that a recovery of the adsorption capacity and structural stability of Zn-MOF-74 is possible after exposure to water, and finally it produces the important medical/industrial feedstock formic acid.
V Acknowledgements
This work was supported by DOE Grant No. DE–FG02–08ER46491. Furthermore, this research used computational resources of the OLCF at ORNL, which is supported by DOE grant DE–AC05–00OR22725.
References
- Liu et al. (2012) J. Liu, P. K. Thallapally, B. P. McGrail, D. R. Brown, and J. Liu, Chem. Soc. Rev. 41, 2308 (2012).
- Murray et al. (2009) L. J. Murray, M. Dinca, and J. R. Long, Chem. Soc. Rev. 38, 1294 (2009).
- Li et al. (2011) J.-R. Li, Y. Ma, M. C. McCarthy, J. Sculley, J. Yu, H.-K. Jeong, P. B. Balbuena, and H.-C. Zhou, Coord. Chem. Rev. 255, 1791 (2011).
- Qiu and Zhu (2009) S. Qiu and G. Zhu, Coord. Chem. Rev. 253, 2891 (2009).
- Nijem et al. (2012) N. Nijem, H. Wu, P. Canepa, A. Marti, K. J. Balkus, T. Thonhauser, J. Li, and Y. J. Chabal, J. Am. Chem. Soc. 134, 15201 (2012).
- Lee et al. (2015) K. Lee, J. D. Howe, L.-C. Lin, B. Smit, and J. B. Neaton, Chem. Mater. 27, 668 (2015).
- Zhao et al. (2008) D. Zhao, D. Yuan, and H.-C. Zhou, Energy Environ. Sci. 1, 222 (2008).
- Rosi et al. (2003) N. L. Rosi, J. Eckert, M. Eddaoudi, D. T. Vodak, J. Kim, M. O’Keeffe, and O. M. Yaghi, Science 300, 1127 (2003).
- Wu et al. (2012) H. Wu, Q. Gong, D. H. Olson, and J. Li, Chem. Rev. 112, 836 (2012).
- He et al. (2014) Y. He, W. Zhou, G. Qian, and B. Chen, Chem. Soc. Rev. 43, 5657 (2014).
- Kreno et al. (2012) L. E. Kreno, K. Leong, O. K. Farha, M. Allendorf, R. P. Van Duyne, and J. T. Hupp, Chem. Rev. 112, 1105 (2012).
- Canepa et al. (2015) P. Canepa, K. Tan, Y. Du, H. Lu, Y. J. Chabal, and T. Thonhauser, J. Mater. Chem. A 3, 986 (2015).
- Serre et al. (2007) C. Serre, C. Mellot-Draznieks, S. Surblé, N. Audebrand, Y. Filinchuck, and G. Férey, Science 315, 1828 (2007).
- Allendorf et al. (2008) M. D. Allendorf, R. J. T. Houk, L. Andruskiewicz, A. A. Talin, J. Pikarsky, A. Choundhury, K. A. Gall, and P. J. Hensketh, J. Am. Chem. Soc. 130, 14404 (2008).
- Tan and Cheetham (2011) J.-C. Tan and A. K. Cheetham, Chem. Soc. Rev. 40, 1059 (2011).
- Hu et al. (2014) Z. Hu, B. J. Deibert, and J. Li, Chem. Soc. Rev. 43, 5815 (2014).
- Uemura et al. (2009) T. Uemura, N. Yanai, and S. Kitagawa, Chem. Soc. Rev. 38, 1228 (2009).
- Vitorino et al. (2009) M. J. Vitorino, T. Devic, M. Tromp, G. Férey, and M. Visseaux, Macromol. Chem. Phys. 210, 1923 (2009).
- Allendorf et al. (2009) M. D. Allendorf, C. A. Bauer, R. K. Bhakta, and R. Houk, Chem. Soc. Rev. 38, 1330 (2009).
- White et al. (2009) K. A. White, D. A. Chengelis, K. A. Gogick, J. Stehman, N. L. Rosi, and S. Petoud, J. Am. Chem. Soc. 131, 18069 (2009).
- Bordiga et al. (2004) S. Bordiga, C. Lamberti, G. Ricchiardi, L. Regli, F. Bonino, A. Damin, K.-P. Lillerud, M. Bjorgen, and A. Zecchina, Chem. Commun. , 2300 (2004).
- Kurmoo (2009) M. Kurmoo, Chem. Soc. Rev. 38, 1353 (2009).
- Horcajada et al. (2010) P. Horcajada, T. Chalati, C. Serre, B. Gillet, C. Sebrie, T. Baati, J. Eubank, D. Heurtaux, P. Clayette, C. Kreuz, J.-S. Chang, Y. Hwang, V. Marsaud, P.-N. Bories, L. Cynober, S. Gil, G. Férey, P. Couvreur, and R. Gref, Nat. Mater. 9, 172 (2010).
- Stroppa et al. (2011) A. Stroppa, P. Jain, P. Barone, M. Marsman, J. M. Perez-Mato, A. K. Cheetham, H. W. Kroto, and S. Picozzi, Angew. Chem., Int. Ed. 50, 5847 (2011).
- Stroppa et al. (2013) A. Stroppa, P. Barone, P. Jain, J. M. Perez-Mato, and S. Picozzi, Adv. Mater. 25, 2284 (2013).
- Di Sante et al. (2013) D. Di Sante, A. Stroppa, P. Jain, and S. Picozzi, J. Am. Chem. Soc. 135, 18126 (2013).
- Wu and Lin (2007) C.-D. Wu and W. Lin, Angew. Chem. Int. Ed. 46, 1075 (2007).
- Lee et al. (2009) J. Lee, O. K. Farha, J. Roberts, K. A. Scheidt, S. T. Nguyen, and J. T. Hupp, Chem. Soc. Rev. 38, 1450 (2009).
- Zou et al. (2006) R.-Q. Zou, H. Sakurai, and Q. Xu, Angew. Chemie Int. Ed. 45, 2542 (2006).
- Luz et al. (2010) I. Luz, F. X. Llabrés i Xamena, and A. Corma, J. Catal. 276, 134 (2010).
- Liu et al. (2008) Y. Liu, H. Kabbour, C. M. Brown, D. A. Neumann, and C. C. Ahn, Langmuir 24, 4772 (2008).
- Zhou et al. (2008) W. Zhou, H. Wu, and T. Yildirim, J. Am. Chem. Soc. 130, 15268 (2008).
- Wu et al. (2010) H. Wu, J. M. Simmons, G. Srinivas, W. Zhou, and T. Yildirim, J. Phys. Chem. Lett. 1, 1946 (2010).
- Dietzel et al. (2008) P. D. C. Dietzel, R. E. Johnsen, H. Fjellvåg, S. Bordiga, E. Groppo, S. Chavan, and R. Blom, Chem. Commun. , 5125 (2008).
- Caskey et al. (2008) S. R. Caskey, A. G. Wong-Foy, and A. J. Matzger, J. Am. Chem. Soc. 130, 10870 (2008).
- Valenzano et al. (2010) L. Valenzano, B. Civalleri, S. Chavan, G. T. Palomino, C. O. Areán, and S. Bordiga, J. Phys. Chem. C 114, 11185 (2010).
- Wu et al. (2009) H. Wu, W. Zhou, and T. Yildirim, J. Am. Chem. Soc. 131, 4995 (2009).
- Valvekens et al. (2014) P. Valvekens, M. Vandichel, M. Waroquier, V. Van Speybroeck, and D. De Vos, J. Catal. 317, 1 (2014).
- Yao et al. (2014) H.-F. Yao, Y. Yang, H. Liu, F.-G. Xi, and E.-Q. Gao, J. Mol. Catal. A: Chem 394, 57 (2014).
- Kim et al. (2015) T. Kim, D. H. Kim, S. Kim, Y. D. Kim, Y.-S. Bae, and C. Y. Lee, Polyhedron 90, 18 (2015).
- Sun et al. (2015) D. Sun, F. Sun, X. Deng, and Z. Li, Inorg. Chem. 54, 8639 (2015).
- Zhang et al. (2015) Y. Zhang, Y. Liu, X. Zhang, Y. Li, M. Gao, and H. Pan, J. Phys. Chem. C 119, 24760 (2015).
- Ruano et al. (2015) D. Ruano, M. Díaz-García, A. Alfayate, and M. Sánchez-Sánchez, Chem. Cat. Chem. 7, 674 (2015).
- Zuluaga et al. (2016a) S. Zuluaga, E. M.-A. Fuentes-Fernandez, K. Tan, F. Xu, J. Li, Y. J. Chabal, and T. Thonhauser, J. Mater. Chem. A 4, 5176 (2016a).
- Tan et al. (2014) K. Tan, S. Zuluaga, Q. Gong, P. Canepa, H. Wang, J. Li, Y. J. Chabal, and T. Thonhauser, Chem. Mater. 26, 6886 (2014).
- Tan et al. (2015) K. Tan, N. Nijem, Y. Gao, S. Zuluaga, J. Li, T. Thonhauser, and Y. J. Chabal, CrystEngComm 17, 247 (2015).
- Gu et al. (2011) X. Gu, Z.-H. Lu, H.-L. Jiang, T. Akita, and Q. Xu, J. Am. Chem. Soc 133, 11822 (2011).
- Tedsree et al. (2011) K. Tedsree, T. Li, S. Jones, C. Wong, A. Chan, K. M. K. Yu, P. A. J. Bagot, E. A. Marquis, G. D. W. Smith, and S. C. E. Tsang, Nature Nanotech. 6, 302 (2011).
- Zell et al. (2013) T. Zell, B. Butschke, Y. Ben-David, and D. Milstein, Chem. Eur. J. 19, 25 (2013).
- Zhang et al. (2013) S. Zhang, Ã. Metin, D. Su, and S. Sun, Angew. Chem. Int. Ed. 52, 3681 (2013).
- Joó (2008) F. Joó, ChemSusChem 1, 805 (2008).
- Ha et al. (2006) S. Ha, Z. Dunbar, and R. I. Masel, J. Power Sources 158, 129 (2006).
- Chang et al. (2014) J. Chang, L. Feng, C. Liu, W. Xing, and X. Hu, Angew. Chem. Int. Ed. 53, 122 (2014).
- Shen et al. (2013) L. Shen, H. Li, L. Lu, Y. Luo, Y. Tang, Y. Chen, and T. Lu, Electrochim. Acta 89, 497 (2013).
- Feng et al. (2011) L. Feng, L. Yan, Z. Cui, C. Liu, and W. Xing, J. Power Sources 196, 2469 (2011).
- Yao et al. (2012) Y. Yao, N. Nijem, J. Li, Y. J. Chabal, D. C. Langreth, and T. Thonhauser, Phys. Rev. B 85, 064302 (2012).
- Giannozzi et al. (2009) P. Giannozzi, S. Baroni, N. Bonini, M. Calandra, R. Car, C. Cavazzoni, D. Ceresoli, G. L. Chiarotti, M. Cococcioni, I. Dabo, A. Dal Corso, S. de Gironcoli, S. Fabris, G. Fratesi, R. Gebauer, U. Gerstmann, C. Gougoussis, A. Kokalj, M. Lazzeri, L. Martin-Samos, N. Marzari, F. Mauri, R. Mazzarello, S. Paolini, A. Pasquarello, L. Paulatto, C. Sbraccia, S. Scandolo, G. Sclauzero, A. P. Seitsonen, A. Smogunov, P. Umari, and R. M. Wentzcovitch, J. Phys. Condens. Matter 21, 395502 (2009).
- Thonhauser et al. (2015) T. Thonhauser, S. Zuluaga, C. A. Arter, K. Berland, E. Schröder, and P. Hyldgaard, Phys. Rev. Lett. 115, 136402 (2015).
- Berland et al. (2015) K. Berland, V. R. Cooper, K. Lee, E. Schröder, T. Thonhauser, P. Hyldgaard, and B. I. Lundqvist, Rep. Prog. Phys. 78, 066501 (2015).
- Langreth et al. (2009) D. C. Langreth, B. I. Lundqvist, S. D. Chakarova-Käck, V. R. Cooper, M. Dion, P. Hyldgaard, A. Kelkkanen, J. Kleis, L. Kong, S. Li, P. G. Moses, E. D. Murray, A. Puzder, H. Rydberg, E. Schröder, and T. Thonhauser, J. Phys. Condens. Matter 21, 084203 (2009).
- Thonhauser et al. (2007) T. Thonhauser, V. R. Cooper, S. Li, A. Puzder, P. Hyldgaard, and D. C. Langreth, Phys. Rev. B 76, 125112 (2007).
- Henkelman et al. (2000) G. Henkelman, B. P. Uberuaga, and H. Jónsson, J. Chem. Phys. 113, 9901 (2000).
- Henkelman and Jónsson (2000) G. Henkelman and H. Jónsson, J. Chem. Phys. 113, 9978 (2000).
- Millikan and Pitzer (1958) R. C. Millikan and K. S. Pitzer, J. Am. Chem. Soc. 80, 3515 (1958).
- Zuluaga et al. (2016b) S. Zuluaga, E. M. A. Fuentes-Fernandez, K. Tan, J. Li, Y. J. Chabal, and T. Thonhauser, J. Mater. Chem. A (2016b), 10.1039/C6TA02501C, in print.
- Canepa et al. (2013a) P. Canepa, N. Nijem, Y. J. Chabal, and T. Thonhauser, Phys. Rev. Lett. 110, 026102 (2013a).
- Lee et al. (2012) D.-J. Lee, D.-J. Li, H. Kim, and K. Lee, Microporous Mesoporous Mater. 163, 169 (2012).
- Lin et al. (2013) L.-C. Lin, J. Kim, X. Kong, E. Scott, T. M. McDonald, J. R. Long, J. A. Reimer, and B. Smit, Angew. Chem. Int. Ed. 52, 1521 (2013).
- Canepa et al. (2013b) P. Canepa, C. A. Arter, E. M. Conwill, D. H. Johnson, B. A. Shoemaker, K. Z. Soliman, and T. Thonhauser, J. Mater. Chem. A 1, 13597 (2013b).