11email: rmcelroy@physics.usyd.edu.au 22institutetext: ARC Centre of Excellence for All-sky Astrophysics (CAASTRO) 33institutetext: European Southern Observatory (ESO), Karl-Schwarzschild-Str. 2, D-85478 Garching b. München, Germany, ESO Fellow 44institutetext: School of Physics & Astronomy, Cardiff University, Queens Buildings, The Parade, Cardiff, CF24 3AA, UK 55institutetext: Physics Department, California Polytechnic State University, San Luis Obispo, CA 93407, USA 66institutetext: I. Physikalisches Institut, Universität zu Köln, Zülpicher Straße 77, 50937 Köln, Germany 77institutetext: LERMA, Observatoire de Paris, College de France, PSL, CNRS, Sorbonne Univ., UPMC, F-75014 Paris, France 88institutetext: Max-Planck-Institut für Radioastronomie, Auf dem Hügel 69, D-53121 Bonn, Germany 99institutetext: Instituto de Astrophisica de Andalucia (IAA), Glorieta de la Astronomía, s/n, ES-18008 Granada, Spanien 1010institutetext: Yale Center for Astronomy and Astrophysics, Yale University, 52 Hillhouse Ave., New Haven, CT 06511, USA, Einstein Fellow 1111institutetext: Gemini Observatory, Northern Operations Center, 670 N. A’ohoku Place, Hilo, HI, 96720, USA 1212institutetext: Leibniz-Institut füer Astrophysik Potsdam (AIP), An der Sternwarte 16, D-14482 Potsdam, Germany
The Close AGN Reference Survey (CARS)
We report the discovery that the known ‘changing look’ AGN Mrk 1018 has changed spectral type for a second time. New VLT-MUSE data taken in 2015 as part of the Close AGN Reference Survey (CARS) shows that the AGN has returned to its original Seyfert 1.9 classification. The CARS sample is selected to contain only bright type 1 AGN, but Mrk 1018’s broad emission lines and continuum, typical of type 1 AGN, have almost entirely disappeared. We use spectral fitting of the MUSE spectrum and previously available spectra to determine the drop in broad line flux and the Balmer decrement. We find that the broad line flux has decreased by a factor of in H since an SDSS spectrum was taken in 2000. The Balmer decrement has not changed significantly implying no enhanced reddening with time, but the remaining broad lines are more asymmetric than those present in the type 1 phase. We posit that the change is due to an intrinsic drop in flux from the accretion disk rather than variable extinction or a tidal disruption event.
Key Words.:
Galaxies: individual, Seyfert1 Introduction
The various spectral classes of active galactic nuclei (AGN) have been unified based on the inclination of the accreting black hole (BH) to the line of sight (see Antonucci, 1993). Under this scheme type 1 AGN, distinguished by their extremely broad permitted optical emission lines, are inclined to the observer such that we have a direct view onto the accretion disk. Type 2 AGN, devoid of these broad emission lines, possess only narrow lines suggesting that radiation from their accretion disks is blocked by what is commonly assumed to be a dusty torus. Intermediate objects complicate this simple dichotomy and are labelled as type 1.2, 1.5, 1.8, or 1.9 depending on the breadth and relative flux of narrow and broad emission lines (Osterbrock & Koski, 1976).
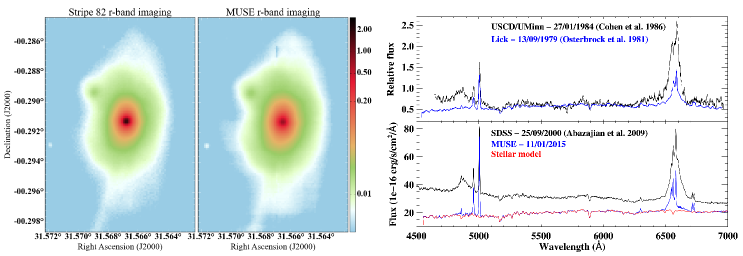
Mrk 1018, a late-stage merger at (see Figure 1), was one of the earliest examples of a ‘changing look’ AGN, changing from a type 1.9 to 1 over the course of 5 years (Cohen et al., 1986). Since then a number of galaxies have been found to change type optically (e.g. Aretxaga et al., 1999; Denney et al., 2014) or in the X-ray domain (e.g. LaMassa et al., 2015; Ricci et al., 2016). A much smaller sample of AGN have changed spectral type not once, but twice. Only a few galaxies have been observed to undergo this full cycle. Mrk 590 was observed to change from a type 1.5 to 1.0 from 1973 to 1989, then to gradually lose all evidence of broad lines until 2014 when it appeared as a type 2 AGN (Osterbrock, 1977; Denney et al., 2014). Similarly NGC 4151, originally classified as a Seyfert 1.5, lost then regained its broad emission lines (Osterbrock, 1977; Antonucci & Cohen, 1983; Shapovalova et al., 2010).
Recent work on accretion timescales suggests that AGN flicker on short timescales, years, rather than remaining at a constant luminosity (Schawinski et al., 2015). Elitzur et al. (2014) posit that AGN may not be statically type 1 or type 2 throughout their lifetimes, and can change type as they increase or decrease in luminosity. AGN that have changed type can help us to understand the accretion physics and associated timescales.
A few hypotheses are used to explain why AGN change spectral type. Variable obscuration of the nuclear region or a patchy torus would allow for the same object to be viewed as a type 1 or type 2 AGN over time (Elitzur, 2012). In this scenario, the intervening absorption along our line of sight is changing and not the intrinsic luminosity. An alternative option is that a drop (or increase) in the accretion rate onto the BH leads to a different AGN classification. Merloni et al. (2015) discuss how tidal disruption events (TDE) of stars close the central BH cause AGN to flare and dramatically increase their luminosity leading to their classification as changing look AGN.
In this paper, we present the serendipitous discovery that Mrk 1018 has changed type again. New data show that Mrk 1018 presents spectral signatures typical of a type 1.9 AGN once more, with drastically dimmed broad lines and continuum.
2 Observations and data analysis
2.1 MUSE 3D spectroscopy
We observed Mrk 1018 with the Multi-Unit Spectroscopic Explorer (MUSE, Bacon et al., 2010) at the Very Large Telescope on 2015 Jan 11 as part of the Close AGN Reference Survey (CARS, cars-survey.org). CARS aims to provide a detailed multiwavelength view of 40 nearby () type 1 AGN.
Mrk 1018 was observed under clear sky conditions at an average seeing of and split into two 400 s exposure with a rotation of the FoV by . We reduced the data with the ESO-MUSE pipeline v1.2.1 (Weilbacher et al., 2012) using the standard calibrations. The sky background was estimated and subtracted from the object free signal in the large field of view (FoV) of MUSE using the pipeline. The final cubes are sampled at per spaxel and cover a wavelength range of 4750–9300 with a spectral resolution of (FWHM).
| Source | Date | Rest -range (Å) | Ref. |
|---|---|---|---|
| Lick | 1979 Sept 13 | 4500 - 8800 | (1) |
| USCD/UMinn | 1984 Jan 27 | 4500 - 6900 | (2) |
| HST | 1996 Oct 8 | 6200 - 9200 | |
| SDSS | 2000 Sept 25 | 3600 - 8800 | (3) |
| HES | 2000 Dec 1 | 3400 - 8700 | (4) |
| 6df | 2004 Aug 15 | 3700 - 7200 | (5) |
| Keck | 2009 Jan 22 | 3400 - 5300 | (6) |
| MUSE | 2015 Jan 11 | 4500 - 9000 | (7) |
Mrk 1018 shows spectral features of a type 1.9 AGN (see Fig. 1) with a nearly undetectable broad H line. However, several previous spectroscopic observations (listed in Table 1) are consistent with a type 1 AGN. Thus, our new MUSE observations show that Mrk 1018 has changed optical spectral type again after 30 years of being a luminous unobscured AGN 111 Continuous photometry and spectroscopy are not available for the entire 30 years, but the FUV observations from 1984 and 1996 are consistent in flux implying little change during that period..
2.2 Continuum and emission line analysis
We take the SDSS spectrum (Table 1) to be representative of Mrk 1018’s bright state. We extract an equivalent MUSE spectrum using a 3” diameter aperture centred on the AGN position and correct for absolute flux calibration offsets by matching the strength of stellar absorption lines. The MUSE spectrum has weaker AGN continuum and broad emission lines allowing us to model the stellar continuum by fitting a super-position of Indo-U.S. Library of Coudé Feed Stellar Spectra (Valdes et al., 2004) with ppxf (Cappellari & Emsellem, 2004) excluding regions with emission lines. The MUSE spectrum and the best-fit continuum model are shown on the bottom right of Fig. 1. We subtract this stellar contribution from the MUSE and SDSS spectra.
A faint broad H emission line is clearly recovered in the MUSE data after continuum subtraction. We fit both the narrow and broad emission lines as a super-position of Gaussians and an additional local power-law continuum for the SDSS spectrum. The light travel time to the narrow line region (NLR) is likely hundreds of years. As such, no significant change in flux is expected within ten years, which is consistent with the data. For accurate H and H emission line fluxes we must rely on the extrapolated stellar continuum model, which is made up of a subset of the stellar templates. Uncertainty due to template mismatch is simulated by selecting a random subset of 16 templates from the 504 in the full Indo-U.S. library and repeating the fitting 100 times. We then measure the variance of the output fluxes.
From the emission-line modelling we obtain broad H line fluxes of and for the SDSS and MUSE spectra, respectively, corresponding to a flux decrease of a factor of . Here we adopt , , and . Similarly, we obtain broad H line fluxes of and corresponding to H dimming of a factor of . The Balmer decrement of H to H is for the MUSE spectrum and for the SDSS spectrum. Extinction has not increased as new obscuration along the line of sight to the BLR would lead to an increased Balmer decrement.
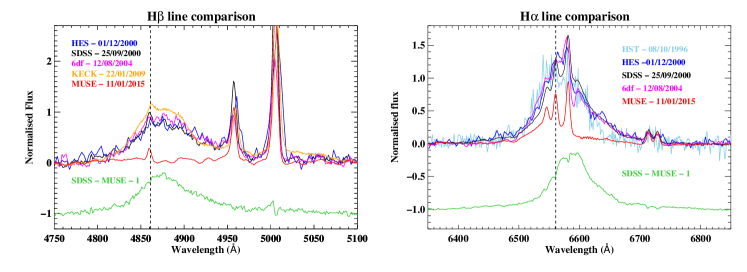
The evolution of the H and H emission line profiles are shown in Fig. 2 over the period 1996-2014. While the broad-line shape remains almost unchanged during the bright state, our most recent MUSE spectrum shows a drastically different profile. More flux is lost on the red wing, as shown by the difference between the SDSS and MUSE spectra (green lines) in Fig. 2. The residual is redshifted with respect to the systemic redshift. The Keck spectrum was the last one obtained during the bright state and the H line shows a decrease on the red side. We find broad H line width (FWHM) of (SDSS) and (MUSE). We expect the broad line width to increase as the AGN luminosity falls to preserve derived MBH estimates (Ruan et al., 2015). However, following Woo et al. (2015) we infer single-epoch BH masses of and in the high and low states, respectively. This may suggest that the BLR is not in an equilibrium state or the virial factor has changed.
2.3 Photometry
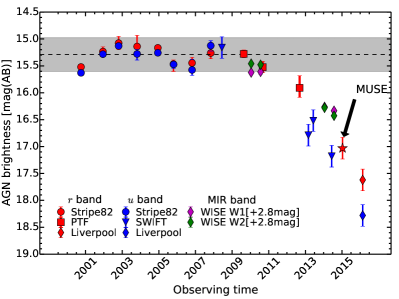
We study the long-term variability of Mrk 1018 with archival observations in MIR and optical ( and ) bands. These include SDSS Stripe 82 (Abazajian et al., 2009), Palomar transient factory (PTF, Law et al., 2009), SWIFT UV-optical telescope (Roming et al., 2005), Liverpool telescope imaging (February 2016) in the optical, and WISE in the MIR (Wright et al., 2010).
It is crucial to decompose the AGN and host galaxy light to infer the intrinsic variability of the nucleus. We estimate the 2D surface brightness distribution of the host galaxy by fitting a simple two-component – PSF plus Sersić – to the deep and band co-added Stripe 82 images with GALFIT (Peng et al., 2002). The best-fit parameters for the Sersić model are slightly different with , and for the band and , , and for the band. We then fit each individual image keeping those parameters fixed for the and band, and use an empirically constrained PSF from a bright unsaturated star close to Mrk 1018. Only integrated magnitudes can be reported for the WISE images.
The late evolution in the AGN light curve is shown in Fig. 3. The mean magnitude of the nucleus was 15.28 mag (AB) in the r band with a scatter of 0.15 dex (1) prior to the rapid decline. The constant host magnitude within 5” is 15.57 mag (AB), implying that the luminosity of the AGN has dropped from 1.3 to 0.3 times that of the host. The latest data point from Liverpool telescope indicates that the AGN brightness is still declining.
3 Discussion
Our spectroscopic analysis shows that the H broad emission line flux in the MUSE spectrum (2015) is a factor of 4.75 lower compared to the SDSS spectrum (2000) and has changed shape markedly. The multi-epoch photometry shown in Fig. 3 indicates that rather than peaking in luminosity before dimming to its current state, Mrk 1018 had a relatively constant luminosity before dropping. Below we discuss the possible scenarios that could have led to the apparent dimming of the nucleus.
The tidal disruption of a massive star by the central BH can cause AGN to change spectral type due to a flare in accretion. A tidally disrupted star temporally provides fuel for the nucleus until it is destroyed or is too far away (Merloni et al., 2015). We calculate the mass accreted during the bright phase assuming that the luminosity remained constant. Our measurements of and MBH from the SDSS spectrum lead to a bolometric luminosity of and Eddington ratio of . Taking the efficiency of an accretion disk to be 0.1, this gives a mass accretion rate of 0.055 M⊙ or a total mass accreted over the bright phase ( 30 years) of 1.65 M⊙. Typically, 50% of the disrupted star’s mass is accreted, requiring a 3.2 M⊙ star. While this could come from a single star, a TDE is characterised by a rapid increase in AGN luminosity, which then peaks before decreasing again over a maximum of several years (Guillochon & Ramirez-Ruiz, 2013). We see a 30-year plateau in Mrk 1018’s luminosity and no defined peak (only the last 10 years are shown in Fig. 3). To our knowledge, no TDE model predicts a bright phase this prolonged, which leads us to conclude that it is unlikely that a TDE caused Mrk 1018’s recent change.
Could Mrk 1018’s change be the result of a declining accretion rate? As the ionising radiation from an AGN falls, the broad line emission comes from faster moving BLR gas closer to the BH. Observationally, the BLR luminosity should drop, velocity dispersion should increase, and the shape of the lines may change. Therefore, if the altered broad line shape is due to decreased AGN luminosity, the velocity dispersion of the emission lines should increase. We observe the opposite. The BLR represents a potential reservoir of fuel for the accretion disk approximately 24 light days away (following Bentz et al. (2013) using converted to (Woo et al., 2015)). This is equivalent to a radial inflow time of 5 years based on the measured velocity dispersion. If the declining accretion rate were due to gradual depletion of fuel we would not expect continuing BLR emission. A disruption of the accretion flow could cause the disc to be temporarily starved, while leaving the BLR unconsumed. The observed decrease – rather than increase – in velocity dispersion as the nuclear luminosity fell may be due to a change in the virial factor. This would imply that the BLR structure and kinematics have been altered. Since Mrk 1018 is a late-stage major merger, two SMBHs may orbit one another at the centre of the galaxy. Such a nearby massive object may cause instabilities in the accretion disk and BLR, leading to a rapid drop in accretion rate and changed emission line shape. We lack the spatial resolution to resolve a hypothetical dual SMBH system, which can only be done with long baseline radio interferometry.
We see no evidence for increased extinction, but it is possible that there is new gas or dust along our line of sight blocking our view to the AGN. To explain the lack of reddening this obstacle would have to be extremely opaque with a very high . Additionally, the obscuring material would have to be placed such that select parts of the BLR are still visible. This could explain the new line shape as the redshifted wing of the broad line may be in the region that is blocked from view. However, this argument requires a complex and convoluted geometry in order to explain our observations.
4 Conclusions
In this letter we presented evidence for the AGN Mrk 1018 returning to its Seyfert 1.9 state after 30 years as a Seyfert 1. Using MUSE data from the Close AGN Reference Survey alongside archival spectroscopic and photometric observations we explored the possible causes of this change: a decline in accretion rate or lack of fuel, a TDE, obscuration, or disruption of the accretion disk. We reason that the length and consistency of Mrk 1018’s bright phase makes a TDE an unlikely explanation, but we cannot rule out a simple decline in accretion rate. The Balmer decrement between the Seyfert 1 and 1.9 phases implies that the obscuration along our line of sight has not increased, but a highly opaque column of gas selectively obscuring our view is still a possibility.
In light of this exciting discovery we were awarded Chandra, HST, and VLA director’s discretionary time to investigate how Mrk 1018 has changed since our MUSE observations. While the data presented in this paper cannot definitively tell us the nature of the change in Mrk 1018’s nucleus, these newer observations in the UV, X-ray, and radio bands will provide further constraints.
Acknowledgements.
Based on observations made with ESO Telescopes at the La Silla Paranal Observatory under programme ID 94.B-0345 and the Liverpool Telescope operated on the island of La Palma by Liverpool John Moores University in the Spanish Observatorio del Roque de los Muchachos of the Instituto de Astrofisica de Canarias. Parts of this research were conducted by the Australian Research Council Centre of Excellence for All-sky Astrophysics, through project number CE110001020. GRT acknowledges support from NASA through Einstein Postdoctoral Fellowship Award Number PF-150128, issued by the Chandra X-ray Observatory Center, which is operated by the Smithsonian Astrophysical Observatory for and on behalf of NASA under contract NAS8-03060. TAD acknowledges support from a Science and Technology Facilities Council Ernest Rutherford Fellowship. VNB gratefully acknowledges assistance from a NSF Research at Undergraduate Institutions grant AST-1312296. Findings and conclusions do not necessarily represent the views of the NSF. MAPT acknowledges support from the Spanish MINECO through grant AYA2015-63939-C2-1-P.References
- Abazajian et al. (2009) Abazajian, K. N., Adelman-McCarthy, J. K., Agüeros, M. A., et al. 2009, ApJS, 182, 543
- Antonucci (1993) Antonucci, R. 1993, ARAA, 31, 473
- Antonucci & Cohen (1983) Antonucci, R. R. J. & Cohen, R. D. 1983, ApJ, 271, 564
- Aretxaga et al. (1999) Aretxaga, I., Joguet, B., Kunth, D., Melnick, J., & Terlevich, R. J. 1999, ApJ, 519, L123
- Bacon et al. (2010) Bacon, R., Accardo, M., Adjali, L., et al. 2010, in Proc. SPIE, Vol. 7735, Ground-based and Airborne Instrumentation for Astronomy III, 773508
- Bennert et al. (2011) Bennert, V. N., Auger, M. W., Treu, T., Woo, J.-H., & Malkan, M. A. 2011, ApJ, 726, 59
- Bentz et al. (2013) Bentz, M. C., Denney, K. D., Grier, C. J., et al. 2013, ApJ, 767, 149
- Cappellari & Emsellem (2004) Cappellari, M. & Emsellem, E. 2004, PASP, 116, 138
- Cohen et al. (1986) Cohen, R. D., Puetter, R. C., Rudy, R. J., Ake, T. B., & Foltz, C. B. 1986, ApJ, 311, 135
- Denney et al. (2014) Denney, K. D., De Rosa, G., Croxall, K., et al. 2014, ApJ, 796, 134
- Elitzur (2012) Elitzur, M. 2012, ApJ, 747, L33
- Elitzur et al. (2014) Elitzur, M., Ho, L. C., & Trump, J. R. 2014, MNRAS, 438, 3340
- Guillochon & Ramirez-Ruiz (2013) Guillochon, J. & Ramirez-Ruiz, E. 2013, ApJ, 767, 25
- Jones et al. (2009) Jones, D. H., Read, M. A., Saunders, W., et al. 2009, MNRAS, 399, 683
- LaMassa et al. (2015) LaMassa, S. M., Cales, S., Moran, E. C., et al. 2015, ApJ, 800, 144
- Law et al. (2009) Law, N. M., Kulkarni, S. R., Dekany, R. G., et al. 2009, PASP, 121, 1395
- Merloni et al. (2015) Merloni, A., Dwelly, T., Salvato, M., et al. 2015, MNRAS, 452, 69
- Osterbrock (1977) Osterbrock, D. E. 1977, ApJ, 215, 733
- Osterbrock (1981) Osterbrock, D. E. 1981, ApJ, 249, 462
- Osterbrock & Koski (1976) Osterbrock, D. E. & Koski, A. T. 1976, MNRAS, 176, 61P
- Peng et al. (2002) Peng, C. Y., Ho, L. C., Impey, C. D., & Rix, H.-W. 2002, AJ, 124, 266
- Ricci et al. (2016) Ricci, C., Bauer, F. E., Arevalo, P., et al. 2016, ApJ, 820, 5
- Roming et al. (2005) Roming, P. W. A., Kennedy, T. E., Mason, K. O., et al. 2005, Space Sci. Rev., 120, 95
- Ruan et al. (2015) Ruan, J. J., Anderson, S. F., Cales, S. L., et al. 2015, ArXiv e-prints [arXiv:1509.03634]
- Schawinski et al. (2015) Schawinski, K., Koss, M., Berney, S., & Sartori, L. F. 2015, MNRAS, 451, 2517
- Shapovalova et al. (2010) Shapovalova, A. I., Popović, L. Č., Burenkov, A. N., et al. 2010, A&A, 509, A106
- Valdes et al. (2004) Valdes, F., Gupta, R., Rose, J. A., Singh, H. P., & Bell, D. J. 2004, ApJS, 152, 251
- Weilbacher et al. (2012) Weilbacher, P. M., Streicher, O., Urrutia, T., et al. 2012, in Proc. SPIE, Vol. 8451, Software and Cyberinfrastructure for Astronomy II, 84510B
- Wisotzki et al. (2000) Wisotzki, L., Christlieb, N., Bade, N., et al. 2000, A&A, 358, 77
- Woo et al. (2015) Woo, J.-H., Yoon, Y., Park, S., Park, D., & Kim, S. C. 2015, ApJ, 801, 38
- Wright et al. (2010) Wright, E. L., Eisenhardt, P. R. M., Mainzer, A. K., et al. 2010, AJ, 140, 1868