Multiwavelength monitoring and X-ray brightening of Be X-ray binary PSR J2032+4127/MT91 213 on its approach to periastron
Abstract
The radio and gamma-ray pulsar PSR J2032+4127 was recently found to be in a decades-long orbit with the Be star MT91 213, with the pulsar moving rapidly towards periastron. This binary shares many similar characteristics with the previously unique binary system PSR B125963/LS 2883. Here, we describe radio, X-ray, and optical monitoring of PSR J2032+4127/MT91 213. Our extended orbital phase coverage in radio, supplemented with Fermi LAT gamma-ray data, allows us to update and refine the orbital period to 45–50 yr and time of periastron passage to 2017 November. We analyse archival and recent Chandra and Swift observations and show that PSR J2032+4127/MT91 213 is now brighter in X-rays by a factor of since 2002 and since 2010. While the pulsar is still far from periastron, this increase in X-rays is possibly due to collisions between pulsar and Be star winds. Optical observations of the H emission line of the Be star suggest that the size of its circumstellar disc may be varying by over timescales as short as 1–2 months. Multiwavelength monitoring of PSR J2032+4127/MT91 213 will continue through periastron passage, and the system should present an interesting test case and comparison to PSR B125963/LS 2883.
keywords:
stars: emission line, Be – stars: individual: MT91 213 – stars: neutron – pulsars: individual: PSR B125963, PSR J2032+4127 – X-rays: binaries – X-rays: individual: PSR B125963, PSR J2032+4127.1 Introduction
Recent radio observations of the 143 ms pulsar PSR J2032+4127 find it to be part of a very eccentric, long orbital period binary system, with the pulsar expected to reach periastron in late 2017 with its high-mass, Be star companion (Lyne et al., 2015). The pulsar was discovered by Fermi LAT (Abdo et al., 2009) and is associated with TeV source TeV J2032+4130 (Camilo et al., 2009). These characteristics make the PSR J2032+4127 binary system very similar to the previously unique pulsar system PSR B125963/LS 2883 (see, e.g. Dubus 2013, for review), and X-ray results reported here support this similarity.
Subsequent to its discovery in gamma rays, PSR J2032+4127 was detected in radio by Camilo et al. (2009), who also reanalysed a 49 ks Chandra observation taken in 2004 of the field of the Cygnus OB2 association (at a distance ; Kiminki et al. 2015), to which the pulsar likely belongs. They confirm an X-ray source at the position of the radio source, which also corresponds to optical source 213 of Massey & Thompson (1991), a B0 V star (hereafter MT91 213). MT91 213 has a mass of either (Wright et al., 2015) or (Kiminki et al., 2007) and bolometric luminosity (Wright et al., 2015), in broad agreement with values appropriate to its spectral and luminosity classification, i.e. and (Hohle et al., 2010). An optical spectrum shows MT91 213 has a H equivalent width (EW) of Å (Camilo et al., 2009), which is typical of Be stars and due to a circumstellar disc surrounding the star. Camilo et al. (2009) fit a power-law to the Chandra spectrum and find an unabsorbed 0.5–10 keV X-ray luminosity . This X-ray luminosity is compatible with that of either Be stars (see, e.g. Berghöfer et al. 1997; Gagné et al. 2011; Nazé et al. 2014) or pulsars of age (see, e.g. Yakovlev & Pethick 2004; Page et al. 2006; Potekhin et al. 2015), where the pulsar age is taken to be its characteristic spin-down age.
More recent analysis of timing observations of PSR J2032+4127 reveals that its timing noise can be removed by considering a timing model in which the pulsar is in an eccentric (with eccentricity ), decades-long orbit (Lyne et al., 2015). Because of the long orbital period, radio measurements up to that time only cover about 20% of the orbit, and previous observations (at all wavelengths) of the pulsar/Be-star binary system have been when the pulsar is on the apastron-side of the orbit. Fig. 1 shows a schematic diagram of the system. Radio and gamma-ray telescopes continue to monitor the pulsar as it moves towards periastron. These observations will refine the orbital parameters, including eccentricity and mass function, and could, along with VLBI measurements, directly determine distance and orbital inclination (Lyne et al., 2015).

Many of the above characteristics are typical of Be X-ray binary systems, albeit with orbital periods of , which can shine at up to Eddington luminosities () when the neutron star nears periastron and accretes matter from the circumstellar disc (of size a few times the Be star radius, and larger for isolated Be stars; Klus et al. 2014; Reig et al. 2016) of its Be star companion (Reig, 2011). In this work, we are concerned with X-ray (as well as radio and optical) emission when the pulsar is far from periastron and not accreting from the circumstellar disc of the Be star, which might occur near periastron. Thus the X-ray luminosity is expected to be much lower, as indeed we find, as well as a brightening that seems in accord with the well-studied 3.4 yr orbital period gamma-ray binary that contains PSR B125963. There are several previous Chandra observations of Cygnus OB2 (see Table 2), and although significantly off-axis, some of these contain the pulsar/Be-star binary system in the field of view. As discussed above, Camilo et al. (2009) describe results for the 2004 observation (ObsID 4501), while Rauw et al. (2015) describe results for the 2010 observations (ObsID 10944, 10945, 10951, 10962).
In Section 2, we report results of an updated timing solution based on monitoring at radio wavelengths, supplemented with Fermi LAT gamma-ray data. We (re)analyse all Chandra and Swift X-ray data, as well as our 2016 4.9 ks Chandra Target of Opportunity observation, and report our results in Section 3. In Section 4, we report on recent optical measurements of the H EW and their implication for the size of the Be star circumstellar disc. In Section 5, we summarize and briefly discuss our findings, including a few comparisons with PSR B125963/LS 2883.
2 Radio and gamma-ray observations and revised timing solution
Because of limited orbital phase coverage of observations of the pulsar since its discovery in 2009, there was strong covariance between several parameters of the orbital configuration reported in Lyne et al. (2015). Radio timing observations with the 76-m Lovell Telescope at Jodrell Bank continued during the subsequent two years. These observations, along with gamma-ray times of arrival (TOAs; see next), are all processed using the methodology described in Lyne et al. (2015), which uses the tempo2 (Hobbs et al., 2006) pulsar timing analysis package. Timing data now span a total of nearly 8 years, i.e. Modified Julian Date (MJD) 54689–57538.
Data from Fermi LAT are used to provide gamma-ray profiles and additional TOAs over the timespan of the radio data. We select Pass 8 LAT data, belonging to the SOURCE class as defined under the P8R2_SOURCE_V6 instrument response functions, from the start of the mission (2008 August 4) to 2016 May 23 (MJD 54682–57527) in a circular region of interest (ROI) centred on the pulsar position and with a radius. We choose events with energies from 100 MeV to 100 GeV and require the zenith angle to be . We restrict time intervals to be when LAT was in nominal science operations, data are flagged as good, and there are no corresponding bright solar flares or gamma-ray bursts. We perform a binned maximum likelihood analysis on a square region, including all sources in the 3FGL catalogue within 25∘ of the ROI centre (Acero et al., 2015). Diffuse emission components are modelled using gll_iem_v06.fits (Acero et al., 2016) and iso_P8R2_SOURCE_V6_v06.txt templates111http://fermi.gsfc.nasa.gov/ssc/data/access/lat/BackgroundModels.html. Analysis of spatial and spectral residuals does not reveal the need for any additional components.
Following the procedure outlined in Abdo et al. (2013), we model the gamma-ray spectrum of PSR J2032+4127 as either a power law, power law with exponential cutoff, or power law with exponential cutoff and free exponential index . We compare the best-fitting likelihood using each model and find significant curvature () and a preference for the model with being free (). The best-fitting model has a power law photon index of , cutoff energy of GeV, and ; uncertainties are purely statistical errors. These values do not agree, within uncertainties, with those of Abdo et al. (2013), but we note that their analysis uses three years of P7_V6 data and finds TS and thus uses . We perform spectral fits in 30 day bins of 95 flux measurements with only the normalization of PSR J2032+4127 free and calculate a value of TSvar (as defined in Acero et al. 2015) of 109, which is less than the threshold value of 128.80 and indicates no detectable flux variability [with a 1–100 GeV flux of , consistent with that of Acero et al. 2015]. Using the best-fit model with being free and events within of the ROI centre, we calculate spectral weights to enhance sensitivity (Kerr, 2011). We then use the weighted events to construct 95 TOAs (at -day cadence) as described in Ray et al. (2011).
The newly extended orbital phase coverage reduces covariance between fitted parameters and allows refinement of the timing model. While we cannot yet obtain a unique solution because the orbital period and eccentricity are still highly covariant, there is a one-dimensional family of tempo2 fits, which are summarized in Fig. 2, as a function of orbital period. The rms timing residuals reach an asymptotic minimum at about 0.42 ms for orbital periods approaching 17830 d, the period at which eccentricity is close to 1.0 and the system would be marginally bound. However, the mass function [, where and are the neutron star and Be star masses and is the orbital inclination] has a maximum value of [using , (see Sec. 1), and ], and Fig. 2 shows that corresponds to a binary period of 17670 d. Inspection of timing residuals from the best-fitting long-period models indicates that timing residuals are essentially ‘white’, with little evidence of any systematic departure of TOAs from the models. For periods shorter than about 16000 d, substantial systematic departures are seen, resulting in an observed increase in rms residuals. Any solution with orbital period of days, with corresponding eccentricity of , is likely to be acceptable. Parameters of three models spanning this acceptable range are presented in Table 1. For all such acceptable fits, the epoch of periastron is becoming well constrained at around MJD 58060(10), i.e. centred on early November 2017. Figure 1 illustrates one possible configuration of the system for d and (model 2 in Table 1). We note that there is no systematic deviation between radio and gamma-ray residuals through the whole data set, indicating that the ephemeris and dispersion measure (DM) are correct and that there is no detectable variation in DM yet.

| Parameter | Model 1 | Model 2 | Model 3 |
|---|---|---|---|
| Right ascension, (J2000.0) | |||
| Declination, (J2000.0) | |||
| Epoch of frequency, (MJD) | 55700.0 | 55700.0 | 55700.0 |
| Frequency, (Hz) | 6.980979(5) | 6.980975(6) | 6.980973(7) |
| Frequency time derivative, (s-2) | 0.5396(5) | 0.5538(4) | 0.5617(5) |
| Orbital period, (d) | 16000 | 17000 | 17670 |
| Epoch of periastron, (MJD) | 58053(1) | 58069(1) | 58068(2) |
| Projected semi-major axis, (light-second) | 7138(48) | 9022(216) | 16335(3737) |
| Eccentricity, | 0.936(1) | 0.961(2) | 0.989(5) |
| Longitude of periastron, (deg) | 52(1) | 40(1) | 21(5) |
| Mass function, () | 1.5 | 2.7 | 15.0 |
| Glitch epoch, (MJD) | 55810.77 | 55810.77 | 55810.77 |
| Frequency, ( Hz) | 1.9064(1) | 1.9073(1) | 1.9076(1) |
| Frequency time derivative, (s-2) | 0.501(8) | 0.545(7) | 0.564(6) |
| DM (pc cm-3) | 114.68(3) | 114.67(2) | 114.66(2) |
| DM time derivative, DM1 (pc cm-3yr-1) | 0.02(1) | 0.01(1) | 0.01(1) |
| rms timing residual, (ms) | 0.53 | 0.44 | 0.42 |
In summary, we conclude that PSR J2032+4127 is in a very eccentric and weakly bound system with an orbital period of 45–50 years. We now expect periastron to occur around the beginning of November 2017. However, we caution that the pulsar is rather young, with a characteristic age of about 200 kyr, and it may therefore suffer from some rotational timing noise. Our conclusions are based on the assumption that the pulsar is a perfect rotator and is not subject to significant timing noise which would distort measured Keplerian parameters of the binary system. On the other hand, the best models show little evidence for any unmodelled timing noise. Furthermore, as the pulsar approaches periastron, rapidly-changing Doppler effects are likely to dominate any effects of timing noise.
3 X-ray observations and results
3.1 Chandra
The field of PSR J2032+4127/MT91 213 is covered by several archival Chandra imaging observations made with the ACIS-I detector. We also obtained a targeted 4.9 ks exposure using ACIS-S on 2016 Feb 24. Details of these observations are given in Table 2.
| Telescope | ObsID | Date | MJD | Exposure | Count-rate | |
|---|---|---|---|---|---|---|
| ks | ks-1 | erg cm-2 s-1 | ||||
| Chandra | 4358 | 2002 Aug 11 | 52497.83 | 4.9 | ||
| Chandra | 4501 | 2004 Jul 19 | 53205.09 | 48.7 | ||
| Swift | 37744001 | 2008 Jun 16 | 54633.04 | 10.8 | ||
| Chandra | 10944 | 2010 Feb 1 | 55228.46 | 28.3 | ||
| Chandra | 10945 | 2010 Feb 1 | 55228.80 | 27.9 | ||
| Chandra | 10951 | 2010 Feb 11 | 55238.58 | 29.2 | ||
| Chandra | 10962 | 2010 Feb 22 | 55249.66 | 29.4 | ||
| Swift | 32767001 | 2013 Mar 28 | 56379.88 | 2.7 | ||
| Swift | 32767002 | 2013 Mar 29 | 56380.17 | 3.9 | ||
| Swift | 32767003 | 2015 Sep 19 | 57284.13 | 9.2 | ||
| Swift | 34282001 | 2016 Jan 22 | 57409.71 | 7.6 | ||
| Chandra | 18788 | 2016 Feb 24 | 57442.35 | 4.9 | ||
| Swift | 34282002 | 2016 Mar 4 | 57451.00 | 5.9 | ||
| Swift | 34282003 | 2016 Mar 18 | 57465.38 | 3.4 | ||
| Swift | 34282004 | 2016 Apr 1 | 57479.04 | 3.4 | ||
| Swift | 34282005 | 2016 Apr 15 | 57493.69 | 3.7 | ||
| Swift | 34282006 | 2016 May 1 | 57509.82 | 3.5 | ||
| Swift | 34282007 | 2016 May 4 | 57512.03 | 2.5 | ||
| Swift | 34282008 | 2016 May 16 | 57524.20 | 3.3 | ||
| Swift | 34282009 | 2016 May 27 | 57535.33 | 3.3 | ||
| Swift | 34282010 | 2016 Jun 1 | 57540.02 | 2.1 | ||
| Swift | 34282011 | 2016 Jun 11 | 57550.17 | 0.80 | ||
| Swift | 34282012 | 2016 Jun 18 | 57557.54 | 0.92 | ||
| Swift | 34282014 | 2016 Jul 4 | 57573.83 | 3.1 | ||
| Swift | 34282016 | 2016 Jul 10 | 57579.16 | 1.8 | ||
| Swift | 34282017/8 | 2016 Jul 22 | 57591.45 | 6.9 | ||
| Swift | 34282023 | 2016 Aug 19 | 57619.25 | 5.0 | ||
| Swift | 34282024 | 2016 Sep 2 | 57633.16 | 3.4 |
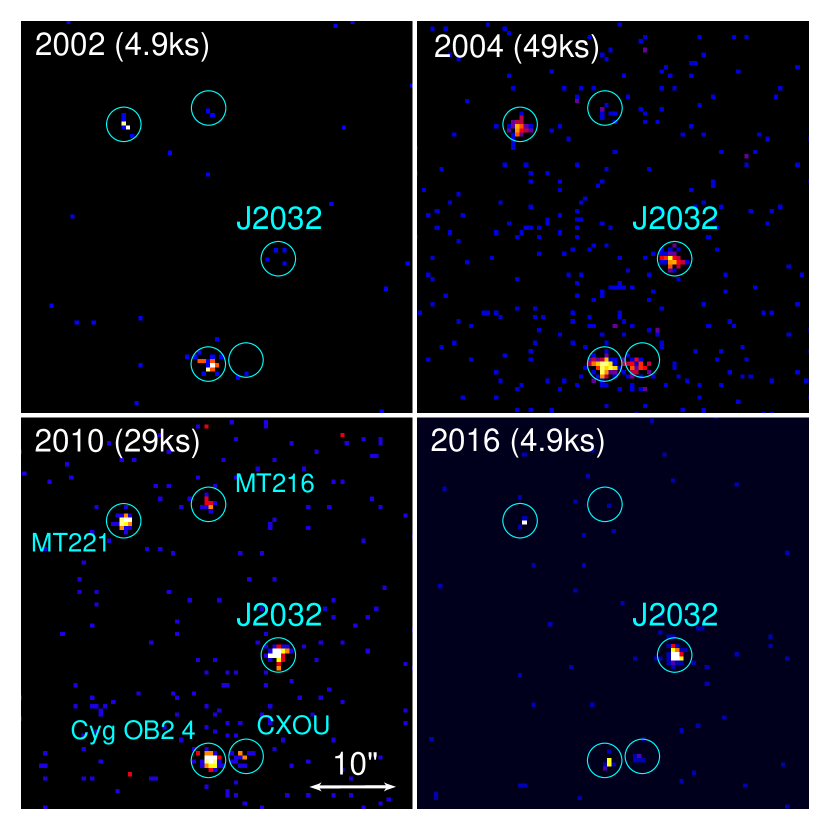
We carry out all Chandra data reduction and analysis using CIAO 4.8 with CALDB 4.7.1. We reprocess the data using the script chandra_repro, which applies the latest calibration. A subset of images in the energy range 0.5–7 keV is shown in Fig. 3. There are four other sources within 20″ of PSR J2032+4127, and their count-rates are listed in Table 3 (from the 2010 observations, only ObsID 10951 is used since these sources are located far off-axis in other exposures). Cygnus OB2 4 is a O7 III(f) star (Walborn, 1973). MT91 216 and MT91 221 are stars 216 and 221, respectively, of Massey & Thompson (1991), with MT91 216 being a B1.5 V star and MT91 221 being a B2 V star (Kiminki et al., 2007). From optical spectra, Camilo et al. (2009) identify CXOU J203213.5+412711 as a Be star that is also in Cygnus OB2.
| Date | Count-rate (ks-1) | ||||
|---|---|---|---|---|---|
| PSR J2032+4127/MT91 213 | Cygnus OB2 4 | MT91 221 | CXOU J203213.5+412711 | MT91 216 | |
| 2002 Aug 11 | |||||
| 2004 Jul 19 | |||||
| 2010 Feb 11 | |||||
| 2016 Feb 24 | |||||
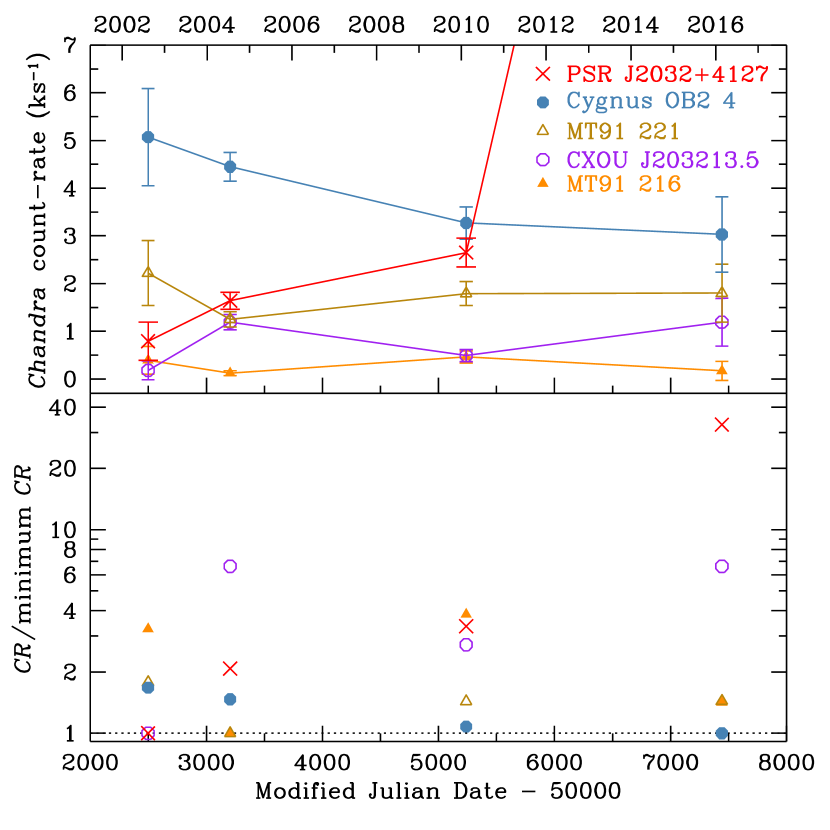
Accounting for the different exposure times of each image shown in Fig. 3, it is clear that PSR J2032+4127 is significantly brighter at the present time than in previous epochs and relative to neighboring X-ray sources. This is demonstrated quantitatively in Fig. 4, which shows count-rates as a function of time. The top panel shows Chandra 0.3–7 keV background-subtracted count-rates, while the bottom panel shows relative count-rates and highlights the maximum change in brightness of each source. PSR J2032+4127 shows a monotonic increase in brightness, and its variability is significantly larger (relative increase by a factor of 33) compared to nearby X-ray sources. Cygnus OB2 4 and MT91 221, the two brightest sources other than PSR J2032+4127, vary by . While the two faint sources CXOU J203213.5+412711 and MT91 216 seem to vary by , this variability is possibly due to low counts and contamination by Cygnus OB2 4 in the case of CXOU J203213.5+412711. Our findings for Cygnus OB2 4, MT91 221, and CXOU J203213.5+412711 are consistent with those of Murakami et al. (2011), who examined variability between the 2002 and 2004 data.
To perform spectral analyses, we extract the source spectrum from circular apertures of radius ranging from 25 for on-axis observations to 95 for far off-axis ones. The background spectrum is obtained from nearby source-free regions. We did not extract a spectrum from the 2002 observation, since only four photons are detected at the pulsar position. We assume that the spectrum did not change during the four 2010 observations and combine these four to improve the signal-to-noise ratio. Spectral fits are performed using the Sherpa package in the 0.5–7 keV energy range. Spectra are binned such that there are at least ten counts per bin, and the statistic from Gehrels (1986) is used.
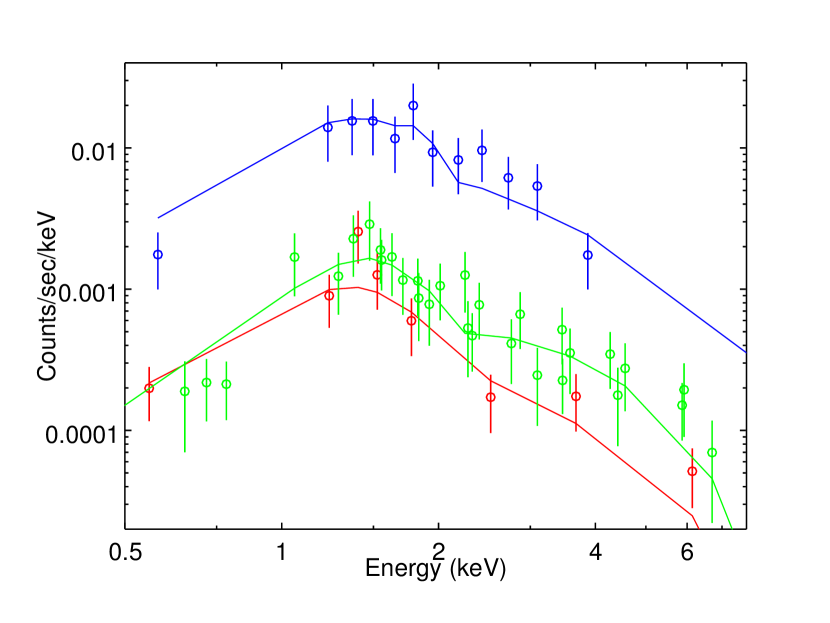
We fit either a power law model or an optically thin thermal plasma (APEC) model (see Section 5) and accounted for the interstellar absorption using the model tbabs with Wilms et al. (2000) abundances. We first fit all the spectra independently. We then fit all the spectra with a single absorption column density . Next we assume (based on the color excess of MT91 213; Camilo et al. 2009) and fit each spectrum independently and jointly (see Fig. 5 for results using the power law model). Parameters between different epochs are formally consistent, although fit parameters are not well constrained. Therefore we also fit spectra jointly with the same parameters but allow different normalization between observations. All results are listed in Table 4, with errors. Our results using a power law or APEC model for the 2004 data are consistent with those in Camilo et al. (2009), who find , , and erg cm-2 s-1. For the 2010 data, our results with the APEC model are comparable to those in Rauw et al. (2015), who find , , normalization , and erg cm-2 s-1. Incidentally, a thermal plasma model fit to the spectra of PSR B125963 near apastron gives (Hirayama et al., 1999). Finally we fit all observations with the same normalization, but this yielded poor results (). It is important to note that while the models we use generally yield good fits and parameters that are consistent within the large errors, the spectra are of relatively low quality, given the low number of counts ( counts in each observation) in the early epochs when PSR J2032+4127 is dim and the short exposure when PSR J2032+4127 is bright.
| Year | Normalization | ||||
| all parameters free and independent fit of all observations | |||||
| power law | |||||
| 2004 | 3.6/3 | ||||
| 2010 | 10.7/24 | ||||
| 2016 | 4.0/8 | ||||
| APEC | |||||
| 2004 | 4.6/3 | ||||
| 2010 | 10.9/24 | ||||
| 2016 | 3.5/8 | ||||
| tied and joint fit of observations | |||||
| power law | |||||
| 2004 | 20.0/37 | ||||
| 2010 | — | — | |||
| 2016 | — | — | |||
| APEC | |||||
| 2004 | 20.3/37 | ||||
| 2010 | — | — | |||
| 2016 | — | — | |||
| frozen and independent fit of all observations | |||||
| power law | |||||
| 2004 | 3.8/4 | ||||
| 2010 | — | 11.8/25 | |||
| 2016 | — | 4.7/9 | |||
| APEC | |||||
| 2004 | 4.5/4 | ||||
| 2010 | — | 12.4/25 | |||
| 2016 | — | 4.1/9 | |||
| and tied and joint fit of observations | |||||
| power law | |||||
| 2004 | 20.4/39 | ||||
| 2010 | — | — | — | ||
| 2016 | — | — | — | ||
| APEC | |||||
| 2004 | 20.6/39 | ||||
| 2010 | — | — | — | ||
| 2016 | — | — | — | ||
| frozen and tied and joint fit of observations | |||||
| power law | |||||
| 2004 | 21.1/40 | ||||
| 2010 | — | — | — | ||
| 2016 | — | — | — | ||
| APEC | |||||
| 2004 | 21.9/40 | ||||
| 2010 | — | — | — | ||
| 2016 | — | — | — | ||
3.2 Swift
To improve our understanding of the X-ray light curve of PSR J2032+4127, we checked archival data taken by Swift (Burrows et al., 2005) and obtained regular Swift monitoring. PSR J2032+4127 is serendipitously and intentionally inside the Swift field of view in many observations to date (see Table 2). These observations have exposure times ranging from 1 ks to 11 ks, and the source is detected in them. In each case, the 0.3–10 keV count-rate is determined using aperture photometry. A source region of radius 8 pixels centred on the position of PSR J2032+4127 is used and compared to a nearby background region of radius 63 pixels. Derived count-rates are listed in Table 2.
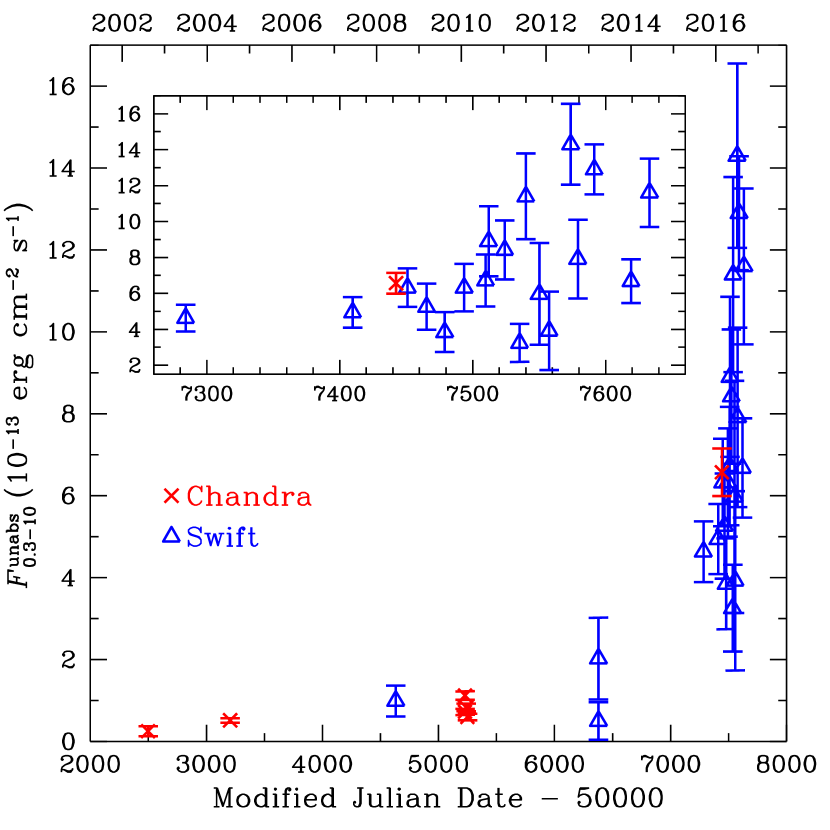
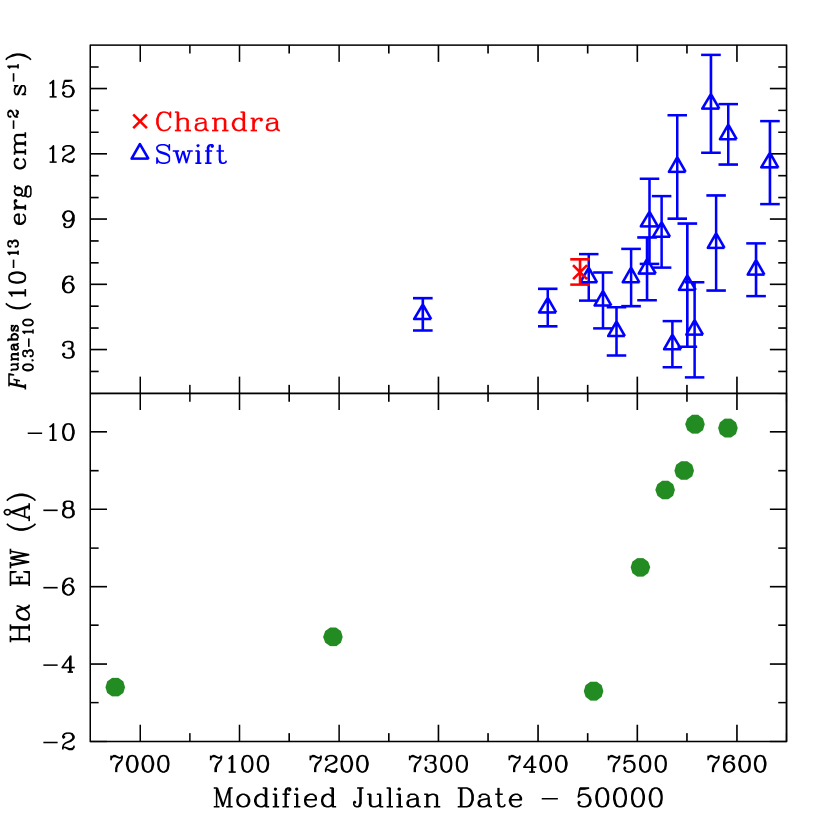
We use WebPIMMS to calculate the unabsorbed 0.3–10 keV flux for each Chandra and Swift count-rate, assuming and power law (see Table 4), since the total number of counts in each observation is usually . The resulting values are listed in Table 2 and shown in Fig. 6, and we see that the current X-ray flux is a factor of times higher than in 2002 and times higher than in 2010. Because of the spatial resolution of Swift, there are contributions to the Swift X-ray flux from the nearby sources shown in Fig. 3. However this contamination is only significant in the 2008 and possibly 2013 data. As we see from Fig. 4, the brightest sources in the field other than PSR J2032+4127 prior to 2015–2016 are Cygnus OB2 4 and MT91 221, and these likely contribute to at most of the Swift flux in the current epoch when PSR J2032+4127 has clearly brightened. We also checked that the recent flux decrease from mid to late May 2016 is not reflected in a bright nearby source during the same period.
4 H equivalent width and disc size
Optical spectra of MT91 213 were obtained on the MDM Observatory’s 2.4 m and 1.3 m telescopes, as well as the Liverpool 2 m telescope, with increased monitoring cadence in 2016. Figure 7 and Table 5 show the H emission line and EW measurements. The 2009 spectrum was published in Camilo et al. (2009). Here, we remeasured EW from all spectra, including the broad wings that become most apparent in 2016. Evidently the circumstellar disc was largest in 2009, as indicated by the stronger, single-peaked emission line. The double-peaked structure of more recent, weaker line profiles indicates a smaller disc, with peak separation corresponding to km s-1, where is velocity and is inclination angle. The He I is also double peaked in these spectra.

| Date | Telescope | Instrument | Resolution | H EW | |
|---|---|---|---|---|---|
| Å | Å | ||||
| 2009 Jun 13 | MDM 2.4 m | Modspec | 3.5 | 13.1 | |
| 2014 Nov 14 | MDM 2.4 m | Modspec | 3.5 | 5.5 | |
| 2015 Jun 21 | MDM 2.4 m | Modspec | 3.5 | 6.8 | |
| 2016 Mar 9 | MDM 1.3 m | Modspec | 3.5 | 5.4 | |
| 2016 Apr 25 | Liverpool 2 m | FRODOspec | 1.2 | 8.3 | |
| 2016 May 20 | Liverpool 2 m | FRODOspec | 1.2 | 9.9 | |
| 2016 Jun 8 | MDM 2.4 m | Modspec | 3.5 | 10 | |
| 2016 Jun 19 | Liverpool 2 m | FRODOspec | 1.2 | 11 | |
| 2016 Jul 22 | Liverpool 2 m | FRODOspec | 1.2 | 11 |
MT91 213 does not always have detectable emission lines. They were not reported in Massey & Thompson (1991), although that study did not cover the H region. Spectra at additional epochs were reported by Salas et al. (2013) under a different name (Cygnus OB2-4 B) for the star: In 2012 September it showed no emission lines, while in 2008 October and 2013 September–October, double-peaked H and H were present.
We estimate the size of the circumstellar disc around MT91 213 using the relation from Hanuschik (1989), which connects circumstellar disc radius and stellar radius to the H EW, i.e.
| (1) |
Our EW measurements of MT91 213 indicate that its circumstellar disc has varied in size by more than a factor of two, from to (see Table 5). For typical B0 V stars, (Vacca et al., 1996), which yields a range of from to . Approximately similar values of are obtained using the separation of the double peaks seen in spectra from 2014 to 2016. However for these later spectra, EW varies by a factor of about three (implying disc size change of about two), while peak separation does not change significantly. It is also noteworthy that broad wings appear in the H spectra, beginning in 2016 Apr 25, when EW increases (see Fig. 8, which shows X-ray and optical light curves since late 2014). These broad wings could be due to higher wind velocities, which could cause the observed increase in X-ray emission.
5 Discussion
In this work, we described recent multiwavelength observations of the high-energy binary system containing the 143 ms radio pulsar PSR J2032+4127 and the B0 Ve companion star MT91 213. The orbit is very eccentric () and large ( yr), and the pulsar is accelerating rapidly towards periastron passage in 2017 November. We updated orbital parameters of the system obtained via radio monitoring, combined with Fermi LAT observations, of the pulsar. Archival and recent Chandra and Swift observations show that the PSR J2032+4127/MT91 213 system has brightened significantly in X-rays, especially within the last year as it approaches periastron.
We can understand the current and past behavior of the PSR J2032+4127/MT91 213 system by comparing it to the high-energy binary pulsar system PSR B125963/LS 2883, since the two systems have many similarities. PSR B125963 is a 47.76 ms radio pulsar in an eccentric () 3.4 yr orbit with LS 2883, which is a 09.5 Ve star (Johnston et al., 1992; Negueruela et al., 2011). PSR B125963/LS 2883 has been observed across the electromagnetic spectrum during each periastron passage since its discovery (see, e.g. Chernyakova et al. 2015, for discussion of the most recent passage in 2014), as well as around apastron (see, e.g. Hirayama et al. 1999). The resulting studies show that its multiwavelength emission can be understood as shock interaction between the relativistic wind emitted by the pulsar and the circumstellar disc and wind of the companion star (Tavani & Arons, 1997). However, in attempting to extrapolate the observed behavior of PSR B125963 to that of PSR J2032+4127, it is important to note that the binary separation at apastron is AU in the case of PSR B125963, while PSR J2032+4127 has only been observed up to this point at a binary separation AU. At this large distance, the wind from MT91 213 is possibly tenuous, and its collision with the pulsar wind is possibly weak. Also LS 2883 is four times more luminous and a different stellar type (Negueruela et al., 2011), so its wind properties are likely different from that of MT91 213.
For Chandra observations taken in 2002, 2004, and around 2010, PSR J2032+4127 was quite distant from MT91 213, at a binary separation of AU (see Fig. 1). Thus the observed X-ray emission [with ] could be due to what is effectively an isolated Be star or an isolated young pulsar. In the former case, bright X-ray emission from powerful wind shocks of O stars is quite common, and spectra are often fit with an optically thin thermal plasma model (as performed in Section 3.1); the source of X-ray emission from stars of later stellar types is less certain, with a transition around early B stars, like MT91 213, that have (Berghöfer et al., 1997; Gagné et al., 2011; Nazé et al., 2014). Using the relation between X-ray and bolometric luminosities, , found for O and bright B stars (although there is large dispersion at the luminosity of stars similar to MT91 213; Rauw et al. 2015), we find , which matches the X-ray luminosity of MT91 213 in 2002.
For isolated pulsars, X-ray radiation can have non-thermal and thermal contributions. Non-thermal emission can be generated by a relativistic wind, which produces a ratio between X-ray luminosity to rotational energy loss of and a spectrum that is best-fit by a power-law with (Becker, 2009). For PSR J2032+4127, , and the measured power law is (Table 4). Thus a pulsar wind can easily be the source of observed X-rays. Meanwhile, thermal emission for intermediate age ( yr) neutron stars gives (see, e.g. Potekhin et al. 2015).
The more recent observations since late 2015 show significant brightening in X-rays (see Fig. 6), with . Although these luminosities are somewhat lower than the X-ray luminosity seen for PSR B125963 at apastron (; Hirayama et al. 1999; Uchiyama et al. 2009), the brightening of PSR J2032+4127 suggests that the pulsar has entered the regime where the pulsar wind is interacting strongly with the Be star wind. X-ray spectral studies of PSR B125963 find that most observations made by Chandra, Suzaku, Swift, and XMM-Newton can be fit with a power law model (see, e.g. Tavani & Arons 1997; Chernyakova et al. 2009, 2014). Chernyakova et al. (2006, 2009) and Uchiyama et al. (2009) show that the value of varies with orbital phase and that changes from 1.8 around apastron to 1.2 right before the pulsar enters the circumstellar disc of LS 2883 at periastron, a decline that is similar to what is found from our limited spectra of PSR J2032+4127 (see Table 4).
The PSR J2032+4127/MT91 213 system will continue to be monitored across the electromagnetic spectrum as the pulsar approaches periastron. When it is near periastron, the system may brighten even more if the pulsar accretes from the circumstellar disc of the Be star. PSR J2032+4127/MT91 213 will thus serve as an invaluable tool for comparing and contrasting to the very well-studied and previously unique gamma-ray binary PSR B125963/LS 2883.
Acknowledgements
The authors are indebted to Paul Ray for his support and careful reading of the manuscript. The authors thank Maria Chernyakova for helpful comments and Belinda Wilkes and the Chandra team for conducting the 2016 DDT observation. WCGH acknowledges support from the United Kingdom Science and Technology Facilities Council (UK STFC). Pulsar research at Jodrell Bank Centre for Astrophysics is supported by a Consolidated Grant from UK STFC. The Fermi LAT Collaboration acknowledges generous ongoing support from a number of agencies and institutes that supported both development and operation of the LAT as well as scientific data analysis. These include the National Aeronautics and Space Administration and Department of Energy in the United States, Commissariat à l’Energie Atomique and Centre National de la Recherche Scientifique/Institut National de Physique Nucléaire et de Physique des Particules in France, Agenzia Spaziale Italiana and Istituto Nazionale di Fisica Nucleare in Italy, Ministry of Education, Culture, Sports, Science and Technology (MEXT), High Energy Accelerator Research Organization (KEK), and Japan Aerospace Exploration Agency (JAXA) in Japan, and K. A. Wallenberg Foundation, Swedish Research Council, and Swedish National Space Board in Sweden. Additional support for science analysis during the operations phase is gratefully acknowledged from the Istituto Nazionale di Astrofisica in Italy and Centre National d’Études Spatiales in France. The Liverpool Telescope is operated on the island of La Palma by Liverpool John Moores University in the Spanish Observatorio del Roque de los Muchachos of the Instituto de Astrofisica de Canarias with financial support from UK STFC.
References
- Abdo et al. (2009) Abdo A. A., et al., 2009, Science, 325, 840
- Abdo et al. (2013) Abdo A. A., et al., 2013, ApJS, 208, 17
- Acero et al. (2015) Acero F., et al., 2015, ApJS, 218, 23
- Acero et al. (2016) Acero F., et al., 2016, ApJS, 223, 26
- Becker (2009) Becker W., 2009, in Becker W., ed., Ap&SSL 357, Neutron Stars and Pulsars. Springer-Verlag, Berlin, p. 91
- Berghöfer et al. (1997) Berghöfer T. W., Schmitt J. H. M. M., Danner R., Cassinelli J. P., 1997, A&A, 322, 167
- Burrows et al. (2005) Burrows D. N., et al., 2005, Sp. Sci. Rev., 120, 165
- Camilo et al. (2009) Camilo F., et al., 2009, ApJ, 705, 1
- Chernyakova et al. (2006) Chernyakova M., Neronov A., Lutovinov, A., Rodriguez, J., Johnston, S., 2006, MNRAS, 367, 1201
- Chernyakova et al. (2009) Chernyakova M., Neronov A., Aharonian F., Uchiyama Y., Takahashi T., 2009, MNRAS, 397, 2123
- Chernyakova et al. (2014) Chernyakova M., et al., 2014, MNRAS, 439, 432
- Chernyakova et al. (2015) Chernyakova M., et al., 2015, MNRAS, 454, 1358
- Dubus (2013) Dubus G., 2013, A&A Rev., 21, 64
- Gagné et al. (2011) Gagné M., et al., 2011, ApJS, 194, 5
- Gehrels (1986) Gehrels N., 1986, ApJ, 303, 336
- Hanuschik (1989) Hanuschik R. W., 1989, Ap&SS, 161, 61
- Hirayama et al. (1999) Hirayama M., Cominsky L. R., Kaspi V. M., Nagase F., Tavani M., Kawai N., Grove J. E., 1999, ApJ, 521, 718
- Hobbs et al. (2006) Hobbs G. B., Edwards R. T., Manchester R. N. 2006, MNRAS, 369, 655
- Hohle et al. (2010) Hohle M. M., Neuhäuser R., Schutz B. F., 2010, Astron. Nachr., 331, 349
- Johnston et al. (1992) Johnston S., Manchester R. N., Lyne A. G., Bailes M., Kaspi V. M., Qiao G., D’Amico N., 1992, ApJ, 387, L37
- Kerr (2011) Kerr M., 2011, ApJ, 732, 38
- Kiminki et al. (2007) Kiminki D. C., et al., 2007, ApJ, 664, 1102
- Kiminki et al. (2015) Kiminki D. C., Kobulnicky H. A., Vargas Álvarez C. A., Alexander M. J., Lundquist M. J., 2015, ApJ, 811, 85
- Klus et al. (2014) Klus H., Ho W. C. G., Coe M. J., Corbet R. H. D., Townsend L. J., 2014, MNRAS, 437, 3863
- Lyne et al. (2015) Lyne A. G., Stappers B. W., Keith M. J., Ray P. S., Kerr M., Camilo F., Johnson T. J., 2015, MNRAS, 451, 581
- Massey & Thompson (1991) Massey P., Thompson A. B., 1991, AJ, 101, 1408
- Murakami et al. (2011) Murakami H., Kitamoto S., Kawachi A., Nakamori T., 2011, PASJ, 63, S873
- Nazé et al. (2014) Nazé Y., Petit V., Rinbrand M., Cohen D., Owocki S., Ud-Doula A., Wade G. A., 2014, ApJS, 215, 10
- Negueruela et al. (2011) Negueruela I., Ribó M., Herrero A., Lorenzo J., Khangulyan D., Aharonian, F. A., 2011, ApJ, 732, L11
- Page et al. (2006) Page D., Geppert U., Weber F., 2006, Nucl. Phys. A, 777, 497
- Potekhin et al. (2015) Potekhin A. Y., Pons J. A., Page D., 2015, Space Sci. Rev., 191, 239
- Rauw et al. (2015) Rauw G., et al., 2015, ApJS, 221, 1
- Ray et al. (2011) Ray P. S., et al., 2011, ApJS, 194, 17
- Reig (2011) Reig P., 2011, Ap&SS, 332, 1
- Reig et al. (2016) Reig P., Nersesian A., Zezas A., Gkouvelis L., Coe M. J., 2016, A&A, 590, 122
- Salas et al. (2013) Salas J., Maiz Apellaniz J., Gamen R. C., Barba R. H., Sota A., Sanchez-Bermudez J., Alfaro E. J., 2013, ATel 5571
- Tavani & Arons (1997) Tavani M., Arons J., 1997, ApJ, 477, 439
- Uchiyama et al. (2009) Uchiyama Y., Tanaka T., Takahashi T., Mori K., Nakazawa K., 2009, ApJ, 698, 911
- Vacca et al. (1996) Vacca W. D., Garmany C. D., Shull J. M., 1996, ApJ, 460, 914
- Walborn (1973) Walborn N. R., 1973, ApJ, 180, L35
- Wilms et al. (2000) Wilms J., Allen A., McCray R., 2000, ApJ, 542, 914
- Wright et al. (2015) Wright N. J., Drew J. E., Mohr-Smith M., 2015, MNRAS, 449, 741
- Yakovlev & Pethick (2004) Yakovlev D. G., Pethick C. J. 2004, ARA&A, 42, 169