Testing a Dynamical Equilibrium Model of the Extraplanar Diffuse Ionized Gas in NGC 891
Abstract
The observed scale heights of extraplanar diffuse ionized gas (eDIG) layers exceed their thermal scale heights by a factor of a few in the Milky Way and other nearby edge-on disk galaxies. Here, we test a dynamical equilibrium model of the extraplanar diffuse ionized gas layer in NGC 891, where we ask whether the thermal, turbulent, magnetic field, and cosmic ray pressure gradients are sufficient to support the layer. In optical emission line spectroscopy from the SparsePak integral field unit on the WIYN 3.5-meter telescope, the H emission in position-velocity space suggests that the eDIG is found in a ring between galactocentric radii of kpc, where kpc. We find that the thermal ( km s-1) and turbulent ( km s-1) velocity dispersions are insufficient to satisfy the hydrostatic equilibrium equation given an exponential electron scale height of kpc. Using a literature analysis of radio continuum observations from the CHANG-ES survey, we demonstrate that the magnetic field and cosmic ray pressure gradients are sufficient to stably support the gas at kpc if the cosmic rays are sufficiently coupled to the system (). Thus, a stable dynamical equilibrium model is viable only if the extraplanar diffuse ionized gas is found in a thin ring around kpc, and non-equilibrium models such as a galactic fountain flow are of interest for further study.
Subject headings:
cosmic rays — galaxies: individual(NGC 891) — galaxies: ISM — ISM: kinematics and dynamics — ISM: magnetic fields1. Introduction
Multi-wavelength observations of nearby edge-on disk galaxies have revealed multi-phase gaseous halos that include molecular, neutral, and warm and hot ionized phases. The extraplanar diffuse ionized gas (eDIG) layers in the Milky Way and other nearby edge-on disk galaxies are remarkable in that their observed scale heights generally exceed their thermal scale heights by a factor of a few (e.g., Rand, 1997; Haffner et al., 1999; Collins & Rand, 2001; Gaensler et al., 2008; Voigtländer et al., 2013). These warm ( K), diffuse ( cm-3) layers have a range of diffuse, clumpy, and filamentary morphologies, a photoionization power requirement that is satisfied by the O and B stars in the disk, and rotational velocity profiles that suggest a probable disk origin (Lehnert & Heckman, 1995, 1996; Rossa & Dettmar, 2000; Tüllmann & Dettmar, 2000; Miller & Veilleux, 2003a, b; Rossa & Dettmar, 2003a, b; Heald et al., 2006a, b, 2007). Additionally, the detection of eDIG layers is positively correlated with the star formation rate per unit area for starburst, star-forming, and quiescent galaxies (Rossa & Dettmar, 2003a). It is also spatially correlated with soft X-ray emission from hot halo gas (Strickland et al., 2004; Tüllmann et al., 2006a, b), as well as with radio continuum emission associated with extraplanar magnetic fields and cosmic rays (Dahlem et al., 1994; Collins et al., 2000; Tüllmann & Dettmar, 2000; Li et al., 2016).
The observation that eDIG layers are associated with a minimum star formation rate per unit area is consistent with models of a star-formation driven disk-halo flow. “Superbubble” (Mac Low & McCray, 1988), “galactic chimney” (Norman & Ikeuchi, 1989), “galactic fountain” (Shapiro & Field, 1976), and galactic wind (e.g., Veilleux et al., 2005) models all describe the local or global circulation of gas between the disk and the halo due to star formation activity in OB associations. There is observational evidence of bubbles, arcs, and filaments in the halo that are spatially associated with HII regions as well as ultraviolet continuum from young, hot stellar populations in the disk (Dettmar, 1990; Rand et al., 1990; Rand, 1996; Howk & Savage, 1997, 1999, 2000; Rossa & Dettmar, 2000, 2003b; Tüllmann et al., 2006a). Thus, a general framework has emerged in which eDIG layers are found in multi-phase gaseous, magnetic field, and cosmic ray halos in galaxies with sufficient star formation rates per unit area.
Within this framework, the vertical structure, support, and dynamical state of these layers are not yet fully understood. A range of dynamical models exist to explain the column densities, scale heights, and three-dimensional kinematics of the extraplanar interstellar medium (ISM). One class of models treats extraplanar gas layers as fluid disks that satisfy the hydrostatic equilibrium equation (Boulares & Cox, 1990; Barnabè et al., 2006; Henriksen & Irwin, 2016), while another treats the layers as collections of clouds that travel ballistically through the galactic gravitational potential (Collins et al., 2002; Fraternali & Binney, 2006). Some authors suggest that a combination of hydrodynamic and ballistic effects may be closest to reality (e.g., Benjamin, 2000), while others seek to understand the effects of magnetohydrodynamics on the disk-halo interface in a turbulent, star-forming ISM (Hill et al., 2012). Discriminating between dynamical models for each phase of the extraplanar ISM is important for undestanding how each phase is formed, evolves, and participates in the transfer of mass and energy between the disk, halo, and intergalactic environment.
Here, we study the dynamical state of the eDIG layer in the nearby edge-on disk galaxy NGC 891. This galaxy is an ideal candidate for this study due to its proximity ( Mpc; pc; Ciardullo et al. 1991), inclination angle (; Oosterloo et al. 2007), and well-studied multi-phase gaseous halo. It is classified as an Sb galaxy in the Third Reference Catalogue of Bright Galaxies (de Vaucouleurs et al., 1991), but there is evidence at multiple wavelengths for a bar (e.g., Sofue & Nakai, 1993; Garcia-Burillo & Guelin, 1995; Schechtman-Rook & Bershady, 2013). Due to similarities in mass, morphology, and bolometric luminosity, NGC 891 is often considered a Milky Way analog (van der Kruit, 1984); however, the far-infrared star formation rate is somewhat higher in the former at yr-1 (Popescu et al., 2004). There is evidence in the HII region number density as well as the far-infrared and radio emission morphology that the star formation rate is highest in the northeast side of the disk (e.g., Wainscoat et al., 1987; Dettmar, 1990). There is not evidence of a major disturbance of the stellar disk in deep optical and near-infrared photometry (Morrison et al., 1997; Schechtman-Rook & Bershady, 2013). However, Mapelli et al. (2008) show that the slight lopsidedness of the disk suggests a mild flyby interaction with the companion UGC 1807. Oosterloo et al. (2007) demonstrate that HI clouds with counter-rotating velocities and an HI filament near systemic velocity reaching over 20 kpc from the disk in projection towards the companion are evidence of interaction and/or accretion. This system also includes extraplanar dust (Howk & Savage, 1997, 2000; Seon et al., 2014), diffuse ionized gas (Dettmar, 1990; Rand et al., 1990; Rand, 1997), and hot ionized gas (Hodges-Kluck & Bregman, 2013), as well as extraplanar magnetic fields and cosmic rays (Dahlem et al., 1994).
The eDIG in NGC 891 is among the brightest, most spatially extended, and most well-studied eDIG layers known. Discovered in H narrowband imaging by Dettmar (1990) and Rand, Kulkarni, & Hester (1990), the brightest and most vertically extended eDIG is found on the northeast side of the galaxy, where it appears to be spatially associated with the elevated star formation rate (Dettmar, 1990; Hoopes et al., 1999). The morphology of the layer has both smooth and filamentary components; Rossa et al. (2004) obtained high spectal resolution ( pc) H narrowband imaging with the WFPC2 camera on the Hubble Space Telescope that revealed a diffuse background intersected by filaments, arcs, plumes, bubbles, and supershells. Notably, Howk & Savage (2000) and Rossa et al. (2004) detect arcs and filaments that have dimensions of tens of pc wide and several kpc long, are highly collimated to large heights above the disk, and appear to have one or both ends in star-forming regions. Qualitatively, these observations suggest that star formation activity drives the warm ionized gas out of the disk by way of galactic chimneys formed from the bursting of superbubbles associated with spatially correlated supernovae (Shapiro & Field, 1976; Norman & Ikeuchi, 1989).
The photoionization energy requirement of the eDIG layer is met by massive stars in the disk if the ISM is sufficiently porous to UV photons (e.g., Dettmar, 1990). The emission line spectrum is broadly consistent with a photoionized gas in the near-ultraviolet (Otte et al., 2001, 2002), optical (e.g., Rand, 1997, 1998), and infrared (Rand et al., 2008, 2011). However, in NGC 891, the Milky Way, and other galaxies, the emission line ratios as a function of height above the disk requires a supplemental source of heating and/or ionization; such sources may include shocks (Rand, 1998), turbulent mixing layers (Rand, 1998; Binette et al., 2009), hot low-mass evolved stars (Sokolowski & Bland-Hawthorn, 1991; Flores-Fajardo et al., 2011), and/or cosmic rays (Wiener et al., 2013).
A remarkable feature of the eDIG layer in NGC 891 is its considerable spatial extent above and below the midplane. The vertical electron density distribution is well-described by an exponential of the form , where is the mean electron number density in the disk and is the electron scale height. The eDIG layer in NGC 891 is well-fit by a scale height of kpc on the Northeast side of the disk (Dettmar, 1990; Rand et al., 1990; Dettmar et al., 1991; Keppel et al., 1991). An improved fit is found if the electron density distribution is expressed as the sum of a thick disk component with kpc and a halo component with a few kpc (Rand, 1997; Hoopes et al., 1999). The thick disk and halo components may be produced by different processes; for example, the former may be rising out of the disk via galactic chimneys and supershells, while the latter may be condensing onto the disk out of a hot halo phase (Rand, 1997). Changing emission line ratios with distance from the midplane suggest that the large scale height is due to true extraplanar emission and not to HII region emission scattered by dust. Additionally, Ferrara et al. (1996) use Monte Carlo radiative transfer simulations of H photon propagation through the dusty disk of NGC 891 to argue that scattered HII region emission is only 10% of eDIG emission at pc.
Here, we test a dynamical equilibrium model of the eDIG layer in NGC 891. Although the observed scale height, lack of flaring, and general inhomogeneity of the layer suggest a system out of dynamical equilibrium (e.g., Dettmar, 1990), the various sources of vertical support have yet to be fully quantified for any eDIG layer. Thus, we use optical emission line spectroscopy from the SparsePak integral field unit (IFU; Bershady et al. 2004, 2005) on the WIYN 3.5-meter telescope at Kitt Peak National Observatory, as well as radio continuum observations from the CHANG-ES survey from Schmidt (2016, in preparation), to determine the thermal, turbulent, magnetic field, and cosmic ray pressure gradients in the eDIG layer. By comparing the observed and required pressure gradients to support the eDIG layer at its observed scale height, we consider whether the system is best characterized by equilibrium or non-equilibrium (i.e., galactic fountain, galactic wind) models.
The paper is laid out as follows. In §2, we create a mass model to determine the galactic gravitational potential of NGC 891. We give a statement of the problem and the model to be tested in §3, and we discuss the collection and reduction of optical emission line spectroscopy using the SparsePak IFU in §4. In §5.1, we construct a model of the three-dimensional density distribution of the eDIG layer, and we constrain the velocity dispersion along the minor axis from the H, [NII] 6583, and [SII] 6716, 6731 emission line widths in §5.2. In §5.3, we determine the vertical magnetic field and cosmic ray pressure gradients in this system using radio continuum observations from the CHANG-ES survey analyzed by Schmidt (2016, in preparation), and in §5.4 we assess whether a magnetized eDIG layer in dynamical equilibrium is stable against the Parker instability. We discuss our results in the context of multi-wavelength observations and our knowledge of the Milky Way Galaxy in §6. In §7, we conclude that a dynamical equilibrium model dominated by a magnetic pressure gradient is viable for the eDIG layer in NGC 891 only over a limited range of galactocentric radii ( kpc). We include an Appendix to illustrate the robustness of this result against variations in the assumed mass-to-light ratio of the stellar disk.
2. A Mass Model for NGC 891
To create a mass model of NGC 891, we use the HI rotation curve of Fraternali et al. (2011), as well as the careful photometric deconstruction of the disk by Schechtman-Rook & Bershady (2014) (see also Popescu et al. 2000, 2004). Schechtman-Rook & Bershady (2014) use sub-arcsecond spatial resolution imaging of NGC 891 in the near-infrared, as well as radiative transfer modeling to perform a dust attenuation correction, to decompose the stellar disk into five exponential disk components: a super-thin, thin, and thick disk (truncated within kpc), as well as a central disk and a bar (truncated outside kpc). A super-thin disk of stars and dust was also found for this galaxy by Popescu et al. (2004).
For the sake of computational simplicity, we reduce the five-component model of Schechtman-Rook & Bershady (2014) to a two-component, untruncated disk and bulge/lens model of the form
| (1) |
where is the baryonic mass density, is the central mass density, is the radial scale length, and is the vertical scale height of the disk (D) and bulge (B). This is done by fitting the attenuation-corrected, -band luminosity surface density of their model as functions of and to determine the radial scale lengths, vertical scale heights, and central luminosity densities of the disk and bulge. We then assign a -band mass-to-light ratio to determine the central baryonic mass densities of each component. For the main mass model discussed in this paper (the “primary model”), we choose a -band mass-to-light ratio of , and we consider variations in in the Appendix (McGaugh & Schombert, 2014).
To determine the parameters of the dark matter halo, we fit the HI rotation curve of Fraternali et al. (2011) using a reduced minimization. We assume an NFW profile of the form
| (2) |
where is the central dark matter density and is the scale radius. Note that while gas is not explicitly included in our mass model, this is a effect on the velocity dispersion required to support the gas at a given scale height. See Table 1 for the parameters of our mass model.
| Parameter | Value | Reference |
|---|---|---|
| 4.1 kpc | 1 | |
| 0.4 kpc | 1 | |
| kpc-3 | 1 | |
| 0.3 kpc | 1 | |
| 0.1 kpc | 1 | |
| kpc-3 | 1 | |
| 2.9 kpc | 2 | |
| kpc-3 | 2 |
Note. — The radial scale lengths, , the vertical scale heights, , and the central mass densities, , determined for an exponential disk (D) and bulge (B) model of NGC 891. The results are derived from the near-infrared photometry of Schechtman-Rook & Bershady (2014) assuming a -band mass-to-light ratio of . We also list the scale radius, , and the central density, , of the dark matter halo required to reproduce the HI rotation curve of Fraternali et al. (2011) assuming an NFW profile.
References. — [1] Schechtman-Rook & Bershady (2014); [2] This work
We adopt the approach of Cuddeford (1993) to calculate the gravitational potential of the exponential disk and bulge components as follows:
| (3) |
where is the central mass surface density, is the zeroth order modified Bessel function, and . The potential of the dark matter halo is given by:
| (4) |
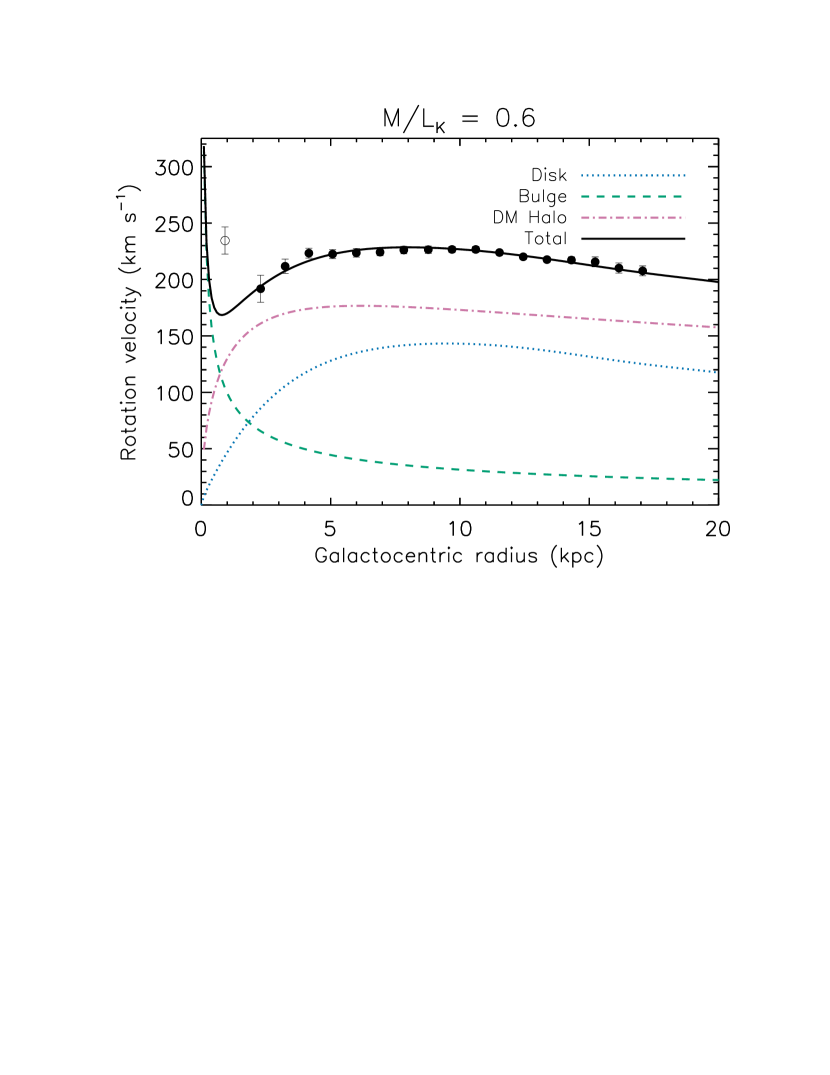
From the gravitational potential of the disk, bulge, and dark matter halo, we determine the circular velocity due to each component, and add these in quadrature to reproduce the HI rotation curve shown in Figure 1.
Our mass model differs from that of Fraternali & Binney (2006), most noteably in that the scale height of our disk ( kpc) is only of theirs ( kpc). As the gravitational potential within a few kpc of the disk is particularly important for the dynamical equilibrium of the eDIG layer, we use the new near-infrared imaging and radiative transfer modeling of Schechtman-Rook & Bershady (2014) to find a more conservative value of .
3. The Scale Height Problem
Throughout this study, we assume that the eDIG layer is in pressure balance, and we solve the hydrostatic equilibrium equation given by
| (5) |
where and are the height and radial cyclindrical coordinates, respectively. Here, is the gas density, is the galactic gravitational potential, and is the gravitational acceleration in the direction. The total pressure is the sum of the gas pressure, magnetic field pressure, and cosmic ray pressure:
| (6) |
The magnetic field pressure is assumed to be isotropic. We use an equation of state of the form
| (7) |
where is the quadrature sum of the one-dimensional thermal and turbulent velocity disperisons. Note that here and throughout the rest of the paper, the velocity dispersion refers to the standard deviation, and not the full width at half maximum (FWHM), of a Gaussian velocity distribution. We also use “turbulence” to refer simply to random gas motions without assuming that they meet the strict definition of turbulence.
Given a mass model of NGC 891, we solve Equation (5) to determine the vertical scale height, , of an isothermal gas with an equation of state given by Equation (7). The general solution is:
| (8) |
Assuming that is independent of (see §5.2), the simplified solution is:
| (9) |
We define the scale height, , as the distance from the midplane at which the gas density has dropped by a factor of :
| (10) |
Note that this calculation temporarily neglects any magnetic field and cosmic ray pressure.
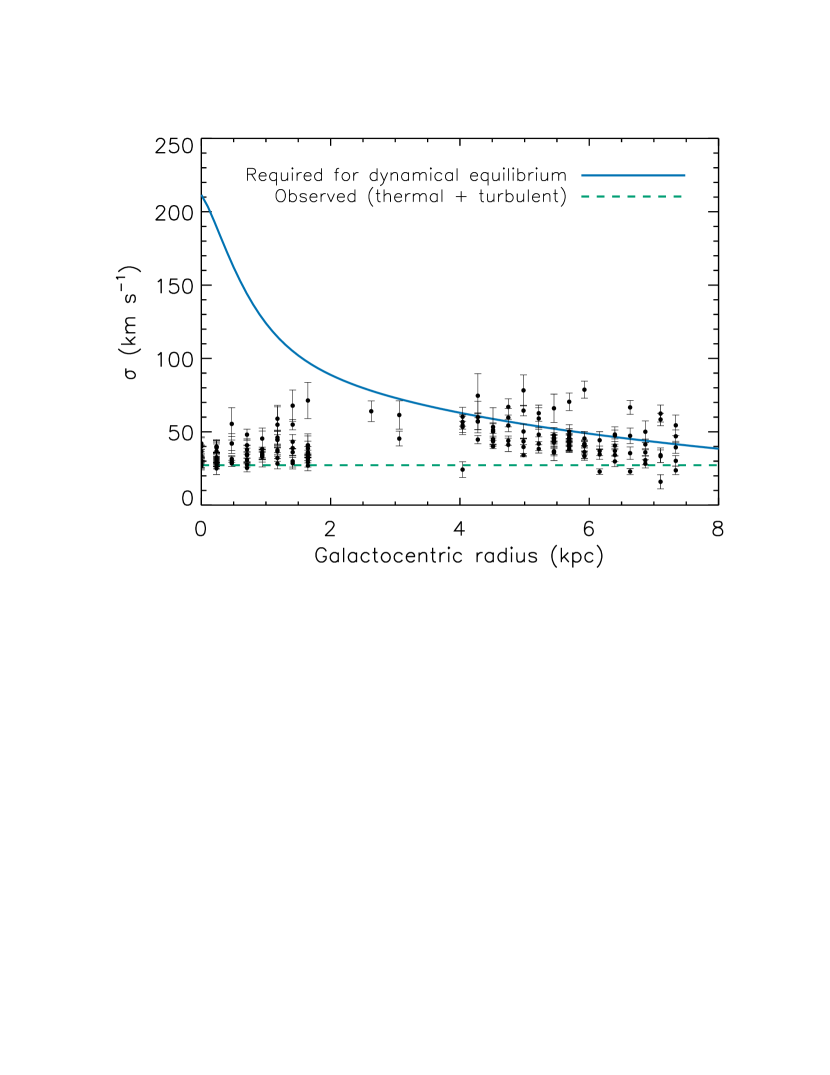
We can ask what the scale height of an isothermal gas layer is for a given velocity dispersion as a function of galactocentric radius. First, we concern ourselves only with the thermal velocity dispersion, , where is the Boltzmann constant, is the gas temperature, is the mass of a proton, and is a scaling factor based on the composition and the ionization state. For a diffuse ionized gas with K and , we find km s-1 (this assumes a gas that is 9% He by number, with 90% and 70% of the H and He ionized, respectively; Rand 1997, 1998).
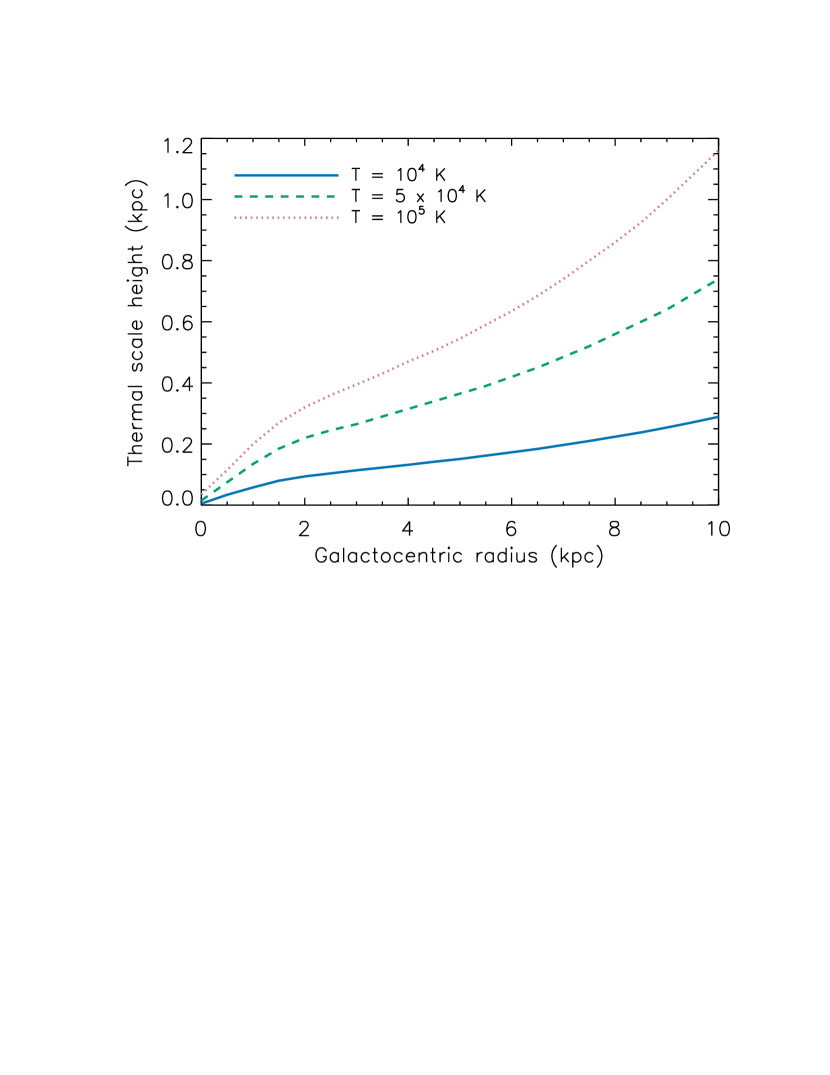
In Figure 2a, we show the thermal scale height of an isothermal gas layer for a range of temperatures as a function of galactocentric radius. Two characteristics of a thermally-supported gas layer are immediately apparent. First, the layer is highly flared. Second, the layer has a scale height of only a few hundred parsecs within kpc when K, a factor of a few smaller than the kpc observed for the eDIG layer in this galaxy (e.g., Rand, 1997). In fact, the scale height only reaches kpc if K, an order of magnitude higher than the temperature of the eDIG layer in this system.
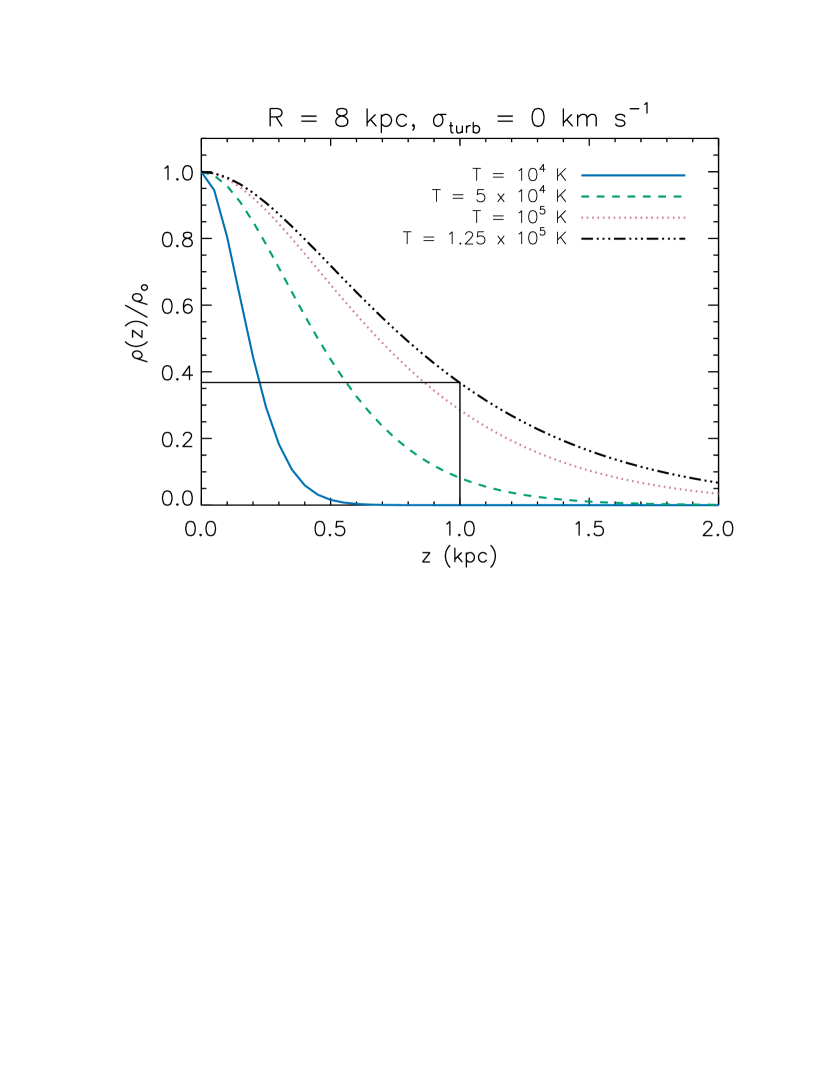
This is further illustrated in Figure 2b, where the density distribution of the isothermal gas is shown as a function of height above the disk for a range of temperatures at a radius of kpc. A radius of kpc is chosen because this is approximately the location of the observed cutoff in H intensity, and thus is the shallowest location in the gravitational potential where significant H emission is observed (see, e.g., Figure 2 of Dettmar 1990). A scale height of kpc is achieved only for a temperature of K; thus, it is clear that the eDIG layer in NGC 891 is not thermally supported, and requires supplemental sources of pressure support if it is in dynamical equilibrium.
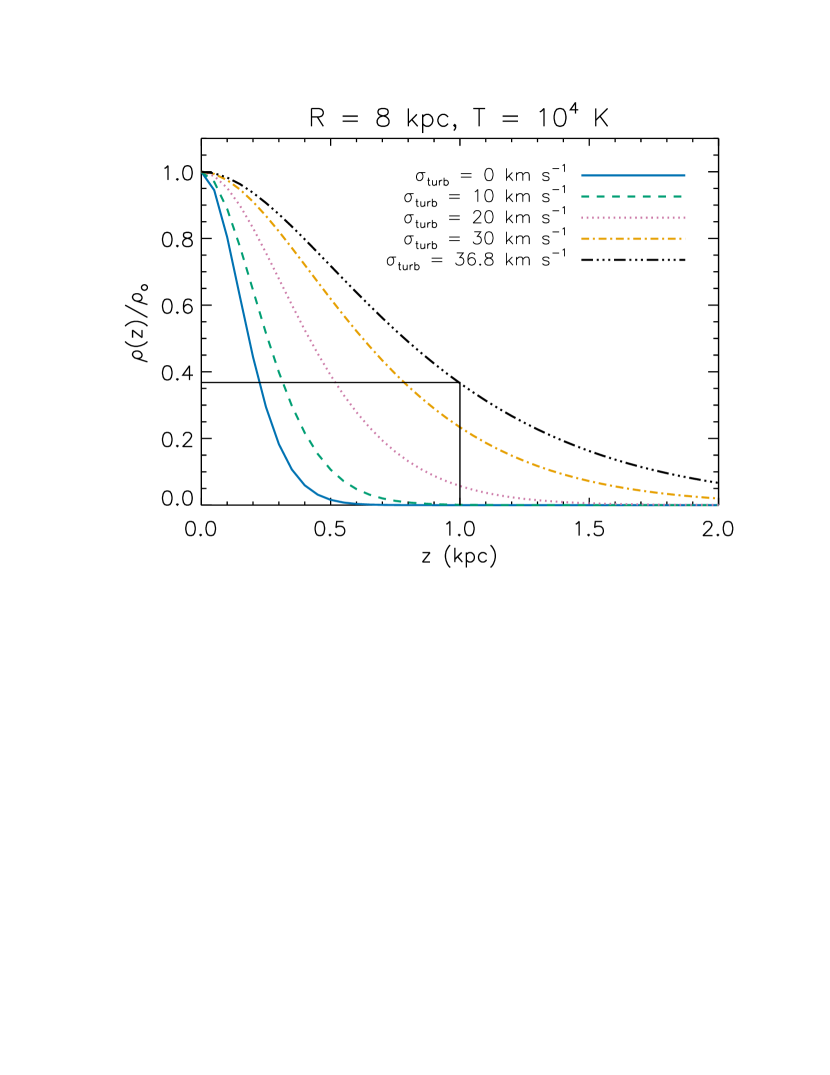
We consider one source of additional pressure support in Figure 2c, where we now define the velocity dispersion of an isothermal gas as . Here, for a temperature of K, we consider the density distribution of an isothermal gas with a range of turbulent velocity dispersions as a function of height above the disk at kpc. We see that a scale height of kpc is achieved only for a turbulent velocity dispersion of km s-1, or turbulence with a sonic Mach number of 3 to 4 in a K gas. Thus, observationally constraining the velocity dispersion in the eDIG layer of NGC 891 is a major goal of this work.
| Pointing | R.A. aaR.A. is measured in hours, minutes, and seconds; Decl. is measured in degrees, arcminutes, and arcseconds. The given R.A. and Decl. are for the central fiber in the near-integral core (fiber 52). | Decl. aaR.A. is measured in hours, minutes, and seconds; Decl. is measured in degrees, arcminutes, and arcseconds. The given R.A. and Decl. are for the central fiber in the near-integral core (fiber 52). | Exposure Time bbTotal exposure time of a stack of four 1500 s or 2000 s exposures. | rms Continuum Noise ccMedian rms noise measured in the continuum between [NII] 6583 and [SII] 6716. | Array P.A. | ddRange of projected radii and heights above the disk spanned by the fiber array (non-sky fibers only). A positive is on the approaching (north) side of the disk; a positive is on the west side of the disk. Assumes a distance of Mpc. | ddRange of projected radii and heights above the disk spanned by the fiber array (non-sky fibers only). A positive is on the approaching (north) side of the disk; a positive is on the west side of the disk. Assumes a distance of Mpc. |
|---|---|---|---|---|---|---|---|
| Label | (J2000) | (J2000) | (hr) | ( erg s-1 cm-2 Å-1) | (deg) | (kpc) | (kpc) |
| p1 | 02 22 36.2 | +42 20 44 | 1.67 | 1.8 | +112 | -1.65 - 1.65 | -3.2 - 0 |
| p2 | 02 22 30.6 | +42 21 10 | 2.22 | 1.6 | -68 | -1.65 - 1.65 | 0 - 3.2 |
| p3 | 02 22 34.8 | +42 23 00 | 2.22 | 1.5 | -68 | 4.05 - 7.35 | 0 - 3.2 |
| p4 | 02 22 40.5 | +42 22 35 | 2.22 | 1.4 | +112 | 4.05 - 7.35 | -3.2 - 0 |
4. Observations
4.1. Data Collection
Optical emission line spectroscopy of the eDIG layer in NGC 891 was obtained on the WIYN666The WIYN Observatory is a joint facility of the University of Wisconsin-Madison, Indiana University, the National Optical Astronomy Observatory, and the University of Missouri. 3.5-meter telescope at KPNO on 2014 November 15 - 17. The SparsePak IFU (Bershady et al., 2004, 2005) was used in conjunction with the STA1 CCD detector and the Bench Spectrograph Camera. SparsePak is a fiber array consisting of 82 fibers; the array sparsely samples the field around a nearly integral core. The 500 m fibers span on the sky, or pc at the distance of NGC 891. The 316@63.4 echelle grating was used at order 8 (grating angle = 62.840∘); this produces wavelength coverage from Å 6805 Å with a dispersion of Å/pixel. The spectral resolution is , or Å ( km s-1) at H. The wavelength coverage includes the [NII] 6548, 6583, H, and [SII] 6716, 6731 emission lines.
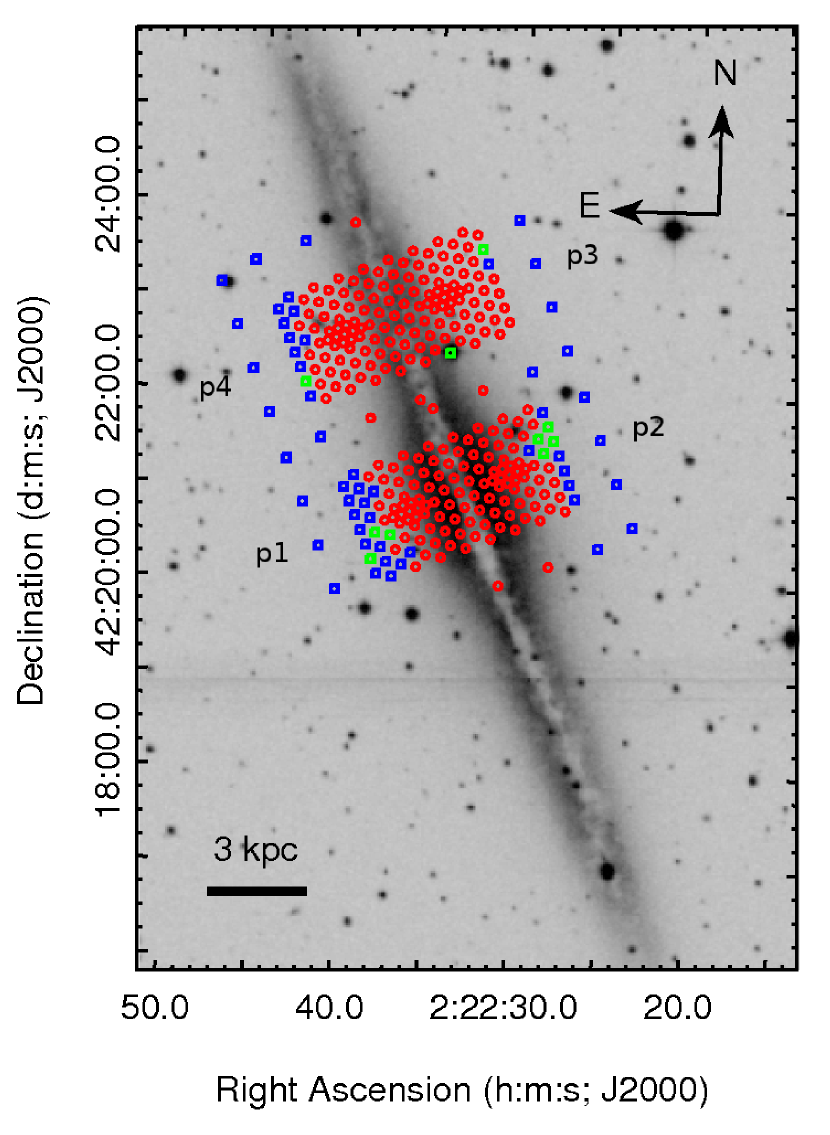
We obtained observations of NGC 891 at four SparsePak pointings. Two pointings sample the extraplanar gas above and below the disk along the minor axis, and the other two pointings are shifted along the major axis to a projected radius of kpc on the Northeast side of the galaxy. These pointings are shown projected onto an image of NGC 891 from the Digitized Sky Survey (Second Generation) in Figure 3. In Table 2, the pointing centers, exposure times, continuum noise, position angles, and ranges sampled in and are given (throughout this paper, will be used to refer to projected radius, and to galactocentric radius).
4.2. Data Reduction
The data were reduced using standard procedures in IRAF777IRAF is distributed by the National Optical Astronomy Observatories, which are operated by the Association of Universities for Research in Astronomy, Inc., under cooperative agreement with the National Science Foundation.. The images were overscan, bias, and dark corrected using the ccdproc task. Image stacking was performed using the imcombine task; images of the same pointing were median combined on a given night, and then across nights, when necessary. Cosmic ray removal was accomplished through image stacking where possible, and through the package L.A.Cosmic on individual images where necessary (van Dokkum, 2001). dohydra was used to trace and extract the spectra, as well perform the flat field correction and find the dispersion solution. Observations of a ThAr comparison lamp were used to solve for the dispersion solution as well as the spectral resolution; these observations were obtained before and after each set of object exposures.
Sky subtraction was performed using a median stacking of the sky spectra in each pointing in which no eDIG emission was detected. In deeper spectra, Heald et al. (2006a) detect eDIG emission at the location of our sky spectra, and we therefore compared our stacked sky spectra to that of Osterbrock et al. (1996) to look for such contamination. The sky spectra for p1, p2, and p4 (see Table 2) showed no evidence of eDIG emission, but the spectrum for p3 showed a weak H emission line ( erg cm-2 s-1) that was fit and removed using a single Gaussian profile before sky subtraction was performed. Flux calibration was then performed using observations of the standard stars PG0205+134 and Feige 110. Since the sky and standard stars were observed only with certain fibers, sky flats were used to perform a fiber-to-fiber throughput correction to improve the quality of sky subtraction and flux calibration.
The data reduction presented an additional challenge due to a large amount of instrumental scattered light in the data. After observations were concluded, it was determined that improper closure of the CCD head electronics box after servicing resulted in light leaking onto the CCD from exposed LEDs. This resulted in a gradient of excess counts over the entire CCD that increases to the blue, as well as a discrete feature primarily affecting fibers 8 - 18 near the [NII] 6583 emission line. The excess counts per (unextracted) pixel range from a few percent to of the continuum counts per pixel in the gradient, and are as high as of the continuum counts per pixel in the discrete feature. The counts are present in all science and calibration frames, although the magnitude and morphology of the counts varies somewhat from night to night.
A scattered light correction was performed using the apscatter task in IRAF. The scattered light between the spectra was identified, a model of the excess counts over the CCD was constructed, and these counts were subtracted to produce a cleaned version of the data. Specifically, a very high order function (60th - 100th order spline) was fit to the scattered light along and across the dispersion. A high order function was required to fit the structure in the discrete features; however, a lower order function was desired to fit the general gradient. Thus, a lower order function (5th order spline) was fit across the dispersion of the higher order fit to characterize the gradient. This latter fit was subtracted from the former to isolate the discrete features, which were then subtracted from the data, leaving only the smooth gradient to be removed. Finally, the gradient was fit and subtracted using 45th and 5th - 8th order splines along and across the dispersion, respectively.
Some residual evidence of the scattered light is apparent in several fibers. This evidence is largely manifested as artificial structure in the continuum around the [NII] 6583 emission line. The fibers that were rejected from the analysis due to the residual effects of scattered light are marked as such in Figure 3.
4.3. Error Analysis and eDIG Detection Criteria
The Poisson (random) error was calculated for the raw data and calibration frames, and propagated through the data reduction and analysis. The Poisson error is generally comparable to the RMS error in the continuum near the emission lines of interest. However, the scatter in a given continuum-subtracted, emission-line masked spectrum does not have a strictly Gaussian distribution; instead, a 3 Poisson error generally corresponds to a confidence interval. Thus, we define our eDIG detection criteria as follows: to have a detection, a fiber must have one or more emission lines with at least a 5 detection, or two or more emission lines with at least a 4 detection. The emission lines considered in the detection criteria are the H, [NII] 6583, and [SII] 6716, 6731 lines. The fibers with eDIG detections and non-detections are marked in Figure 3, as well as those that were excluded from the analysis due to contamination by foreground stars or scattered light residuals. Detections were made in of the fibers, and to a height above the disk of kpc.


Some example spectra are shown at a range of values for both the minor axis and off-axis pointings in Figure 4. In the disk ( kpc), the spectra are consistent with HII region emission ([NII]/H), while by kpc the spectra are characteristic of diffuse emission ([NII]/H). While the line profiles on the minor axis are fairly symmetric, rotational broadening results in line profiles off-axis that are clearly asymmetric. There is also evidence of line splitting due to multiple velocity components along the line of sight (e.g., for kpc, kpc).
To characterize the emission line properties further, we fit a fifth-order Legendre polynomial to the continuum using the IRAF task continuum. The stellar H absorption is negligible for the thick disk and halo, so we do not correct for any absorption. We then fit a single Gaussian to each of the detected emission lines in the continuum-subtracted spectra using the IDL function mpfitfun. (For each spectrum that meets the detection criteria above, the detected emission lines are those with at least 4 detections). The latter determines the Gaussian parameters and their corresponding uncertainties that best fit the data in a least-squares sense. These Gaussian fits yield the emission line intensities and widths, as well as the uncertainties on these quantities; the fiber locations and line intensities, widths, and velocities are given in online Table 3. We use these emission line properties to determine the three-dimensional density distribution and velocity dispersion of the eDIG layer below.
| Offset AlongaaFiber offsets along the major and minor axes are measured with respect to the galactic center at RA, Decl. = 02 22 33.4, +42 20 57. | Offset AlongaaFiber offsets along the major and minor axes are measured with respect to the galactic center at RA, Decl. = 02 22 33.4, +42 20 57. | bbAll line widths are standard deviations; the line widths are corrected for the instrumental resolution. | … | ccThe velocity centroid of the H emission line. | |||
|---|---|---|---|---|---|---|---|
| Major Axis () | Minor Axis () | ( erg s-1 cm-2) | ( erg s-1 cm-2) | ( km s-1) | ( km s-1) | … | ( km s-1) |
| -10 | -34 | 15.2 | 2.4 | 0.0 | 0.0 | … | 546 |
| +30 | -96 | 0.0 | 0.0 | 0.0 | 0.0 | … | 0 |
| -34 | -59 | 0.0 | 0.0 | 0.0 | 0.0 | … | 0 |
| -25 | -42 | 0.0 | 0.0 | 0.0 | 0.0 | … | 0 |
| -30 | -51 | 0.0 | 0.0 | 0.0 | 0.0 | … | 0 |
| … | … | … | … | … | … | … | … |
Note. — Table 3 is published in its entirety in the machine-readable format. A portion is shown here for guidance regarding its form and content. Columns 7 - 12 of the online table contain the line widths and corresponding uncertainties of the [NII] 6583 and [SII] 6716, 6731 lines. Fibers without eDIG detections have null values, and emission lines with less than 4 detections have null line widths.
5. Results
5.1. Density Distribution
5.1.1 Radial Density Distribution
Our first goal is to determine the three-dimensional density distribution of the eDIG layer in NGC 891. We consider the radial density distribution by examining constraints on the minimum and maximum galactocentric radius at which the gas is found, and . In H imaging, there is a sharp decrease in the eDIG emission around kpc, and we choose a radial cutoff to be consistent with this observation (Dettmar, 1990; Rand et al., 1990; Pildis et al., 1994). Heald et al. (2006a) analyze the position-velocity diagram of the eDIG layer in NGC 891 to argue that the gas is found at kpc. However, as discussed below, this may be due to spiral structure or other deviations from the simplified symmetric disk geometry assumed. Deep spectroscopic observations at large galactocentric radii ( kpc) are needed to definitely determine the radial cutoff of the eDIG in this galaxy. Here, we make the conservative assumption that the gas is found within kpc, and discuss the implications of a larger in §6.
We distinguish between a density distribution in which the gas fills the line of sight ( kpc; a disk model) and one in which the gas is preferentially found at moderate or large galactocentric radius ( kpc; a ring model). The motivation for testing such a model is threefold. First, we expect to observe the eDIG at moderate galactocentric radii over star-forming spiral arms due to galactic chimney mode feedback. Second, the observed values as a function of are remarkably similar for the on- and off-axis pointings, suggesting that the pathlength through the gas is comparable in both locations (see §5.1.2). Third, as shown in Figure 2a, the depth of the galactic potential well at the center of the galaxy means that any eDIG in this region is likely to remain close to the midplane.
In a rotating disk model ( kpc), a given line of sight samples gas at a range of galactocentric radii, and thus a range of projected velocities. In a rotating ring model ( kpc), however, a line of sight generally samples gas at moderate or large galactocentric radii, where the projected velocity of the gas is small. In the former case, we expect the line profiles to be more asymmetric than in the latter, and the emission lines may be characterized by low- or high-velocity wings. Note that this only applies near the minor axis; at the edge of the gas distribution, the disk and ring models are indistinguishable.
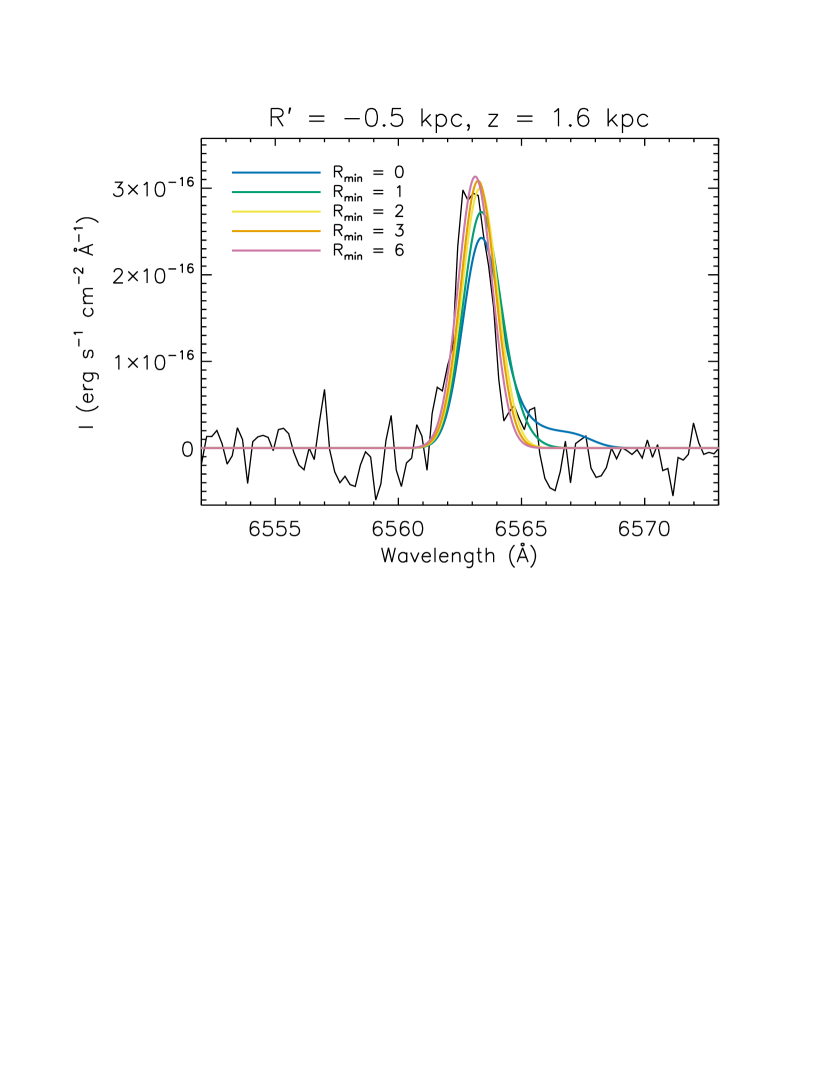
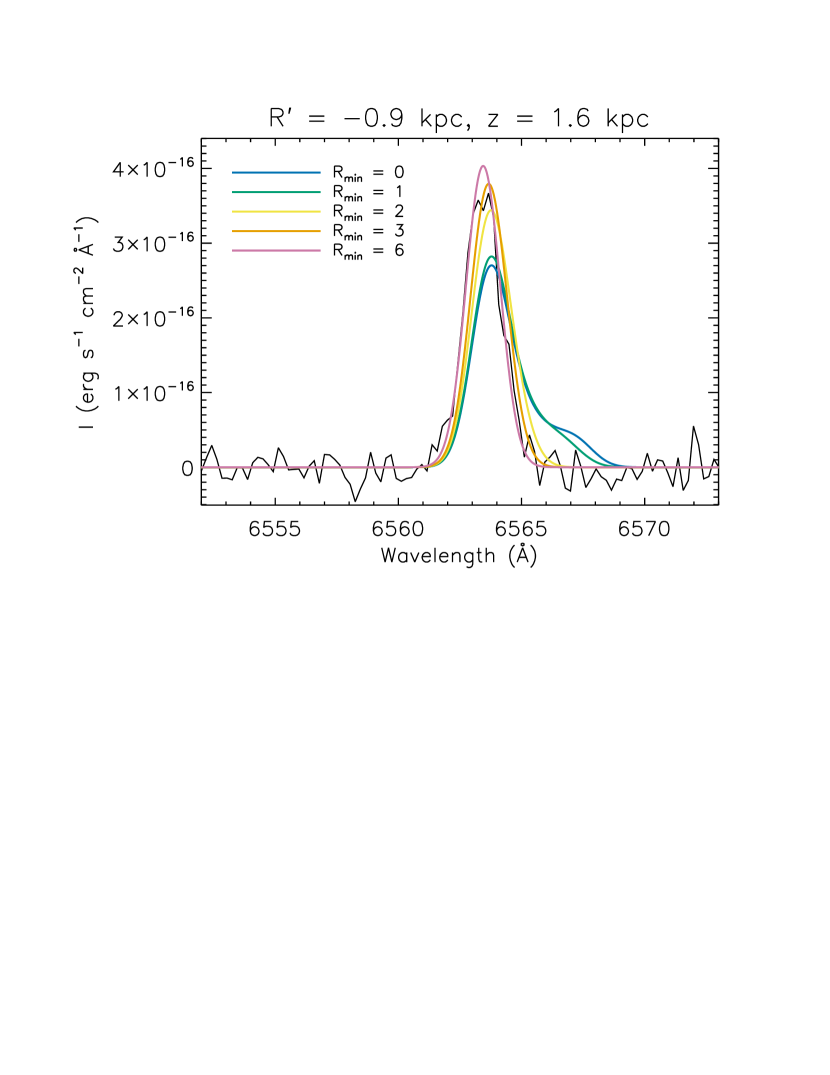
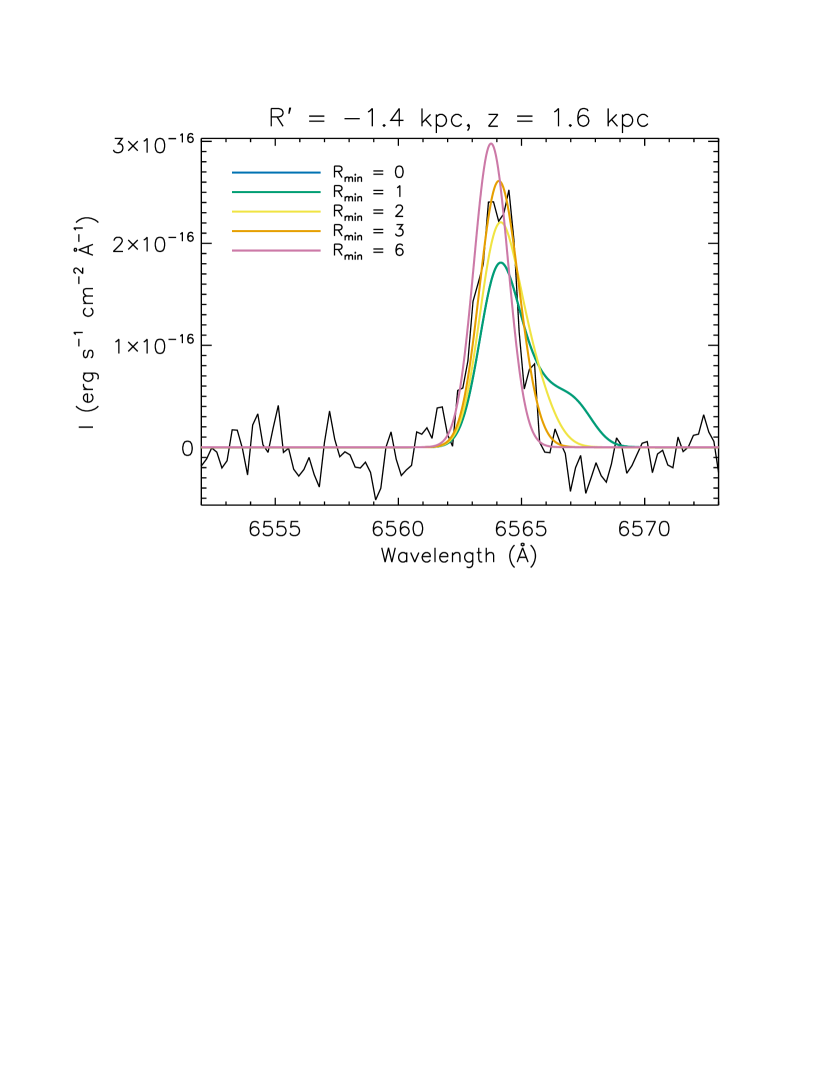
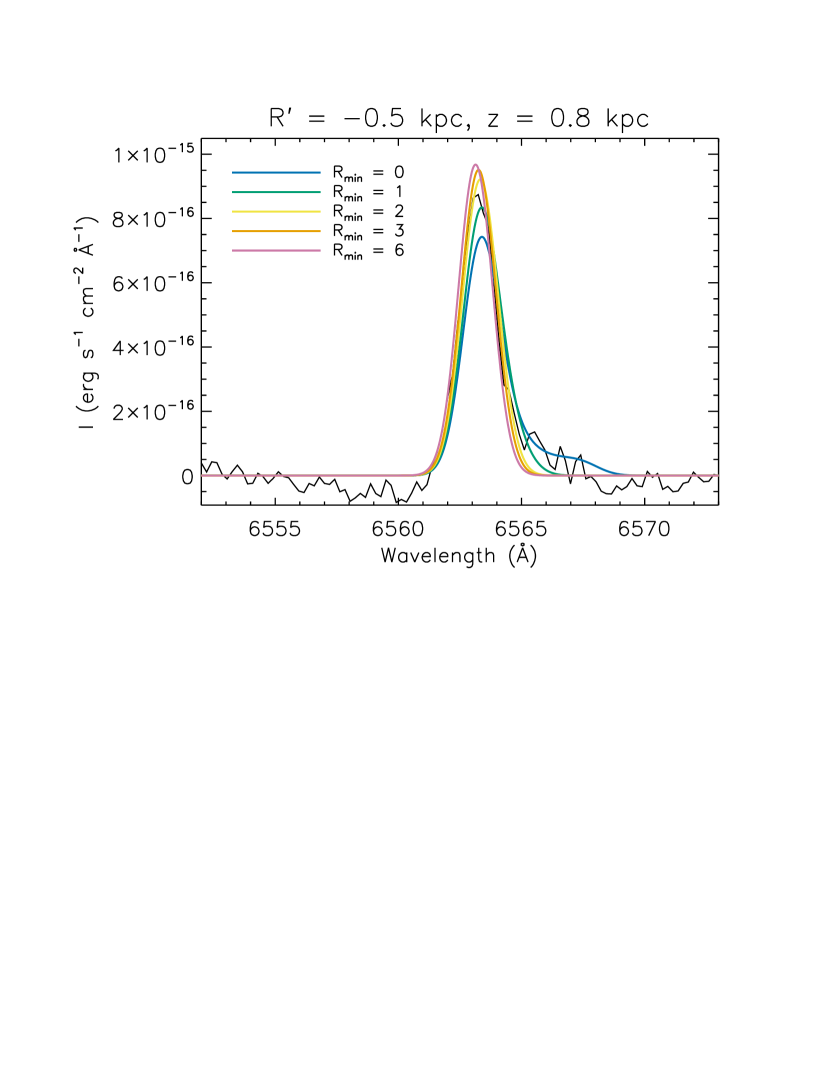
To explore this qualitatively, we compare the observed and modeled H line profiles that arise from the disk and ring models given the following assumptions. For the former model, the gas uniformly fills the disk between kpc; in the latter model, the gas is found between kpc, where is varied between kpc. We assume that the disk is oriented perfectly edge-on (), and that the emission arises along a line of sight that passes all the way through an optically thin disk or ring. We assume a flat rotation curve with circular velocity km s-1in the disk (Fraternali et al., 2011), with a vertical gradient in rotational velocity of km s-1 kpc-1 starting at kpc (Heald et al., 2006a; Kamphuis et al., 2007). Note that Heald et al. (2006a) do not observe a rotational velocity gradient in the southeast quadrant of the galaxy, and thus applying a single value of to the northeast and northwest quadrants may be a simplification.
To construct the line profile at a given and , we assume that the line profile from a cloud of gas moving with line-of-sight velocity with an internal velocity dispersion is a Gaussian of the form:
| (11) |
Here, , where is the angle between and , and the sign is determined by whether is on the approaching or receding side of the galaxy. We choose necessary to reproduce the observed intensity, and we define , where km s-1is the instrumental resolution at , km s-1is the thermal velocity dispersion of the protons, and km s-1is the turbulent (random) velocity dispersion of the gas (see §5.2). We assume a gas temperature of K, here and throughout the rest of this paper (Rand, 1997; Collins & Rand, 2001). We construct the full line profile by summing over the profiles of individual, identical, uniformly distributed clouds of size pc that fill the allowed range in along the line of sight. We choose to be sufficiently small that across a cloud is negligible.
In Figure 5, we compare the line profiles for the disk and ring models to the observed line profiles for a range of values. The off-axis pointings pass close enough to the edge of the eDIG layer that the differences between the disk and the ring models are small, and thus the minor-axis pointings are where these differences are of interest. At kpc ( km s-1), the disk and ring models are indistinguishable. Moving to larger , the profiles are fairly symmetric for kpc, while the profiles become increasingly asymmetric and develop low- or high-velocity wings for kpc. The observed line profiles appear much more consistent with a ring model () kpc than with a disk or ring with small kpc. However, the line profiles are qualitatively similar for kpc, and distinguishing definitively between larger is not possible. There are a small number of spectra that do have wings consistent with a disk; an example of such a spectrum is shown at the bottom left of Figure 5. Additionally, some spectra have significant asymmetries that are inconsistent with both the disk and ring models, as shown at the bottom right of the same Figure.


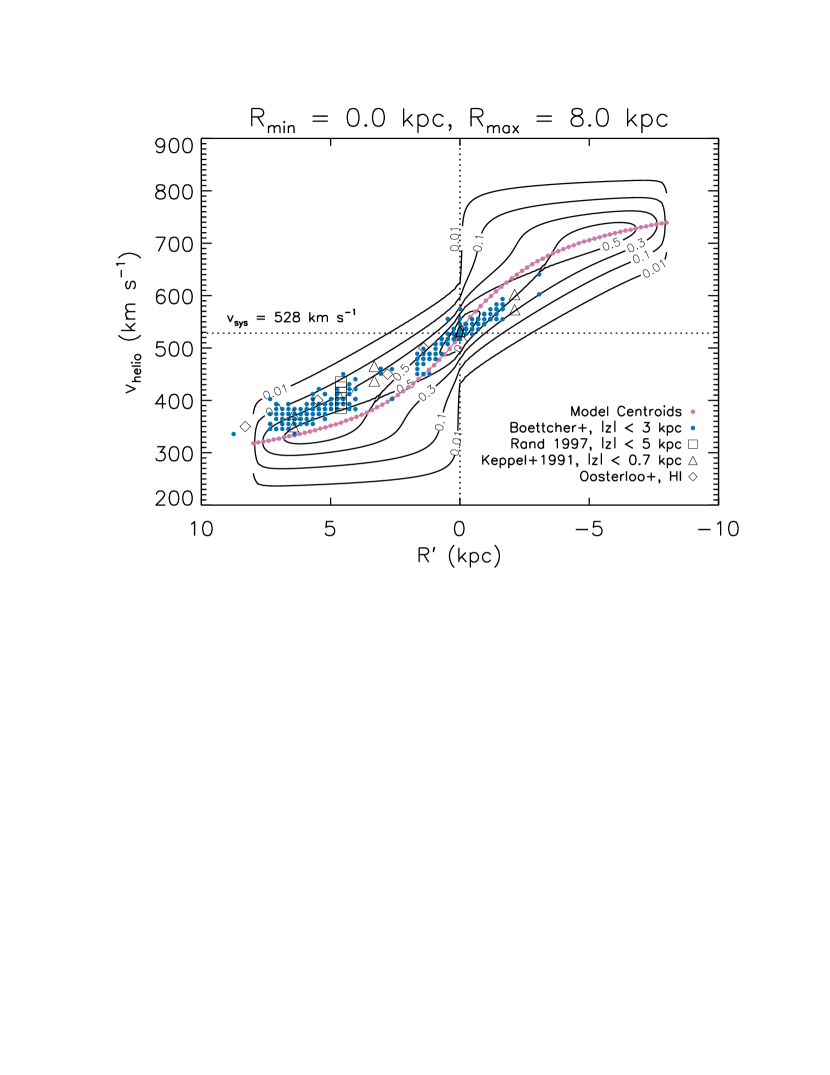
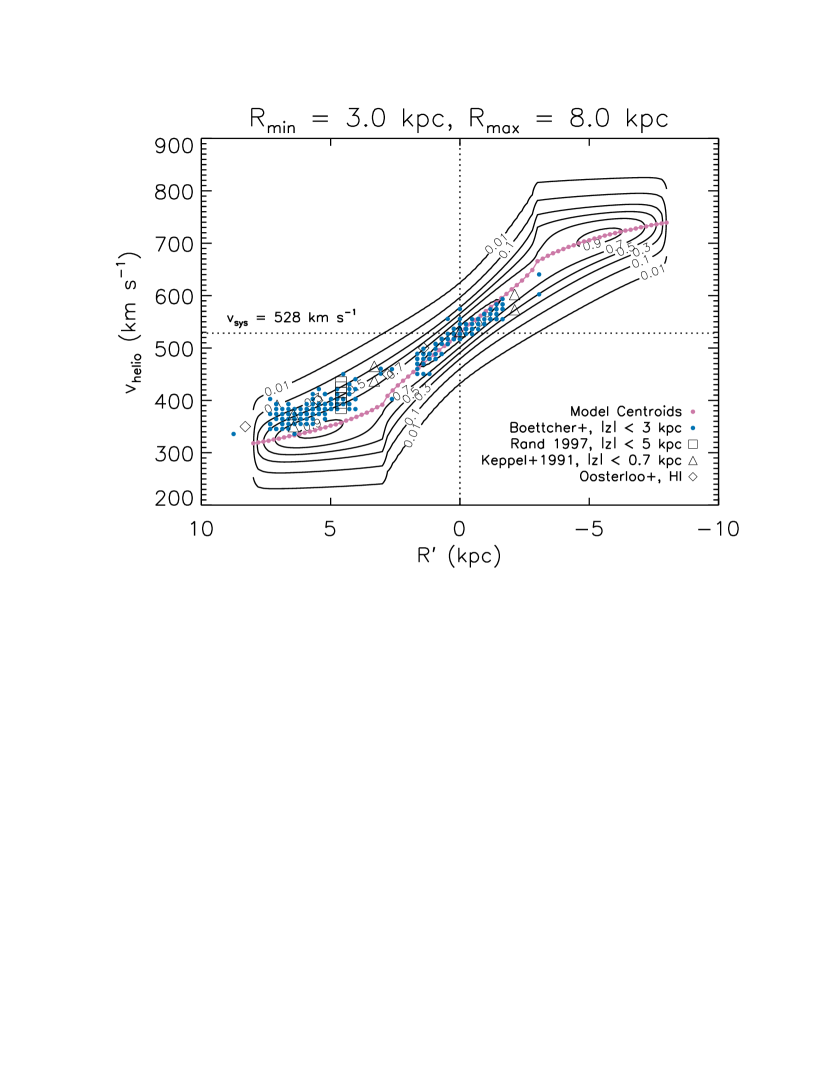
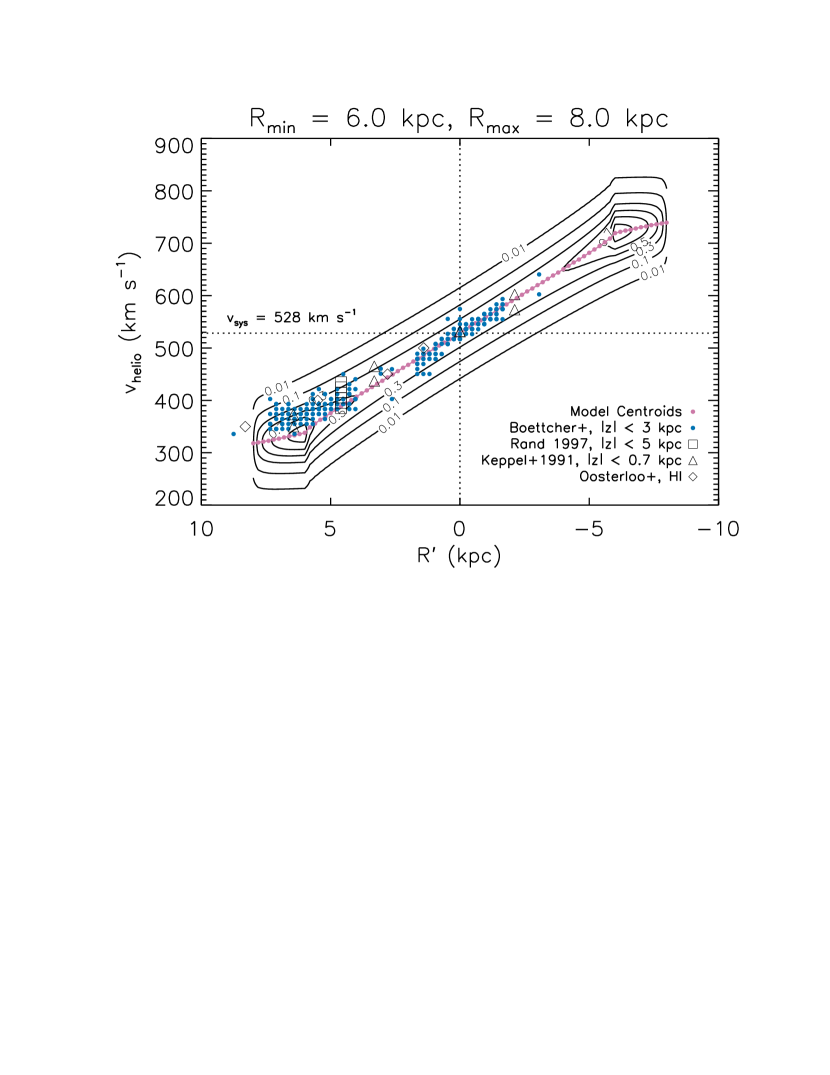
We also distinguish between a disk and a ring model by examining the position-velocity (PV) diagram of each model. We cannot construct robust PV diagrams from our data due to their low S/N. However, we can determine the location of the H velocity centroids in the PV plane, and compare these to the velocity centroids of each model. The results are shown in Figure 6 for 0, 3, and 6 kpc. Although neither the minor-axis or off-axis centroids are well-reproduced for kpc, the minor-axis centroids are increasingly well-characterized with increasing . The off-axis centroids are closer to the systemic velocity than predicted by any model; these can be made consistent by either increasing the radius of the eDIG layer to kpc, or decreasing the rotational velocity of the gas by km s-1kpc-1. However, the former is inconsistent with imaging (Dettmar, 1990; Rand et al., 1990; Pildis et al., 1994), and the latter with PV diagram analysis of higher S/N data of the northeast quadrant of the same system (Heald et al., 2006a; Kamphuis et al., 2007). It is interesting to note that Heald et al. (2006a) observe a rotational velocity of km s-1in the southeast quandrant without clear evidence of a rotational velocity gradient. Alternatively, the centroids may be closer to systemic velocity than expected due to spiral structure or other deviations from our simple symmetric geometry. The observed velocity centroids are given in online Table 3.
Though we cannot fully reproduce the velocity centroids at large with any of our models, we can conclude that the observations are more consistent with a ring model than with a disk model. The absence of low- and high-velocity emission line wings suggests kpc, while the location of the velocity centroids in the PV plane suggests a larger kpc. However, as the velocity centroids are not fully reproducable by this model, we do not claim to robustly constrain . Note that a true ring model in which there is little eDIG within is more consistent with observations than the quasi-ring produced by an isobaric gas layer in the galactic gravitational potential (i.e., a model in which increases with ). The latter model produces a slope that is steeper than observed in the , plane (see §5.1.2).
Interestingly, Heald et al. (2006a) find evidence for a gas density profile that peaks at kpc and decreases to larger and smaller radii by modeling the PV diagram of the eDIG layer in NGC 891 (see their Figure 3). Kamphuis et al. (2013) also argue for non-cylindrically symmetric HI layers in edge-on galaxies from the HALOGAS survey. Thus, although cylindrical geometry is often assumed for extraplanar gas layers, there is evidence for non-cylindrical geometries in multiple galaxies.
In summary, the observed emission line intensities and profiles suggest that the eDIG may fill only a small percent of the volume along a given line of sight, and are qualitatively consistent with the eDIG being found in a ring that is a few kpc thick between kpc. It is likely that any given line of sight intersects one or more eDIG clouds or filaments that may be found over star-forming spiral arms, but are also subject to a certain amount of randomization in their radial distribution and rotational velocity.
5.1.2 Vertical Density Distribution
We now consider the vertical density distribution of the gas. The H intensity is related to the electron density along the line of sight by:
| (12) |
where is the volume filling factor, is the electron density, and is the gas temperature expressed in units of K (note that is in Rayleighs). We assume an electron density distribution of the form:
| (13) |
where is the electron density at the midplane and is the exponential electron scale height defined in Equation (10). We choose a distribution of this form for several reasons. First, there is empirical evidence that this form provides a good fit to the data from past studies of the eDIG layer in this galaxy (e.g., Dettmar, 1990; Rand et al., 1990; Rand, 1997; Hoopes et al., 1999). Second, above kpc, we cannot confirm that is dependent on (see §5.2), and is only weakly dependently on (see §2 and the gravitational potential derived therein). We see from Equation (9) that if these quantities are independent of , then an exponential profile with a constant scale height is a good representation of the density distribution. We also tested a distribution of the form , but the quality of the fit was not improved.
We re-express the intensity as follows, assuming that the temperature, filling factor, and pathlength through the eDIG layer are independent of ():
| (14) |
From Equation (13), we model for a range of and values, and compare to the observed using a minimization approach (i.e., minimizing the value of the reduced defined by , where is the number of degrees of freedom). A comparison of modeled and observed values was made at every and value where the eDIG was detected. This comparison was performed separately for the East and West sides of the galaxy. The observed values are given in online Table 3.
We consider both a single-component (thick disk) model as well as a two-component (thick disk and halo) model. The two components are distinguished by different scale heights as well as different electron densities in the midplane. Rand (1997) identifies a thick disk and a halo component in long-slit spectroscopy of this system at kpc; while we detect the eDIG to a height of kpc above the midplane, he detects the eDIG to the remarkable height of kpc, and is thus better able to characterize the halo properties. Therefore, we use his parameterization of the halo in our two-component model (see Table 4), and perform the minimization to parameterize the thick disk in both our single- and multi-component models.
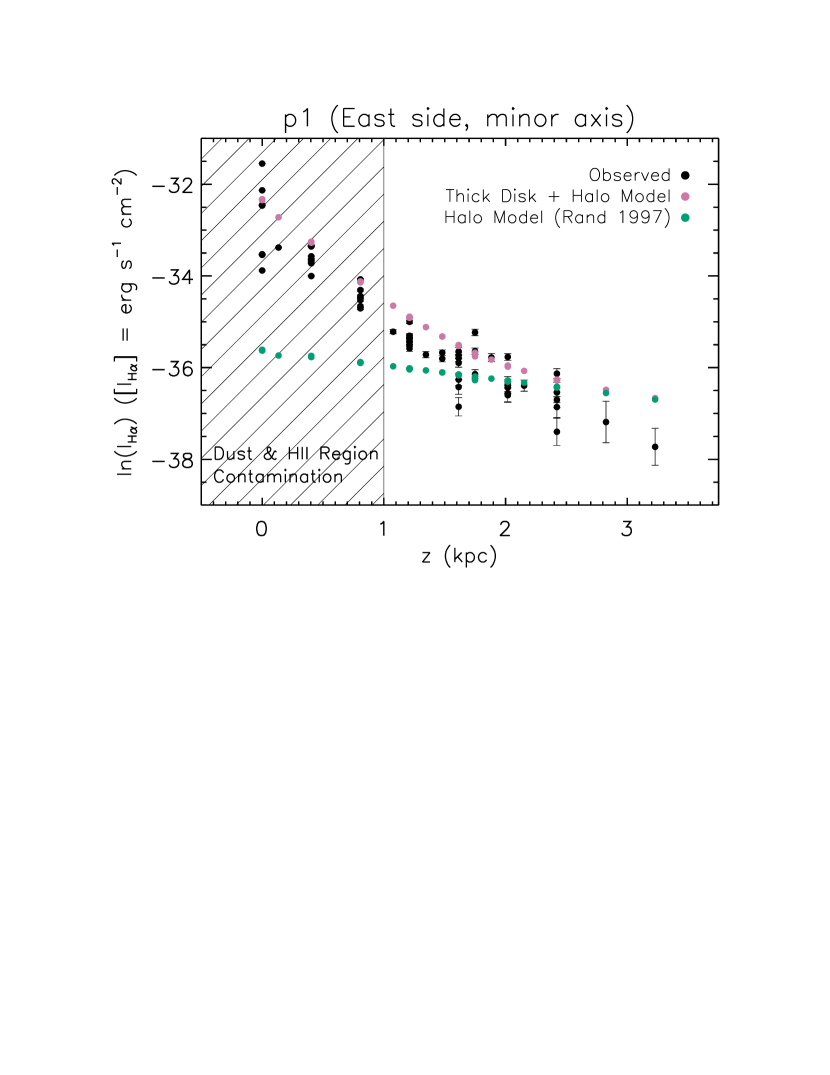
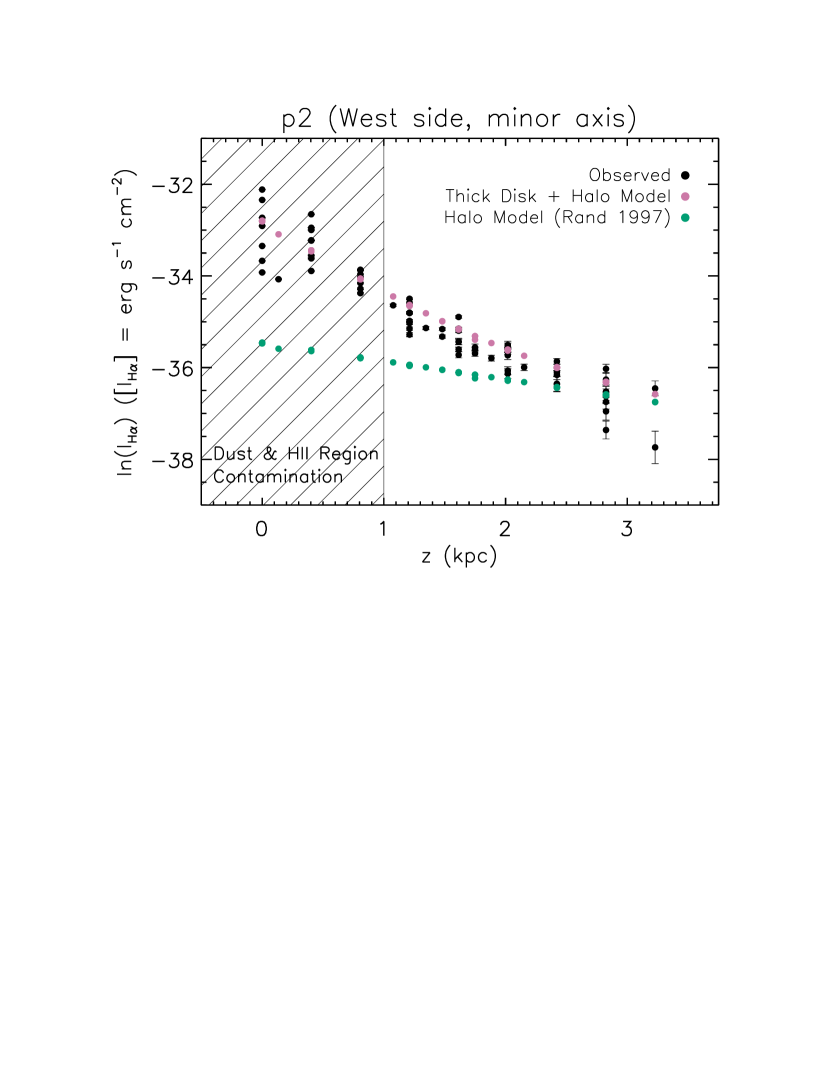
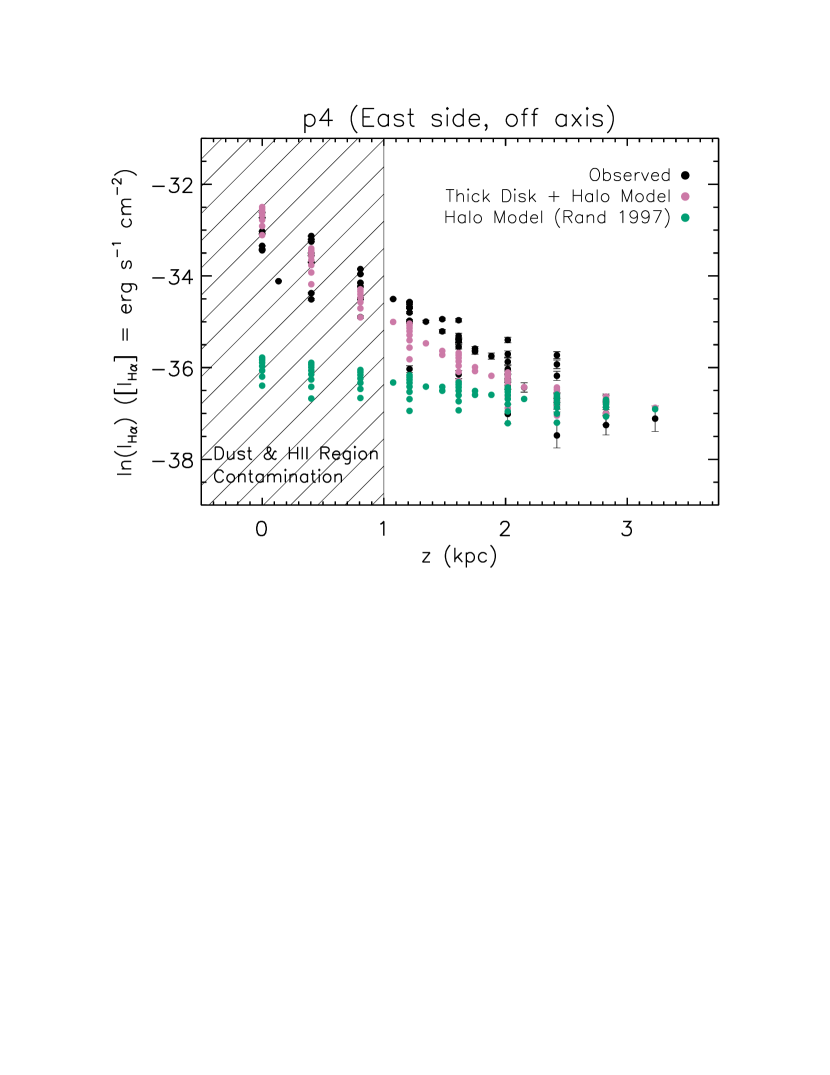
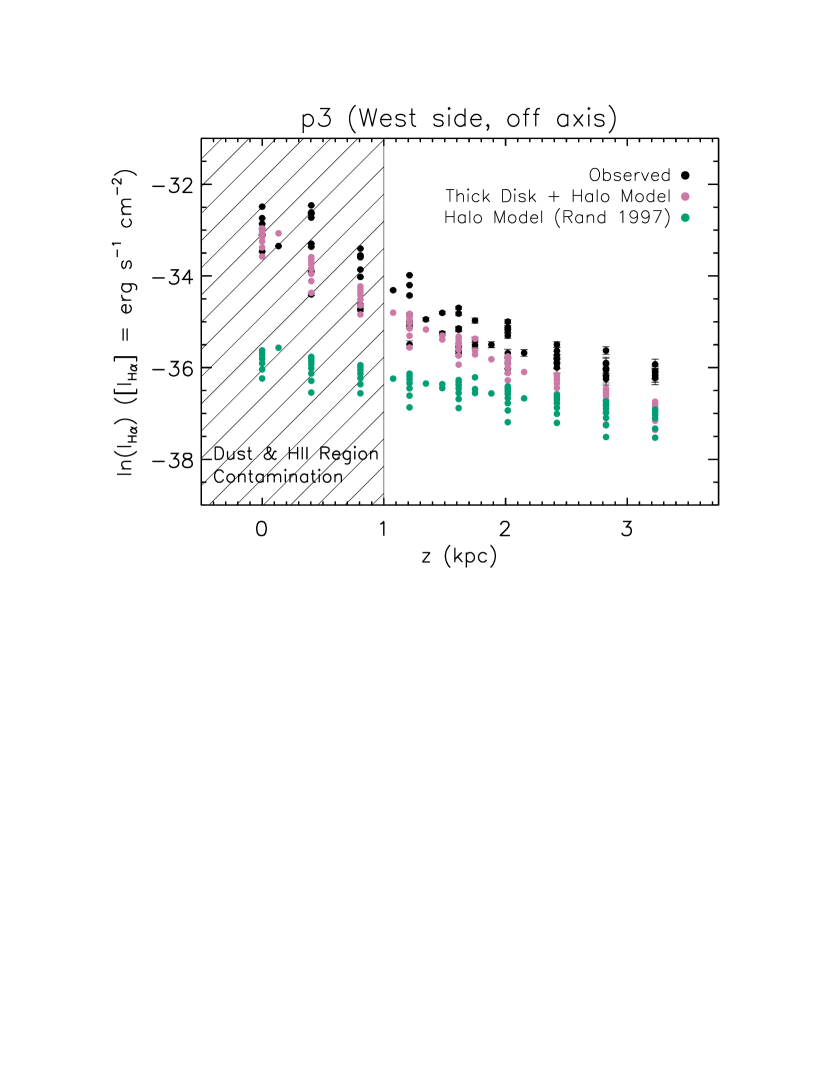
We exclude all observations at kpc to reduce the effects of dust extinction and HII region contamination. Recently, the remarkable vertical extent of extraplanar dust in NGC 891 has become clear; in addition to a dust disk with a scale height of kpc (Schechtman-Rook & Bershady, 2013; Seon et al., 2014), there is a dust halo with a scale height determined by Seon et al. (2014) to be kpc, and by Bocchio et al. (2016) to be kpc. As the eDIG layer and the dust halo have comparable scale heights, dust extinction of the eDIG layer must be considered.
Bocchio et al. (2016) model the -band optical depth, , as a function of for NGC 891 (see their Figure 7). We consult the dust model of Draine (2011) to find (see his Table 21.1). Bocchio et al. (2016) find at kpc, and thus we find at this height. Although this estimate is very approximate, it suggests that we are detecting of the photons from the far side of the disk above kpc. This conservative cut also reduces the contamination from HII region emission; Monte Carlo radiative transfer simulations of diffuse and HII region photon propagation through the dust disk of NGC 891 suggest that scattered HII region photons are only of diffuse photons by kpc (Ferrara et al., 1996).
The values of and that minimize for the one- and two-component models are given in Table 4. The minimum exceeds unity by more than an order of magnitude in all cases. This is likely due to the observed spread in at a given that arises from the clumpiness of the eDIG as well as the uncertain geometry of the layer (the modeled spread in is due to the varying pathlength through the layer at different values of ).
For the East and West sides of the disk, respectively, the two-component fit produces thick disk scale heights of kpc and kpc that are consistent with past measurements (Dettmar, 1990; Rand et al., 1990; Dettmar et al., 1991; Keppel et al., 1991; Rand, 1997; Hoopes et al., 1999). Specifically, the thick disk scale heights for both the one- and two-component fits are within of those found by Hoopes et al. (1999) from H imaging averaged over the central 10 kpc of the disk, despite differences in the halo scale heights of a factor of 2 - 3. This suggests that our thick disk scale heights are not strongly sensitive to our choice of halo scale height, and our fit to a sparsely sampled disk is consistent with that averaged over a fully imaged disk. The two-component fit improves the value only negligibly compared to the one-component fit.
The addition of a radial scale length to the electron density distribution given in Equation (13) does not improve the quality of the fit in a sense. However, we consider one variation on the radial density distribution - a ring model in which the eDIG is excluded from the inner part of the galaxy at . We evaluate the values of our two-component model with kpc. An improvement in is seen for both the East and West sides; minimum values of 16.6 and 29.8 are found for kpc for the East and West sides, respectively. The best-fit values of and remain within of those given in Table 4. Although this evidence is in favor of a ring model, we cannot robustly constrain using this method or previous considerations of the line profiles and PV diagram.
Thus, we have considered both one- and two-component fits to the H intensity, as well as both disk and ring models. For the purposes of this paper, we focus on the two-component disk model; the observed and model values for this fit as a function of are shown in Figure 7. Since a disk model maximizes the pathlength through the gas, it minimizes the value of , and thus a dynamical equilibrium model is easier to satisfy for a disk than a ring model. Additionally, the smaller scale height of the thick disk in the two-component model makes the dynamical equilibrium model easier to satisfy than in the one-component model. For the purposes of this paper, we focus on the dynamical state of the thick disk, for which scale heights of kpc and kpc were found for the East and West sides of the disk, respectively. We take the average of these two values, kpc, as well as the average of the electron density in the disk, cm-6, as the eDIG density distribution that we seek to satisfy with our dynamical equilibrium model for the remainder of this paper.
| East SideaaThe East side of the disk (p1, p4 in Table 2) was fit separately from the West side (p2, p3 in Table 2). | West Side | |||||||||
|---|---|---|---|---|---|---|---|---|---|---|
| Model | bbThe parameters of the second (halo) component are taken from Rand (1997). | |||||||||
| (kpc) | (cm-6) | (kpc) | (cm-6) | (kpc) | (cm-6) | (kpc) | (cm-6) | |||
| Thick Disk | 1.5 | - | - | 77.5 | 1.8 | - | - | 80.5 | ||
| Thick Disk + Halo | 0.8 | 6.0 | 77.4 | 1.2 | 5.0 | 79.2 |
5.2. Thermal and Turbulent Support

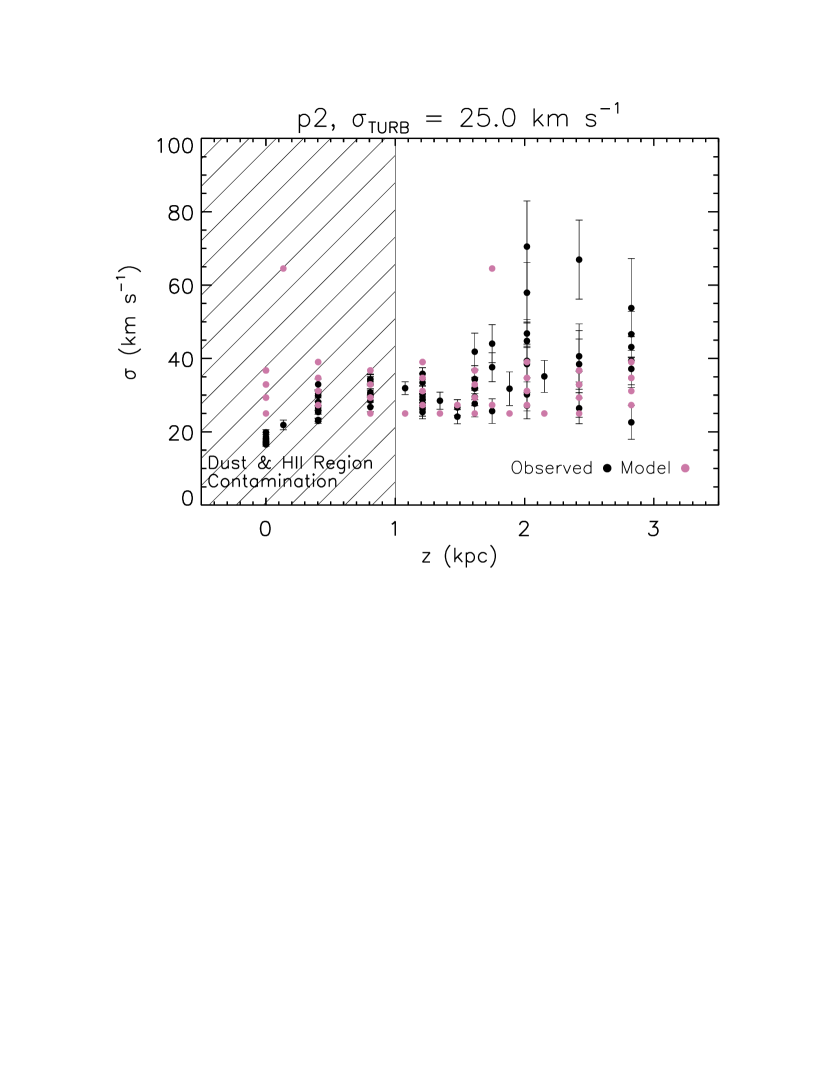
Our second goal is to quantify the thermal and turbulent (random) velocity dispersions of the eDIG layer, and compare these velocity dispersions to those required to satisfy the dynamical equilibrium model. We quantify the emission line widths along the minor axis of the galaxy (p1 and p2 in Table 2), where the contribution of rotation to the line width is minimized. Our data have the highest spectral resolution with which the eDIG has been observed along the minor axis of this galaxy, and thus our data are uniquely suited to determining the velocity dispersion of the eDIG layer.
The width of an emission line that arises along a line of sight through an edge-on eDIG layer is a result of several factors: thermal motions (), turbulent motions (), galactic rotation (), and non-circular motions such as streaming along spiral arms ():
| (15) |
We consider each term in Equation (15). The term on the left hand side is an observed quantity for each atomic species (H, N, S) as a function of and . The first term on the right hand side follows for each atomic species given our assumption of a gas temperature of K. The third term follows from the rotation curve of the galaxy, as well as the rotational velocity gradient in , given an assumption about the geometry of the eDIG layer. We cannot robustly quantify the fourth term, which is due to bulk motions that deviate from our simple assumptions about the geometry and rotation of the eDIG layer. Thus, we combine the second and fourth terms into a single term that is understood to represent an upper limit on the turbulent velocity dispersion of the gas. We assume that the turbulent motions in the gas are isotropic such that . This is the quantity that we desire to measure. The observed values are given in online Table 3.
We measure an emission line width for all fibers with eDIG detections in pointings p1 and p2. Although ideally we would only measure line widths for fibers that fall strictly along the minor axis, the difficulty of precisely aligning the fiber array with the true rotation axis necessitates the use of all fibers in the minor axis pointings. For each fiber, we select all emission lines that are detected at the 4 level or greater ([NII] 6548 is excluded due to its weak intensity). The line widths and uncertainties are determined by fitting a Gaussian to the line profile using the IDL function mpfitfun as described in §4.3. These line widths are then corrected for instrumental and thermal broadening, and a single, non-thermal line width is determined by taking a median of the individual line widths.
These observed, non-thermal line widths are shown in Figure 8 as a function of for both minor axis pointings. The smallest line widths ( km s-1) are observed in the disk, where dust extinction limits the distance into the galaxy, and thus the rotational broadening, that we can observe. As increases, so does the line width, and we transition by kpc from widths characteristic of extincted HII region emission to those indicative of optically thin eDIG emission. Between and kpc, the line widths range largely between 25 and 40 km s-1, with a spread of km s-1 observed at all . Though there is no strong evidence of a -dependence in the line widths above kpc, there are several outliers at a range of values with line widths km s-1. It is possible that some of these fibers sample gas with intrinsically greater random motions; however, the low S/N at large means that we cannot distinguish between an intrinsically increased velocity dispersion and statistical scatter.
To determine the turbulent velocity dispersion, we model the non-thermal (turbulent and rotational) line widths for a range of turbulent velocity dispersions, and compare them to the observed non-thermal line widths using a minimization. To model the contribution of the rotational velocity to the line width, we must make an assumption about the geometry of the eDIG layer. Although we favor the ring model over the disk model presented in §5.1.1, we consider both models here due to our inability to definitively determine the geometry of the layer. In this way, we consider the turbulent velocity dispersion given the minimum (ring) and maximum (disk) amount of rotational broadening.
The disk model results in the maximum contribution of rotation to the line width. For this model, we create line profiles given the same assumptions as in §5.1.1, and compare the modeled line widths to the observed line widths using a minimization. As shown in Figures 8 and 9, for both minor axis pointings, a miniumum value of is found for km s-1. The value may exceed unity by a factor of a few due to deviations from our idealized geometry and rotation curve, as well as our inability to account for the effects of non-circular motion. The rotational broadening over the fiber array is consistent with the km s-1 spread in line width observed between kpc, where the minimum observed line widths are consistent with a purely turbulent origin, and the larger line widths are consistent with both a turbulent and rotational origin.
The ring model results in a minimum (negligible) contribution of rotation to the line width for kpc. The observed spread in emission line width may then be attributed to either a spread in intrinsic velocity dispersion, non-circular motions, or a combination of the two. Conservatively, we take the minimum line width observed above kpc to be the turbulent velocity dispersion, which is again km s-1. It may well be the case that larger observed line widths are due to larger intrinsic velocity dispersions; however, due to the plausibility of alternative explanations, we adopt km s-1for the purpose of our dynamical equilibrium model. For a K gas, this suggests that the eDIG layer has at most a sonic Mach number of .
5.3. Magnetic Field and Cosmic Ray Support
Radio continuum observations reveal an extended synchrotron halo from extraplanar magnetic fields and cosmic rays in NGC 891, as well as a spatial correlation between radio continuum and H emission (Dahlem et al., 1994). Here, we evaluate the magnetic field and cosmic ray pressure gradients inferred from the synchrotron emissivity as a function of height above the disk. We refer to an analysis of 1.5 and 6 GHz observations from the CHANG-ES survey performed by Schmidt (2016, in preparation). This survey has obtained radio continuum observations of 35 nearby edge-on disk galaxies using the Karl G. Jansky Very Large Array (Irwin et al., 2012; Wiegert et al., 2015). We assess the vertical pressure gradients given two different assumptions about energy equipartition between the magnetic field and cosmic ray energy densities.
First, we consider the case where energy equipartition holds in the halo of NGC 891. There is evidence from polarization studies of NGC 891 and other edge-on galaxies for a magnetic field morphology that is largely parallel to the midplane in the disk and increasingly perpendicular (“X-shaped”) in the halo (e.g., Krause, 2009). We assume a magnetic field with a simple, plane-parallel geometry of the form:
| (16) |
where is the magnetic field strength in the disk and is the magnetic field scale height. From the assumption of energy equipartition (), as well as that (Ferrière, 2001), we find:
| (17) |
| (18) |
Schmidt (2016) finds a magnetic field strength in the disk of G, and an average non-thermal halo synchrotron scale height of kpc at both 1.5 and 6 GHz averaged over the range of galactocentric radii considered for the eDIG layer. This is broadly consistent with past measurements; Dumke & Krause (1998) find kpc excluding the inner part of the galaxy at 4.85 GHz. Schmidt (2016) shows that the synchrotron scale height flares near the edges of the eDIG layer, but we exclude these larger scale heights from our average because they are found in radial bins centered at . The assumption of energy equipartition allows the magnetic field scale height to be estimated from the synchrotron scale height by . Therefore, for a spectral index , we find kpc.
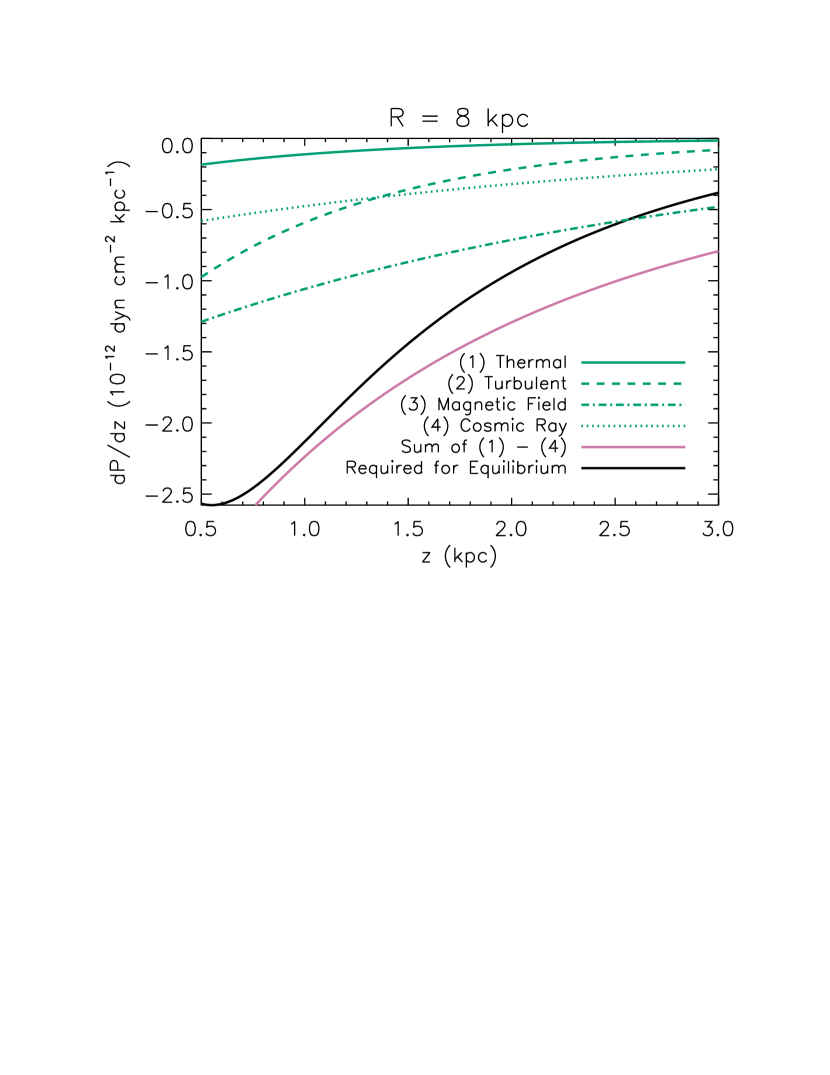
We now assess whether the available thermal, turbulent, magnetic field, and cosmic ray pressure can support the eDIG layer at its observed scale height. For each of these pressure terms, we calculate the vertical pressure gradient , and compare the sum of these pressure gradients to that required to satisfy the hydrostatic equilibrium equation (i.e., to the product of the density distribution found in §5.1 and the gravitational acceleration found in §2). For , the pressure gradient is only sufficient to satisfy the dynamical equilibrium model at a minimum galactocentric radius of kpc. Due to the monotonically decreasing strength of the gravitational field as a function of , it is also sufficient to satisfy the model at all larger galactocentric radii ( kpc). Where the pressure gradient does satisfy the model, it does so largely due to the magnetic field and cosmic ray pressure, with only small contributions from the thermal and turbulent pressures. The relative contributions of these pressure terms are shown in the top panel of Figure 10.
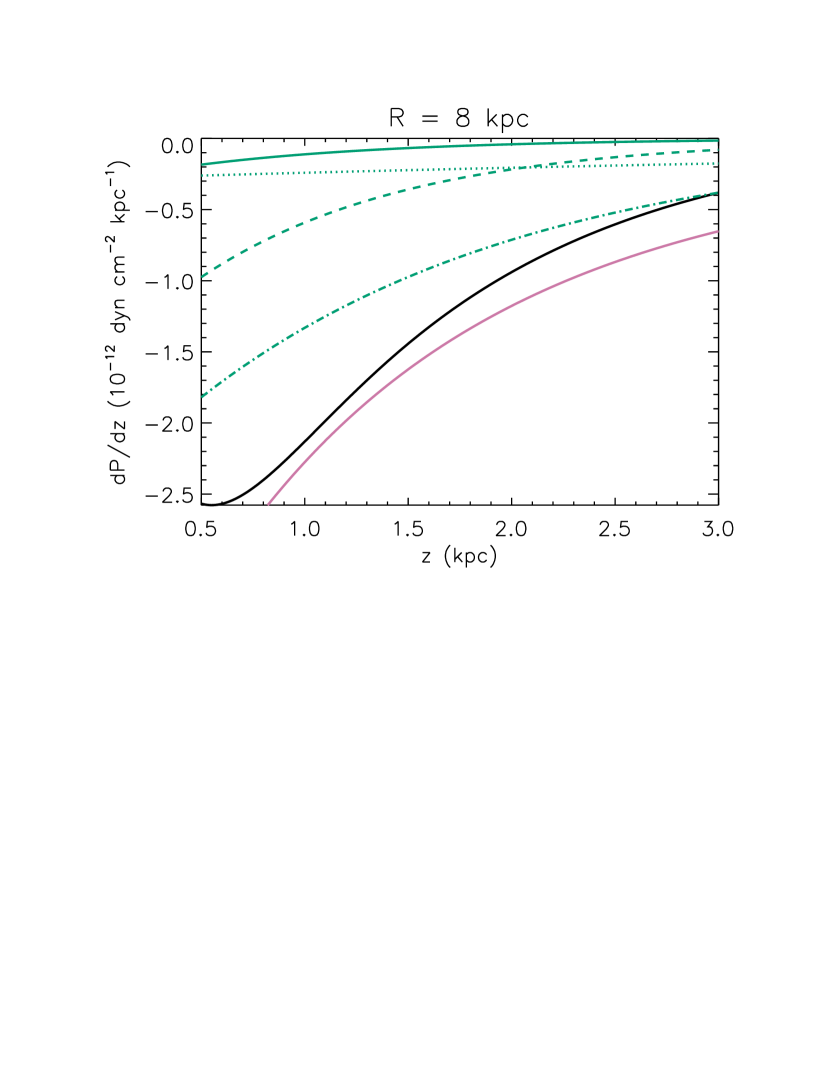
Now, we consider the case where energy equipartition no longer holds in the halo of this galaxy. Schmidt (2016) argues that energy equipartition is not a good assumption in the halo due to discrepancies between the magnetic field scale height found from equipartition arguments ( kpc) and from solving the cosmic ray transport equation ( kpc). The latter value follows from modeling diffusive and advective cosmic ray transport from the disk to the halo, and comparing observed and modeled synchrotron emissivities and spectral indices as a function of height above the disk. We then solve for the cosmic ray pressure as a function of height by requiring that the synchrotron emissivity remain consistent as a function of between the equipartition and non-equipartition cases (i.e., that the product of the magnetic field and cosmic ray energy densities is consistent between the models). Performing the same analysis as for the equipartition case, we again find that the dynamical equilibrium model is satisfied at kpc, though this model relies even more heavily on the magnetic pressure gradient to achieve dynamical equilibrium (see the bottom panel of Figure 10).
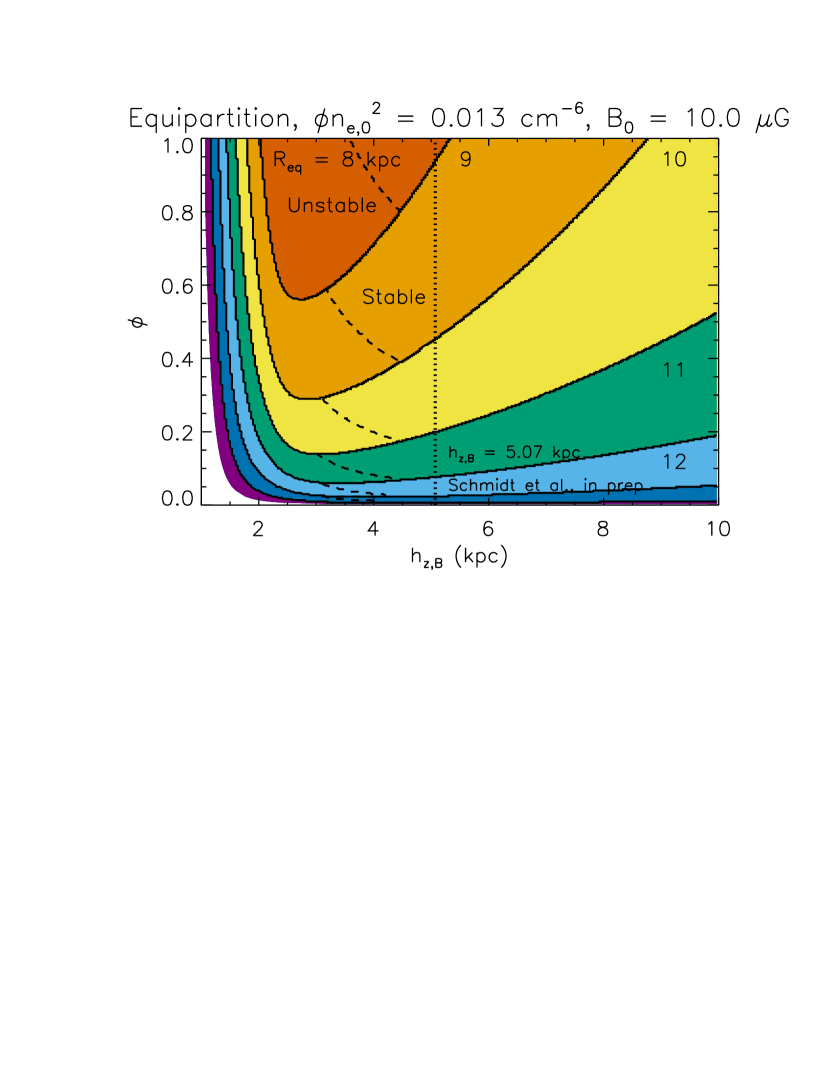
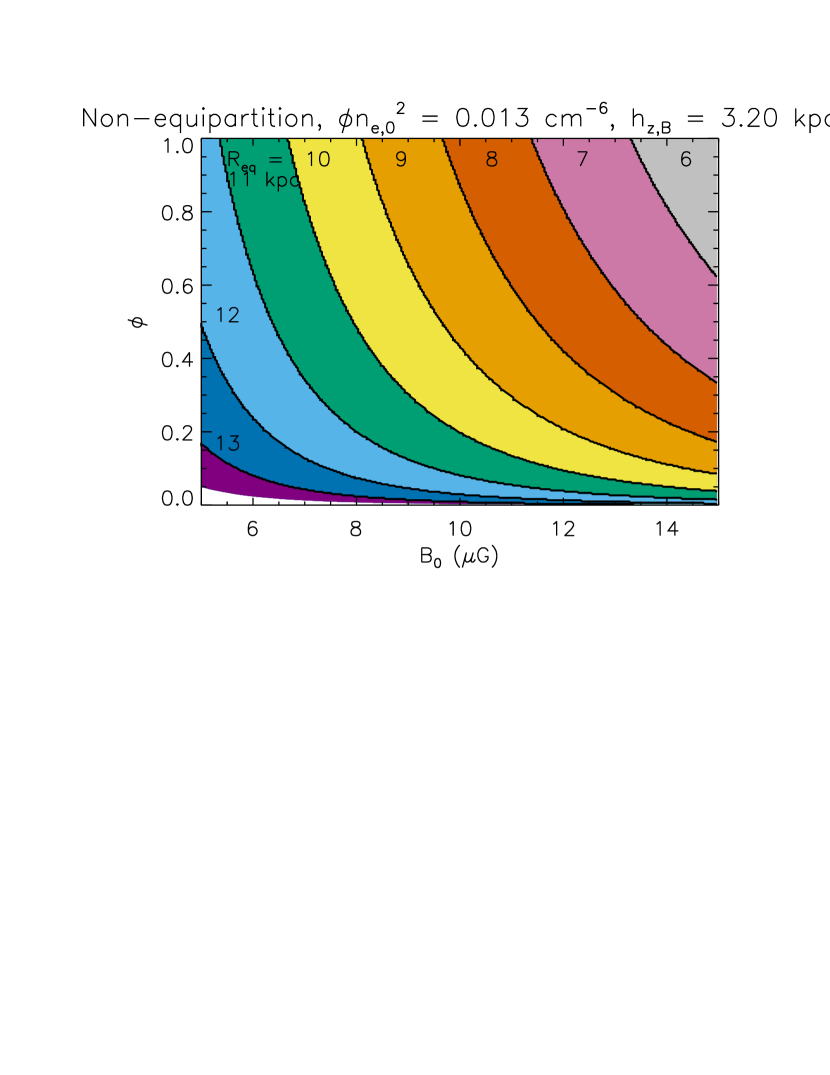
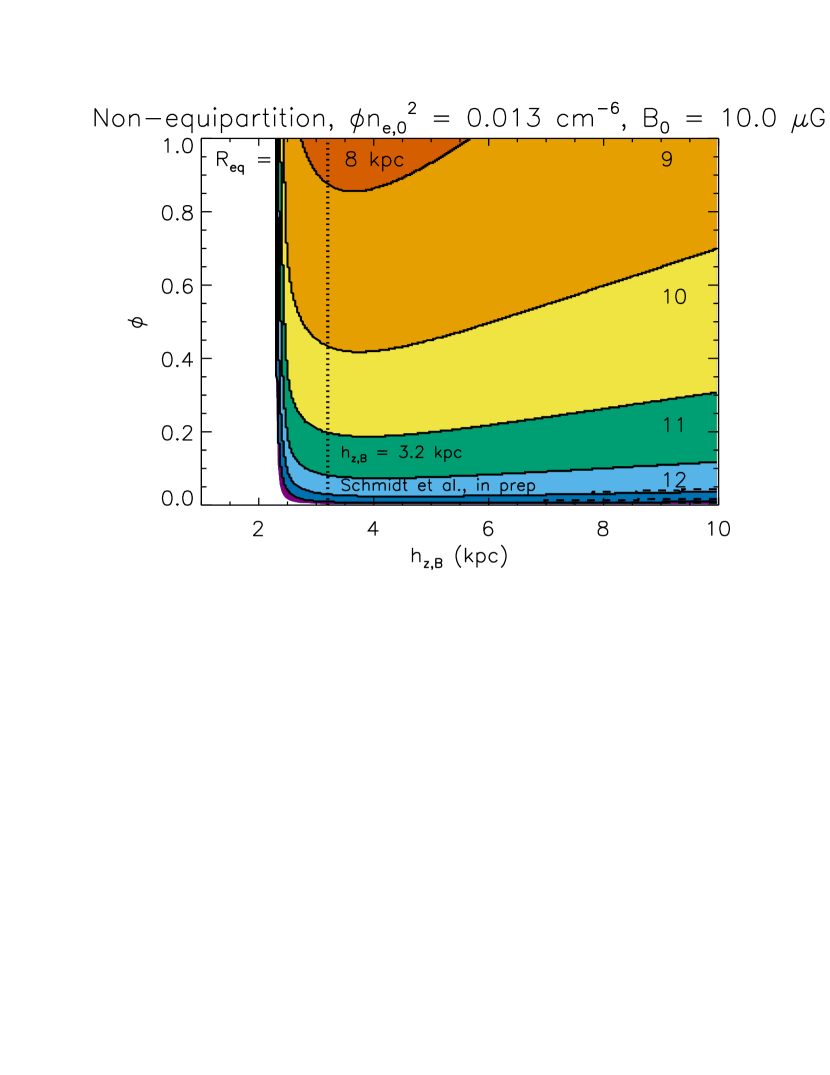
For the choice of eDIG filling factor, , and magnetic field properties, and , considered so far, the dynamical equilibrium model is not satisfied over the range of galactocentric radii where most of the eDIG is found ( kpc). However, the values of , , and are uncertain. It is likely that the gas is clumpy, reducing by as much as an order of magnitude. If the magnetic field has an X-shaped rather than a plane-parallel geometry, then the magnetic scale height may increase as a function of galactocentric radius, as is observed by Schmidt (2016). Additionally, if the synchroton-emitting region has a ring geometry instead of the disk geometry assumed by Schmidt (2016), as is likely the case for multiple phases of the ISM, then a stronger magnetic field strength is required to reproduce the same synchrotron emissivity over a shorter pathlength.
We consider how the success of the dynamical equilibrium model is affected by variations in , , and in Figure 11. We vary between , between kpc, and by 50, and plot the minimum galactocentric radius at which the dynamical equilibrium model is satisfied, , for both equipartition and non-equipartition assumptions. As before, the model is satisfied at all . In the - plane (left panels), a smaller value of (e.g., denser eDIG clouds and filaments) requires a stronger magnetic field (e.g., a steeper non-thermal pressure gradient) to satisfy the model at a given value of . In the - plane (right panels), a smaller value of requires a smaller value of to satisfy the model at a given value of until the eDIG and non-thermal pressure scale heights become comparable, at which point the non-thermal pressure can no longer support the eDIG at large .
Over much of parameter space, the dynamical equilibrium model again fails at galactocentric radii where the eDIG is found ( kpc). High magnetic field strengths (G) and large eDIG filling factors () are required to satisfy the model at kpc, and no choice of parameters satisfies the model at kpc. Thus, if the eDIG in NGC 891 is in dynamical equilibrium, the eDIG should be found in a ring over a limited range of galactocentric radii ( kpc).

5.4. Stability of a Magnetized eDIG Layer
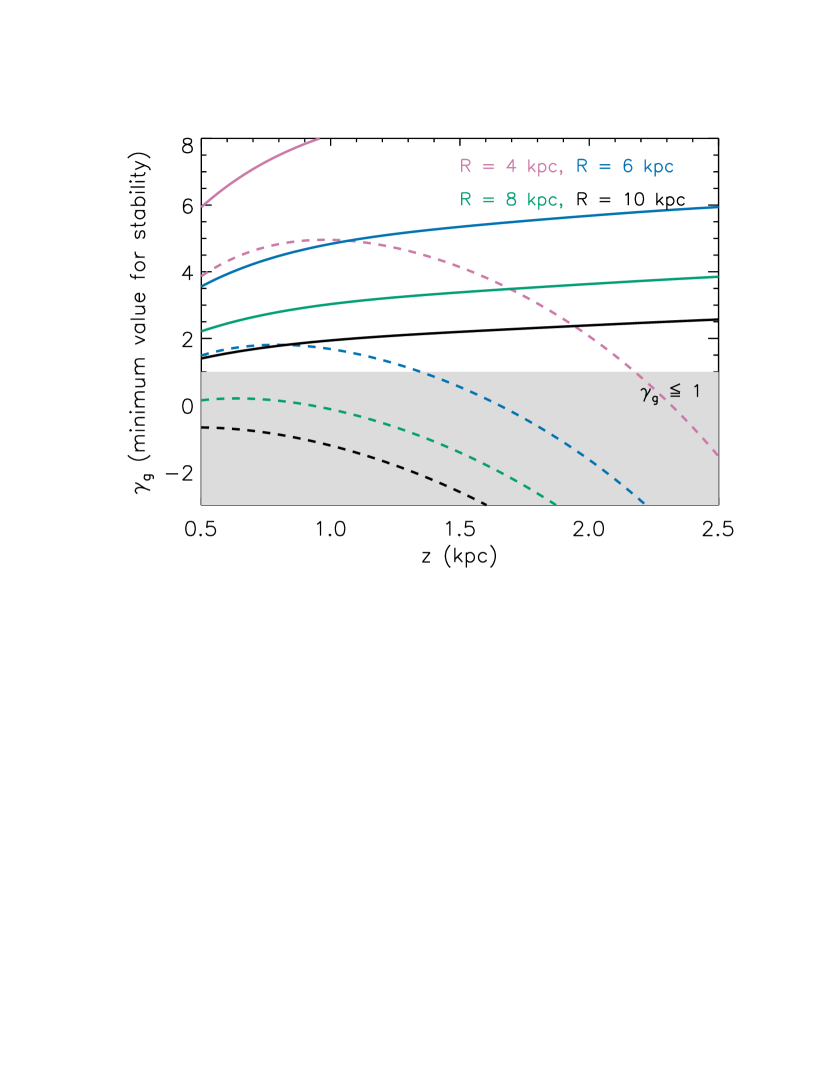
A magnetized plasma layer is subject to the well-known Parker instability (Parker, 1966), and we assess the stability of our dynamical equilibrium model here. The stability criterion for a horizontally magnetized plasma layer modified to include cosmic rays is given by:
| (19) |
where and refer to the adiabatic index of the thermal gas and the cosmic rays, respectively (Newcomb, 1961; Parker, 1966; Zweibel & Kulsrud, 1975). We evaluate whether the value required for stability is reasonable for two choices of . Although Zweibel & Kulsrud (1975) argue that values as large as are appropriate for the turbulent, star-forming ISM, we choose the more conservative value of for the eDIG (Parker, 1966). Our choice of a plane-parallel magnetic field geometry is an over-simplification, but has the advantage that the stability analysis is exactly solvable. Asseo et al. (1978, 1980) show similar results for more complicated, curved configurations.
If the cosmic rays are coupled to the system via scattering ( for our choice of ; Zweibel 2013), they contribute to stabilizing the layer for the motions parallel to the ambient magnetic field characteristic of the Parker instability. In Figure 12, the minimum required for stability is shown as the dashed curves for a range of galactocentric radii, the magnetic field parameters of Schmidt (2016) (see §5.3), and no gas clumping (). If instead the cosmic rays are not coupled to the system and simply diffuse along field lines (), then they have the effect of destabilizing the layer. The minimum required for stability is again shown as the solid curves in Figure 12. For both the equipartition and non-equipartition cases, the stability criterion is only satisfied if , and even then only at kpc.
In Figure 11, we indicate the regions of parameter space where the dynamical equilibrium model is unstable at for . In these cases, stability can be achieved by moving the gas to . Thus, our dynamical equilibrium model is stable only if the cosmic rays are well-coupled to the system, and, in some parts of parameter space, the minimum galactocentric radius required for stability is greater than that required for dynamical equilibrium.

6. Discussion
We tested a dynamical equilibrium model for the bright, vertically extended eDIG layer in NGC 891. Using optical emission line spectroscopy, we constrained the three-dimensional density distribution of the eDIG layer, and found exponential electron scale heights of kpc and kpc on the East and West sides of the disk, respectively. We argue that the symmetry of the emission line profiles, the location of the velocity centroids in position-velocity space, and the comparable H intensities on and off of the minor axis all suggest that the eDIG is preferentially found in a ring at moderate galactocentric radius ( kpc, kpc). This is qualitatively consistent with a picture in which the eDIG is found in discrete clouds and filaments above star-forming spiral arms where galactic chimneys and superbubbles can break out of the disk. The small volume filling factor suggested by this picture, as well as the likelihood of non-circular motions along the line of sight, are in qualitative agreement with the scatter observed in both the emission line widths and intensities.
From a mass model of NGC 891, we found that a velocity dispersion of km s-1is required to support the layer in dynamical equilibrium between kpc. In the mid-disk, this is at least a factor of a few larger than the thermal velocity dispersion of a K gas ( km s-1), and is also larger than the turbulent velocity dispersion along the minor axis ( km s-1). Thus, we find that the eDIG layer in this galaxy is not supported by thermal and turbulent pressure gradients at any galactocentric radius.
Using radio continuum observations from the CHANG-ES survey (Schmidt, 2016, in preparation), we demonstrate that the eDIG layer can be supported by magnetic field and cosmic ray pressure gradients only at galactocentric radii of kpc for the magnetic field parameters of Schmidt (2016) and an eDIG filling factor of . As this radius is comparable to the maximum radius at which the eDIG is observed, this model is only viable if the eDIG is found in a very thin ring at kpc. We also explore variations in the eDIG filling factor, magnetic field strength, and magnetic field scale height that suggest that a large filling factor () and a strong magnetic field (G) are required for the model to be viable over a larger range of radii () kpc.
A model in which the eDIG is found in a ring is qualitatively consistent with a picture in which the gas is found primarily over star-forming spiral arms. CO observations give some clues as to the nature of the spiral structure in this galaxy. Sofue & Nakai (1993) argue for a spiral structure similar to that in the Milky Way Galaxy: a compact nucleus, a bar with radius kpc, a ring at kpc, and additional intensity peaks suggestive of spiral arms beyond the ring. It is also possible that the ring at kpc may be a spiral arm viewed in projection (Garcia-Burillo et al., 1992; Scoville et al., 1993). Given emission line spectroscopy with higher S/N and higher spectral resolution, a stronger constraint on could be found for the eDIG layer, and thus the geometry of the eDIG layer and the spiral structure could be more closely compared. There is almost certainly eDIG found within , but this gas is likely to remain close to the disk due to the kinematics of the bar and the depth of the potential well, and thus would be obscured by the dust lane and HII region emission in our observations.
The success of the dynamical equilibrium model depends on our assumptions about the vertical and radial distribution of the eDIG layer. Our assumption of a symmetric density distribution, though necessary, is certainly a simplification. Additionally, a single-component fit to the H intensity produces a larger thick disk scale height than a two-component fit, making the model more difficult to satisfy for the thick disk at a given value of . If the gas is found beyond kpc, as is argued by Heald et al. (2006a), then our best-fit electron scale height decreases; for instance, if increases by , then decreases by . Similarly, if the gas is not found within a large , and the pathlength through the gas decreases by a factor of a few, then the electron density, , increases by the same factor. If the pathlength through the gas decreases by an order of magnitude, then the dynamical equilibrium model is only satisfied at kpc for the parts of parameter space considered in Figure 11. Thus, more robustly constraining through deep spectroscopic observations at kpc, as well as and by looking for characteristic radial distributions of eDIG in face-on disk galaxies, is important for future studies of the dynamical state of the eDIG layers in these systems.
There are other phenomena that could affect the dynamical equilibrium of the eDIG layer. First, it is possible that radiation pressure is a supplemental source of vertical support not considered here. A full treatment of radiation pressure in the eDIG layer would require knowledge of the radiation field and the gas-to-dust ratio in the layer (Franco et al., 1991). Second, any deviations from the simple, plane-parallel magnetic field geometry considered here require the magnetic tension force to be taken into account. Hill et al. (2012) unsuccessfully attempted to reproduce an eDIG scale height of kpc using magnetohydrodynamic simulations of a turbulent, star-forming gas layer. Their simulations failed to produce sufficient magnetic support for the gas layer due to the canceling of the magnetic pressure by the magnetic tension force. However, it is unclear whether this is simply a result of their periodic boundary conditions for the magnetic field.
It is important that we consider the eDIG layer in NGC 891 as one phase of a multi-phase gaseous halo. Studies of larger samples of galaxies have shown correlations in the morphologies and luminosities at radio continuum, far-infrared, H, ultraviolet, and soft X-ray wavelengths (Collins et al., 2000; Rossa & Dettmar, 2003a; Tüllmann et al., 2006a, b). As multiple phases are produced by the same star formation feedback processes, it is likely that these phases are not only co-produced but also co-evolve over time. The hot phase is of particular interest for eDIG layers, as extended soft X-ray emission is spatially correlated with H emission, suggesting that the warm phase may exist as cool clouds, clumps, and filaments embedded in a hotter phase (Strickland et al., 2004; Tüllmann et al., 2006a, b). Hodges-Kluck & Bregman (2013) detect an extended soft X-ray halo in NGC 891 that shares broad morphological similarities with the H emission. While the large scale height of the hot halo ( kpc) suggests that the pressure gradient in this medium is too small to affect the dynamical equilibrium of the eDIG, the presence of the hot halo may influence the cloud-cloud velocity dispersion, equilibrium pressure, and lifetime of eDIG clumps and filaments. In particular, line widths consistent with a sonic Mach number of in the warm phase are consistent with subsonic turbulence in the hot phase, suggesting that the quantity we are measuring is a cloud-cloud velocity dispersion of warm clumps embedded in a hot halo.
Schmidt (2016, in preparation) suggests that there is evidence for cosmic ray advection by a galactic wind with advection speeds of a few hundred km s-1in the spectral index profile as a function of height above the disk. Particularly, by solving the cosmic ray transport equation, they argue that advective cosmic ray transport produces a spectral index profile more consistent with observations than diffusive transport. If there is indeed a galactic outflow of the hot ionized medium, and the warm and hot phases are co-spatial, then there are implications for the dynamical equilibrium of the eDIG. Both ram pressure associated with an outflow and magnetic tension associated with a field that is anchored in the warm phase but advected in the hot may be additional sources of support. Though a quantitative consideration of this model is beyond the scope of this paper, the relationship between eDIG layers and galactic outflows is of interest for further study.
Oosterloo et al. (2007) show the pervasive presence of neutral gas in NGC 891; nearly of the HI mass is found in a halo with a scale height of kpc between the radii of interest ( kpc). The neutral phase may affect the dynamical equilibrium of the ionized phase in several ways. First, it increases the power requirement of the eDIG by increasing the energy dissipation via shocks from cloud-cloud collisions. Second, if both the neutral and ionized gas are supported in dynamical equilibrium by magnetic field and cosmic ray pressure, then the magnetic field and cosmic ray pressure gradients would need to be steeper than required here to simultaneously support both phases. Additionally, satisfying the stability requirement considered in §5.4 is more difficult in the neutral phase; due to ion-neutral damping of the Alfvén waves generated by the streaming instability (Kulsrud & Pearce, 1969), the cosmic rays are not well-coupled to the gas in the cold phase, and their effective adiabatic index is lower than in the warm phase (). The dynamical state of the neutral gas in NGC 891 is further complicated by extraplanar gas close to the systemic velocity or counter-rotating that is suggestive of interaction and/or accretion (Oosterloo et al., 2007). Thus, the impact of the neutral gas on the dynamical state of the ionized gas is a nuanced question that cannot be fully addressed here. A model that simultaneously considers the dynamical state of the cold, warm, and hot phases in this galaxy is of interest for future work.
6.1. Implications for the Milky Way Galaxy
NGC 891 and the Milky Way Galaxy are often considered “twin” galaxies due to similarities in structure and bolometric luminosity (van der Kruit, 1984). As our internal vantage point presents challenges for studying the eDIG layer in our own Galaxy (the “Reynolds layer”; Reynolds 1993; Haffner et al. 2009), it is interesting to consider what insights are gained by comparing the eDIG layers in these systems. In the Galaxy, the warm, ionized medium (WIM) is observed along almost all lines of sight in the Wisconsin H-Alpha Mapper (WHAM) survey (Tufte, 1997), which has mapped the northern sky (Haffner et al., 2003) and is currently concluding mapping the southern (Haffner et al., 2010). With a one-degree beam, WHAM has observed a complex WIM morphology of clumps and filaments superimposed on a diffuse background. The physical conditions in the WIM are similar to those in the eDIG of NGC 891, with a temperature K, an average electron density cm-3, an ionization fraction for K (Reynolds et al., 1998), and a filling fraction in the disk that increases to by kpc (Reynolds, 1991; Haffner et al., 1999; Gaensler et al., 2008; Hill et al., 2008; Haffner et al., 2009).
The remarkable feature that the exponential electron scale height greatly exceeds the thermal scale height is observed in both NGC 891 and in the Galaxy. A study of the H intensity as a function of Galactic latitude above the Perseus spiral arm suggests an exponential electron scale height of kpc (Haffner et al., 1999). In velocity space, the WIM broadly traces the kinematics of nearby spiral arms, suggesting that the WIM may be spatially associated with regions of star-formation activity. Towards large galactic latitudes, the WIM is preferentially blueshifted, although it is unclear whether this is indicative of a local feature or of a global bulk flow (Haffner et al., 2003).
Thus, the dynamical state of the Reynolds layer is in question, and here we consider a dynamical equilibrium model for this layer by qualitatively comparing what is known about the thermal, turbulent, magnetic field, and cosmic ray pressure gradients in NGC 891 and in the Galaxy. An H line width of km s-1FWHM is observed toward the north Galactic pole (L. M. Haffner, private communication). As this is comparable to the thermal line width, this single, pencil-beam measurement suggests that the scale height problem may be even more severe in the Galaxy than in NGC 891. The non-thermal velocity dispersion of the WIM has also been measured by using the difference in mass between H and S to separate the thermal and non-thermal components of the H and [SII] 6716 emission lines (Reynolds, 1985). The S line widths mainly range from km s-1FWHM, suggesting km s-1for the WIM. These velocities are likely a combination of an intercloud and a cloud-cloud velocity dispersion. These results are consistent with (magneto)hydrodynamic simulations of turbulence in the WIM. The spatial gradient of linearly polarized emission is consistent with subsonic or transonic turbulence (Burkhart et al., 2012), the electron density power spectrum suggests transonic turbulence (Kim & Ryu, 2005), and the emission measure distribution function yields slightly supersonic Mach numbers of (Hill et al., 2008). Therefore, available evidence suggests that neither the eDIG layer in NGC 891 nor in the Galaxy are supported by a thermal or turbulent pressure gradient.
In the Galaxy, the synchrotron halo implies extraplanar magnetic field properties generally consistent with those of external quiescent galaxies. In the solar neighborhood, the magnetic field strength is G (Burlaga et al., 2013), and the magnetic field scale height is kpc or larger from equipartition arguments (Beuermann et al., 1985; Ferrière, 2001; Beck, 2016). Optical polarization of starlight suggests that the magnetic field lines are largely parallel to the midplane and follow the structure of the nearest spiral arm in the disk (Fosalba et al., 2002). The field also shows evidence of the extraplanar X-shaped morphology observed in other edge-on galaxies (Jansson & Farrar, 2012). Thus, the broad similarities between the magnetic field strength, scale height, and morphology in NGC 891 and in the Galaxy suggest that magnetic field and cosmic ray pressure gradients may play an important role in the vertical structure and support of the Reynolds layer.
A full quantitative comparison of the eDIG layers in these galaxies is beyond the scope of this paper, and requires considerations that range from the star formation rate to the accretion and interaction history of each galaxy. There are also clear differences between the warm, ionized phases in these systems; compared to the Galaxy, the eDIG layer in NGC 891 has a greater vertical extent, twice the surface density, and a higher ratio of ionized to neutral gas, possibly due to the higher star formation rate in the latter system (Rand et al., 1990). However, the success of the dynamical equilibrium model for NGC 891 warrants the exploration of such a model for the Galaxy given the broad similarities in the extraplanar gas and magnetic field properties of these galaxies.
7. Conclusions
We sought to determine the dynamical state of the eDIG layer in NGC 891. This layer is remarkable due to an observed scale height that exceeds its thermal scale height by a factor of a few. Specifically, we tested a dynamical equilibrium model by quantifying the thermal, turbulent, magnetic field, and cosmic ray pressure gradients in this galaxy. We summarize our results as follows:
-
1.
We obtained optical emission line spectroscopy of the eDIG layer using the SparsePak IFU on the WIYN telescope. We probed a wide range in height above and below the disk ( kpc) and in projected radius ( kpc) with moderate spectral resolution ( km s-1at H). We found a thick disk exponential electron scale height of kpc and kpc on the East and West sides of the galaxy, respectively. This is consistent with past measurements in the literature.
-
2.
Several pieces of evidence point to the eDIG being found preferentially at moderate galactocentric radius ( kpc, where kpc). These include the comparable on and off of the minor axis, the lack of low- and high-velocity emission line wings, and the location of the observed velocity centroids in position-velocity space.
-
3.
We measured the H, [NII] 6583, and [SII] 6716, 6731 emission line widths along the minor axis, and show that they are consistent with a turbulent medium with a sonic Mach number of . The thermal ( km s-1) and turbulent ( km s-1) velocity dispersions are far below that required to support the eDIG layer by thermal and turbulent pressure gradients between and the observed cutoff at kpc ( km s-1). The observed turbulent velocity dispersion is supersonic for the warm phase, but is subsonic for the hot halo; this is consistent with the eDIG being a collection of cool clouds embedded in a hot, potentially outflowing phase.
-
4.
We referred to an analysis by Schmidt (2016, in preparation) of the synchrotron halo in NGC 891 using CHANG-ES radio continuum observations to determine the magnetic field and cosmic ray pressure gradients in this system. The combined thermal, turbulent, magnetic field, and cosmic ray pressure gradients are sufficient to support the eDIG layer at a scale height of kpc at galactocentric radii of kpc. The uncertainty on the eDIG filling factor, magnetic field strength, and magnetic scale height yield an uncertainty of a few kpc on this galactocentric radius, and thus it is possible that the eDIG is supported in dynamical equilibrium in a thin ring between kpc.
-
5.
Our dynamical equilibrium model of a magnetized eDIG layer is Parker stable if the cosmic rays are sufficiently coupled to the system ().
-
6.
Similarities between the thermal and turbulent properties of the warm ionized gas as well as the synchrotron halos in NGC 891 and the Milky Way Galaxy suggest that extraplanar magnetic fields and cosmic rays may play an important role in the dynamical state of the Reynolds layer.
-
7.
In future work, a simultaneous treatment of the extraplanar cold, warm, and hot gas is desired to understand the dynamical state of the multi-phase gaseous halo.
Studying the eDIG layers of nearby edge-on disk galaxies has both advantages and disadvantages. We are able to directly determine the vertical scale height of the layer and quantify the gas, magnetic field, and cosmic ray pressure as functions of height above the disk. However, we cannot directly measure the vertical velocity dispersion or look for evidence of vertical inflow, outflow, or other non-equilibrium phenomena. We also cannot definitively determine the location of the gas along the line of sight, or search for spatial correlations between the properties of the halo gas and the underlying disk. Thus, fully characterizing the dynamical state of eDIG layers requires observations of disk galaxies with a range of inclination angles. Future work will focus on face-on disk galaxies at high spectral resolution to directly measure the vertial velocity dispersion and any vertical bulk flows, determine the radial distribution of the gas, explore connections between the gaseous halo, the underlying stellar disk, and the intergalactic environment, and assess the generality of the model presented here (Boettcher, Gallagher, Zweibel, & Benjamin, in preparation).
The future is bright for understanding the dynamics of extraplanar gas through careful studies of small samples of nearby galaxies, as well as through ongoing surveys studying the gaseous, magnetic field, and cosmic ray halos in these systems. Large IFU surveys including the Mapping Nearby Galaxies at Apache Point Observatory (MaNGA) project are enabling the statistical study of extraplanar gas properties in hundreds of low-redshift galaxies as part of the fourth-generation Sloan Digital Sky Survey (SDSS-IV) (Bundy et al., 2015). Additionally, the CHANG-ES survey will allow the extraplanar magnetic field and cosmic ray properties of tens of nearby galaxies to be characterized, and thus the relationship between gaseous and synchrotron halos to the studied in a statistical sense.
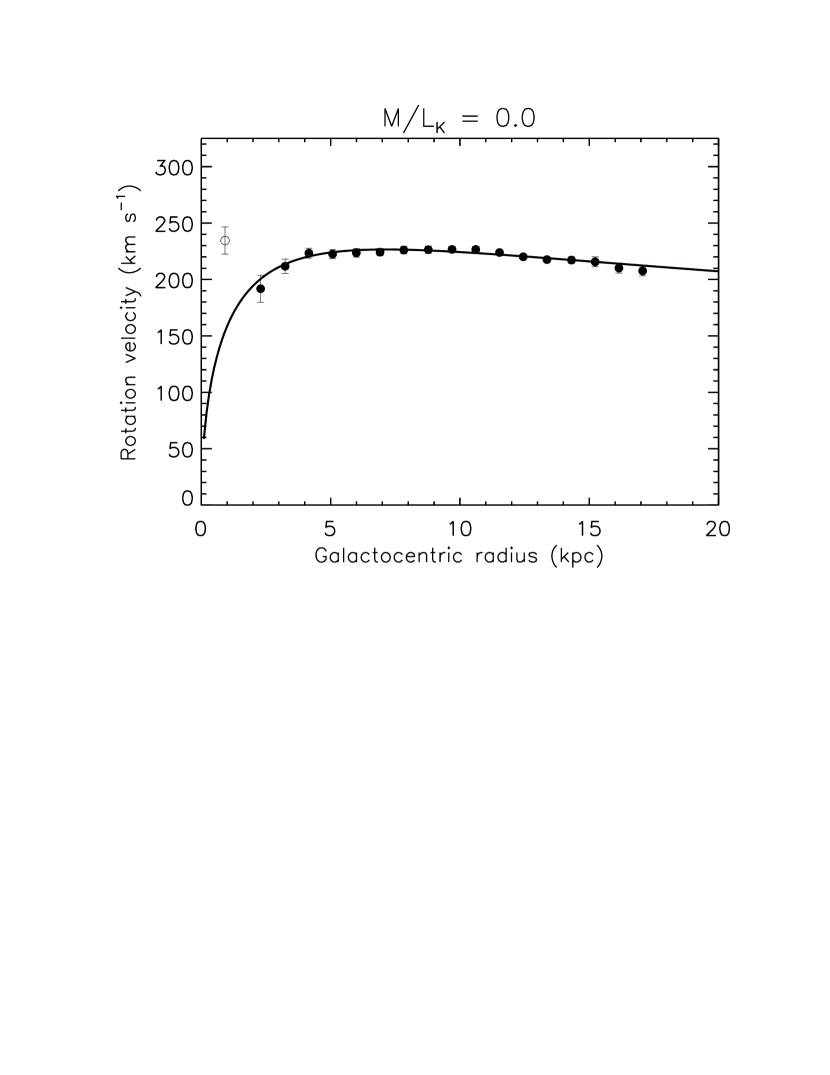
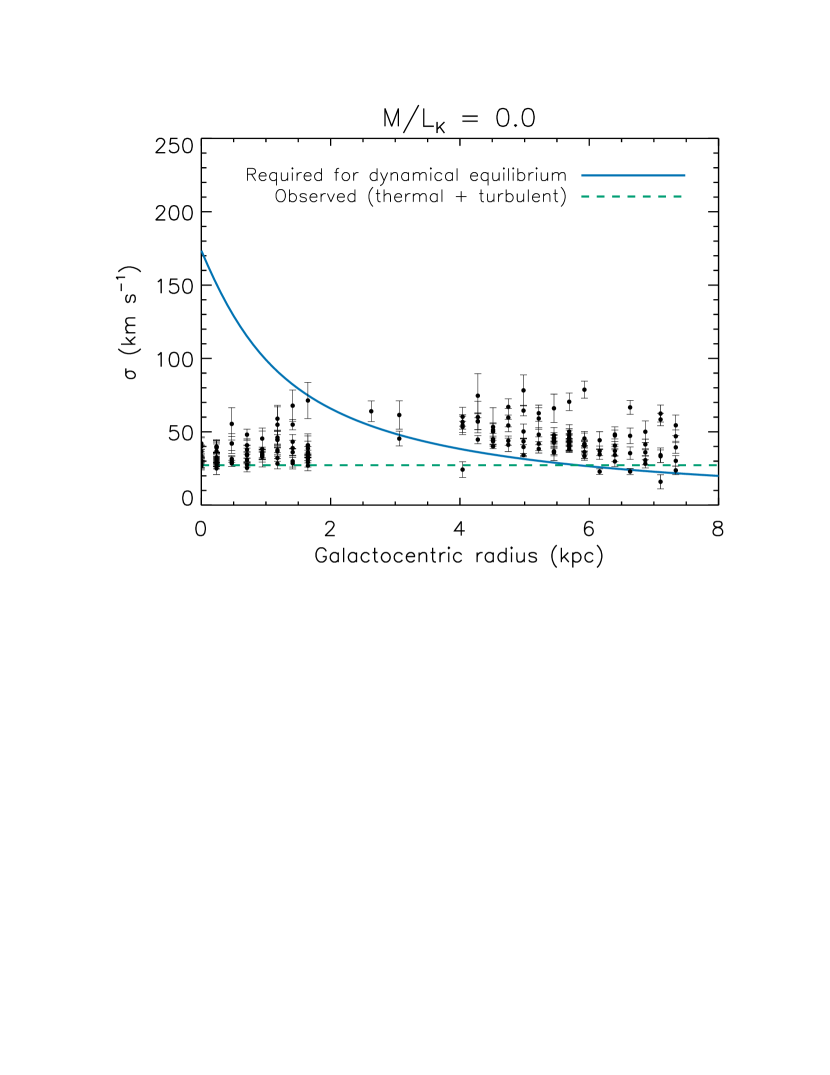
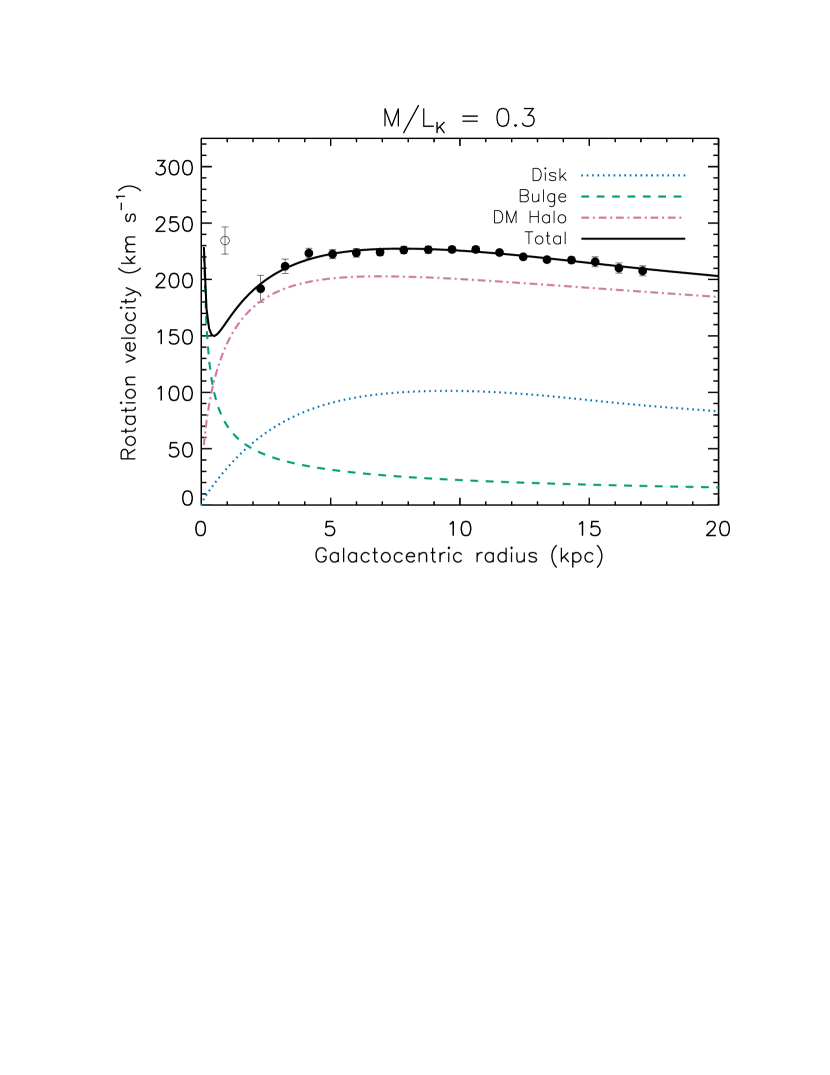
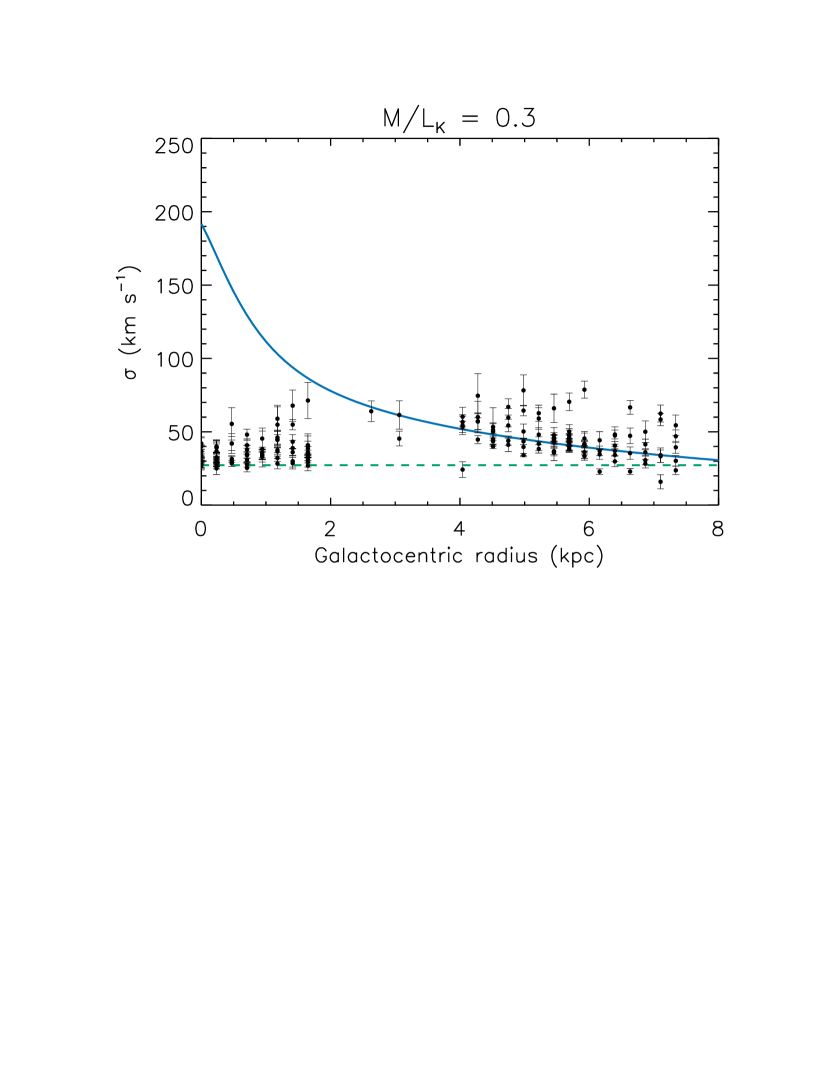
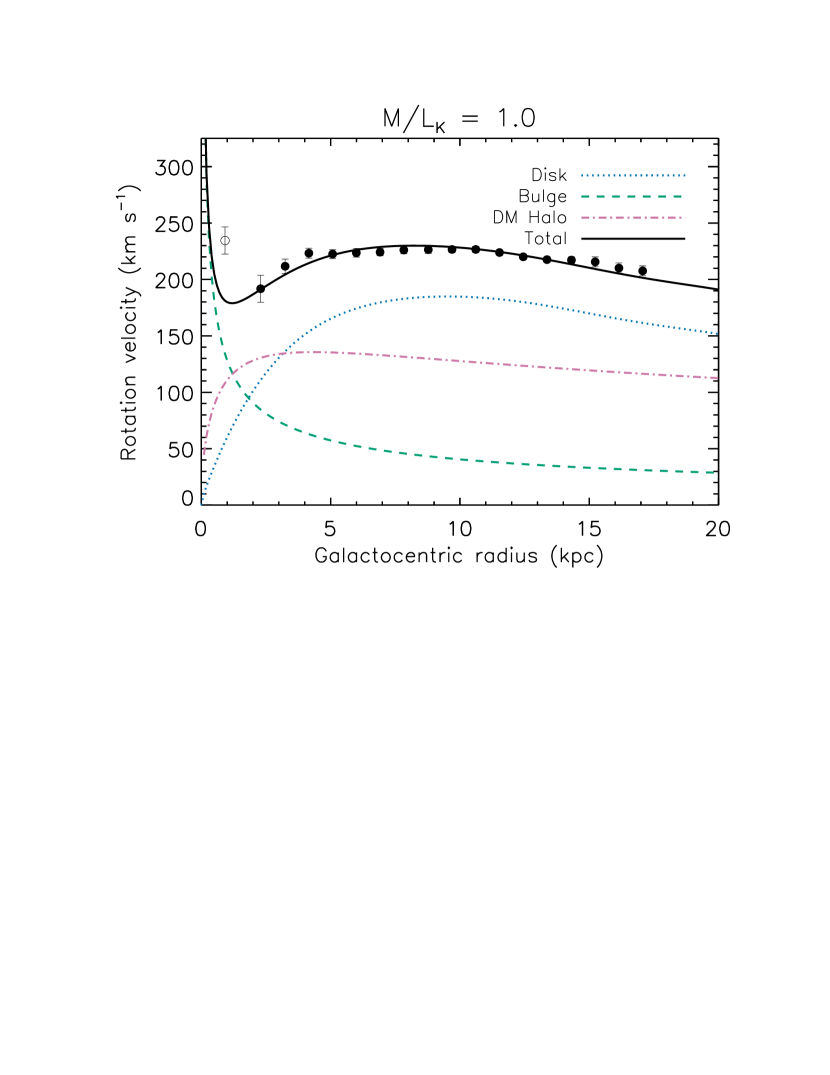
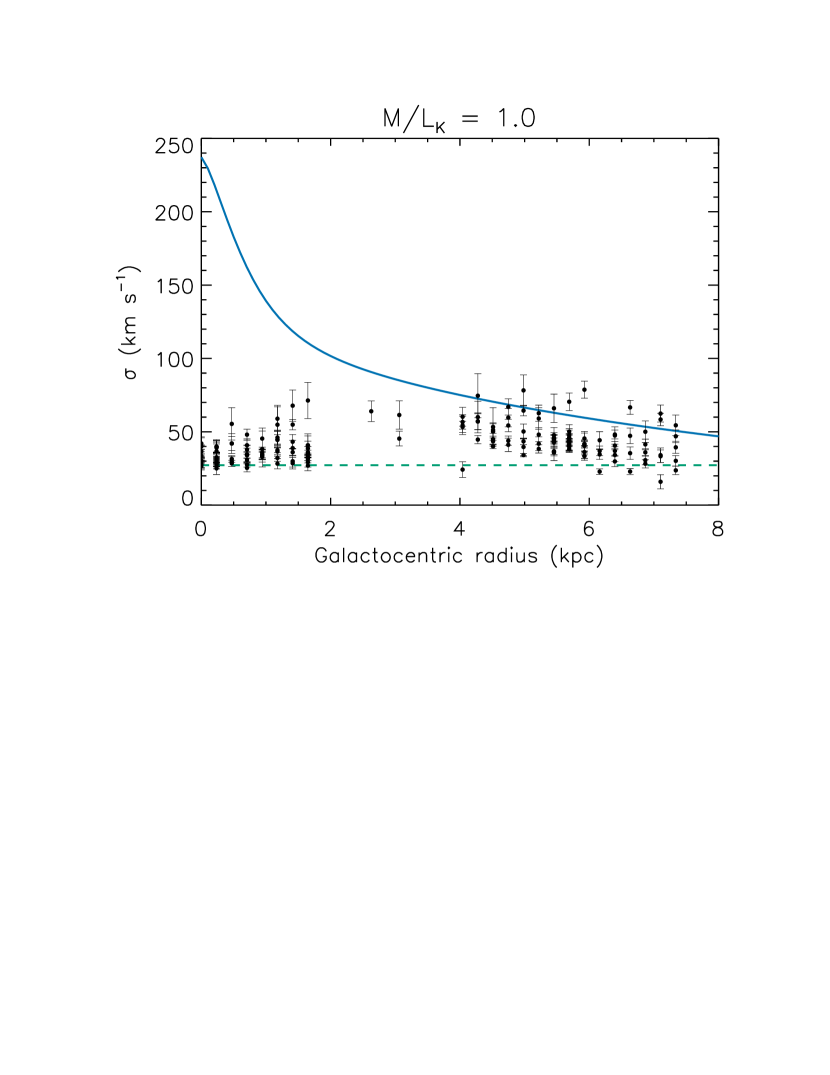
| (kpc) | ( kpc-3) | |
|---|---|---|
| 0.0 | 3.3 | |
| 0.3 | 3.2 | |
| 1.0 | 2.0 |
Note. — The scale radius, , and the central density, , of the NFW dark matter model required to reproduce the HI rotation curve of Fraternali et al. (2011) are given for a range of -band mass-to-light ratios, .
References
- Asseo et al. (1978) Asseo, E., Cesarsky, C. J., Lachieze-Rey, M., & Pellat, R. 1978, ApJ, 225, L21
- Asseo et al. (1980) —. 1980, ApJ, 237, 752
- Barnabè et al. (2006) Barnabè, M., Ciotti, L., Fraternali, F., & Sancisi, R. 2006, A&A, 446, 61
- Beck (2016) Beck, R. 2016, A&A Rev., 24, 4
- Benjamin (2000) Benjamin, R. A. 2000, in Revista Mexicana de Astronomia y Astrofisica Conference Series, Vol. 9, Revista Mexicana de Astronomia y Astrofisica Conference Series, ed. S. J. Arthur, N. S. Brickhouse, & J. Franco, 256–258
- Bershady et al. (2004) Bershady, M. A., Andersen, D. R., Harker, J., Ramsey, L. W., & Verheijen, M. A. W. 2004, PASP, 116, 565
- Bershady et al. (2005) Bershady, M. A., Andersen, D. R., Verheijen, M. A. W., et al. 2005, ApJS, 156, 311
- Beuermann et al. (1985) Beuermann, K., Kanbach, G., & Berkhuijsen, E. M. 1985, A&A, 153, 17
- Binette et al. (2009) Binette, L., Flores-Fajardo, N., Raga, A. C., Drissen, L., & Morisset, C. 2009, ApJ, 695, 552
- Bocchio et al. (2016) Bocchio, M., Bianchi, S., Hunt, L. K., & Schneider, R. 2016, A&A, 586, A8
- Boulares & Cox (1990) Boulares, A., & Cox, D. P. 1990, ApJ, 365, 544
- Bundy et al. (2015) Bundy, K., Bershady, M. A., Law, D. R., et al. 2015, ApJ, 798, 7
- Burkhart et al. (2012) Burkhart, B., Lazarian, A., & Gaensler, B. M. 2012, ApJ, 749, 145
- Burlaga et al. (2013) Burlaga, L. F., Ness, N. F., Gurnett, D. A., & Kurth, W. S. 2013, ApJ, 778, L3
- Ciardullo et al. (1991) Ciardullo, R., Jacoby, G. H., & Harris, W. E. 1991, ApJ, 383, 487
- Collins et al. (2002) Collins, J. A., Benjamin, R. A., & Rand, R. J. 2002, ApJ, 578, 98
- Collins & Rand (2001) Collins, J. A., & Rand, R. J. 2001, ApJ, 551, 57
- Collins et al. (2000) Collins, J. A., Rand, R. J., Duric, N., & Walterbos, R. A. M. 2000, ApJ, 536, 645
- Cuddeford (1993) Cuddeford, P. 1993, MNRAS, 262, 1076
- Dahlem et al. (1994) Dahlem, M., Dettmar, R.-J., & Hummel, E. 1994, A&A, 290
- de Vaucouleurs et al. (1991) de Vaucouleurs, G., de Vaucouleurs, A., Corwin, Jr., H. G., et al. 1991, Third Reference Catalogue of Bright Galaxies. Volume I: Explanations and references. Volume II: Data for galaxies between 0h and 12h. Volume III: Data for galaxies between 12h and 24h. (New York: Springer)
- Dettmar (1990) Dettmar, R.-J. 1990, A&A, 232, L15
- Dettmar et al. (1991) Dettmar, R.-J., Keppel, J. W., Roberts, M. S., & Gallagher, J. S. 1991, in IAU Symposium, Vol. 144, The Interstellar Disk-Halo Connection in Galaxies, ed. H. Bloemen, 295–298
- Draine (2011) Draine, B. T. 2011, Physics of the Interstellar and Intergalactic Medium (Princeton University Press)
- Dumke & Krause (1998) Dumke, M., & Krause, M. 1998, in Lecture Notes in Physics, Berlin Springer Verlag, Vol. 506, IAU Colloq. 166: The Local Bubble and Beyond, ed. D. Breitschwerdt, M. J. Freyberg, & J. Truemper, 555–558
- Ferrara et al. (1996) Ferrara, A., Bianchi, S., Dettmar, R.-J., & Giovanardi, C. 1996, ApJ, 467, L69
- Ferrière (2001) Ferrière, K. M. 2001, Reviews of Modern Physics, 73, 1031
- Flores-Fajardo et al. (2011) Flores-Fajardo, N., Morisset, C., Stasińska, G., & Binette, L. 2011, MNRAS, 415, 2182
- Fosalba et al. (2002) Fosalba, P., Lazarian, A., Prunet, S., & Tauber, J. A. 2002, ApJ, 564, 762
- Franco et al. (1991) Franco, J., Ferrini, F., Barsella, B., & Ferrara, A. 1991, ApJ, 366, 443
- Fraternali & Binney (2006) Fraternali, F., & Binney, J. J. 2006, MNRAS, 366, 449
- Fraternali et al. (2011) Fraternali, F., Sancisi, R., & Kamphuis, P. 2011, A&A, 531, A64
- Gaensler et al. (2008) Gaensler, B. M., Madsen, G. J., Chatterjee, S., & Mao, S. A. 2008, PASA, 25, 184
- Garcia-Burillo & Guelin (1995) Garcia-Burillo, S., & Guelin, M. 1995, A&A, 299, 657
- Garcia-Burillo et al. (1992) Garcia-Burillo, S., Guelin, M., Cernicharo, J., & Dahlem, M. 1992, A&A, 266, 21
- Haffner et al. (1999) Haffner, L. M., Reynolds, R. J., & Tufte, S. L. 1999, ApJ, 523, 223
- Haffner et al. (2003) Haffner, L. M., Reynolds, R. J., Tufte, S. L., et al. 2003, ApJS, 149, 405
- Haffner et al. (2009) Haffner, L. M., Dettmar, R.-J., Beckman, J. E., et al. 2009, Reviews of Modern Physics, 81, 969
- Haffner et al. (2010) Haffner, L. M., Reynolds, R. J., Madsen, G. J., et al. 2010, in Astronomical Society of the Pacific Conference Series, Vol. 438, The Dynamic Interstellar Medium: A Celebration of the Canadian Galactic Plane Survey, ed. R. Kothes, T. L. Landecker, & A. G. Willis, 388
- Heald et al. (2006a) Heald, G. H., Rand, R. J., Benjamin, R. A., & Bershady, M. A. 2006a, ApJ, 647, 1018
- Heald et al. (2007) —. 2007, ApJ, 663, 933
- Heald et al. (2006b) Heald, G. H., Rand, R. J., Benjamin, R. A., Collins, J. A., & Bland-Hawthorn, J. 2006b, ApJ, 636, 181
- Henriksen & Irwin (2016) Henriksen, R. N., & Irwin, J. A. 2016, MNRAS, 458, 4210
- Hill et al. (2008) Hill, A. S., Benjamin, R. A., Kowal, G., et al. 2008, ApJ, 686, 363
- Hill et al. (2012) Hill, A. S., Joung, M. R., Mac Low, M.-M., et al. 2012, ApJ, 750, 104
- Hodges-Kluck & Bregman (2013) Hodges-Kluck, E. J., & Bregman, J. N. 2013, ApJ, 762, 12
- Hoopes et al. (1999) Hoopes, C. G., Walterbos, R. A. M., & Rand, R. J. 1999, ApJ, 522, 669
- Howk & Savage (1997) Howk, J. C., & Savage, B. D. 1997, AJ, 114, 2463
- Howk & Savage (1999) —. 1999, AJ, 117, 2077
- Howk & Savage (2000) —. 2000, AJ, 119, 644
- Irwin et al. (2012) Irwin, J., Beck, R., Benjamin, R. A., et al. 2012, AJ, 144, 43
- Jansson & Farrar (2012) Jansson, R., & Farrar, G. R. 2012, ApJ, 757, 14
- Kamphuis et al. (2007) Kamphuis, P., Peletier, R. F., Dettmar, R.-J., et al. 2007, A&A, 468, 951
- Kamphuis et al. (2013) Kamphuis, P., Rand, R. J., Józsa, G. I. G., et al. 2013, MNRAS, 434, 2069
- Keppel et al. (1991) Keppel, J. W., Dettmar, R.-J., Gallagher, III, J. S., & Roberts, M. S. 1991, ApJ, 374, 507
- Kim & Ryu (2005) Kim, J., & Ryu, D. 2005, ApJ, 630, L45
- Krause (2009) Krause, M. 2009, in Revista Mexicana de Astronomia y Astrofisica, vol. 27, Vol. 36, Revista Mexicana de Astronomia y Astrofisica Conference Series, 25–29
- Kulsrud & Pearce (1969) Kulsrud, R., & Pearce, W. P. 1969, ApJ, 156, 445
- Lehnert & Heckman (1995) Lehnert, M. D., & Heckman, T. M. 1995, ApJS, 97, 89
- Lehnert & Heckman (1996) —. 1996, ApJ, 462, 651
- Li et al. (2016) Li, J.-T., Beck, R., Dettmar, R.-J., et al. 2016, MNRAS, 456, 1723
- Mac Low & McCray (1988) Mac Low, M.-M., & McCray, R. 1988, ApJ, 324, 776
- Mapelli et al. (2008) Mapelli, M., Moore, B., & Bland-Hawthorn, J. 2008, MNRAS, 388, 697
- McGaugh & Schombert (2014) McGaugh, S. S., & Schombert, J. M. 2014, AJ, 148, 77
- Miller & Veilleux (2003a) Miller, S. T., & Veilleux, S. 2003a, ApJS, 148, 383
- Miller & Veilleux (2003b) —. 2003b, ApJ, 592, 79
- Morrison et al. (1997) Morrison, H. L., Miller, E. D., Harding, P., Stinebring, D. R., & Boroson, T. A. 1997, AJ, 113, 2061
- Newcomb (1961) Newcomb, W. A. 1961, Physics of Fluids, 4, 391
- Norman & Ikeuchi (1989) Norman, C. A., & Ikeuchi, S. 1989, ApJ, 345, 372
- Oosterloo et al. (2007) Oosterloo, T., Fraternali, F., & Sancisi, R. 2007, AJ, 134, 1019
- Osterbrock et al. (1996) Osterbrock, D. E., Fulbright, J. P., Martel, A. R., et al. 1996, PASP, 108, 277
- Otte et al. (2002) Otte, B., Gallagher, III, J. S., & Reynolds, R. J. 2002, ApJ, 572, 823
- Otte et al. (2001) Otte, B., Reynolds, R. J., Gallagher, III, J. S., & Ferguson, A. M. N. 2001, ApJ, 560, 207
- Parker (1966) Parker, E. N. 1966, ApJ, 145, 811
- Pildis et al. (1994) Pildis, R. A., Bregman, J. N., & Schombert, J. M. 1994, ApJ, 423, 190
- Popescu et al. (2000) Popescu, C. C., Misiriotis, A., Kylafis, N. D., Tuffs, R. J., & Fischera, J. 2000, A&A, 362, 138
- Popescu et al. (2004) Popescu, C. C., Tuffs, R. J., Kylafis, N. D., & Madore, B. F. 2004, A&A, 414, 45
- Rand (1996) Rand, R. J. 1996, ApJ, 462, 712
- Rand (1997) —. 1997, ApJ, 474, 129
- Rand (1998) —. 1998, ApJ, 501, 137
- Rand et al. (1990) Rand, R. J., Kulkarni, S. R., & Hester, J. J. 1990, ApJ, 352, L1
- Rand et al. (2008) Rand, R. J., Wood, K., & Benjamin, R. A. 2008, ApJ, 680, 263
- Rand et al. (2011) Rand, R. J., Wood, K., Benjamin, R. A., & Meidt, S. E. 2011, ApJ, 728, 163
- Reynolds (1985) Reynolds, R. J. 1985, ApJ, 294, 256
- Reynolds (1991) —. 1991, ApJ, 372, L17
- Reynolds (1993) Reynolds, R. J. 1993, in American Institute of Physics Conference Series, Vol. 278, Back to the Galaxy, ed. S. S. Holt & F. Verter, 156–165
- Reynolds et al. (1998) Reynolds, R. J., Hausen, N. R., Tufte, S. L., & Haffner, L. M. 1998, ApJ, 494, L99
- Rossa & Dettmar (2000) Rossa, J., & Dettmar, R.-J. 2000, A&A, 359, 433
- Rossa & Dettmar (2003a) —. 2003a, A&A, 406, 493
- Rossa & Dettmar (2003b) —. 2003b, A&A, 406, 505
- Rossa et al. (2004) Rossa, J., Dettmar, R.-J., Walterbos, R. A. M., & Norman, C. A. 2004, AJ, 128, 674
- Schechtman-Rook & Bershady (2013) Schechtman-Rook, A., & Bershady, M. A. 2013, ApJ, 773, 45
- Schechtman-Rook & Bershady (2014) —. 2014, ApJ, 795, 136
- Schmidt (2016) Schmidt, P. 2016, PhD thesis, University of Bonn
- Scoville et al. (1993) Scoville, N. Z., Carlstrom, J. E., Chandler, C. J., et al. 1993, PASP, 105, 1482
- Seon et al. (2014) Seon, K.-i., Witt, A. N., Shinn, J.-h., & Kim, I.-j. 2014, ApJ, 785, L18
- Shapiro & Field (1976) Shapiro, P. R., & Field, G. B. 1976, ApJ, 205, 762
- Sofue & Nakai (1993) Sofue, Y., & Nakai, N. 1993, PASJ, 45, 139
- Sokolowski & Bland-Hawthorn (1991) Sokolowski, J., & Bland-Hawthorn, J. 1991, PASP, 103, 911
- Strickland et al. (2004) Strickland, D. K., Heckman, T. M., Colbert, E. J. M., Hoopes, C. G., & Weaver, K. A. 2004, ApJS, 151, 193
- Tufte (1997) Tufte, S. L. 1997, PhD thesis, The University of Wisconsin - Madison
- Tüllmann et al. (2006a) Tüllmann, R., Breitschwerdt, D., Rossa, J., Pietsch, W., & Dettmar, R.-J. 2006a, A&A, 457, 779
- Tüllmann & Dettmar (2000) Tüllmann, R., & Dettmar, R.-J. 2000, A&A, 362, 119
- Tüllmann et al. (2006b) Tüllmann, R., Pietsch, W., Rossa, J., Breitschwerdt, D., & Dettmar, R.-J. 2006b, A&A, 448, 43
- van der Kruit (1984) van der Kruit, P. C. 1984, A&A, 140, 470
- van Dokkum (2001) van Dokkum, P. G. 2001, PASP, 113, 1420
- Veilleux et al. (2005) Veilleux, S., Cecil, G., & Bland-Hawthorn, J. 2005, ARA&A, 43, 769
- Voigtländer et al. (2013) Voigtländer, P., Kamphuis, P., Marcelin, M., Bomans, D. J., & Dettmar, R.-J. 2013, A&A, 554, A133
- Wainscoat et al. (1987) Wainscoat, R. J., de Jong, T., & Wesselius, P. R. 1987, A&A, 181, 225
- Wiegert et al. (2015) Wiegert, T., Irwin, J., Miskolczi, A., et al. 2015, AJ, 150, 81
- Wiener et al. (2013) Wiener, J., Zweibel, E. G., & Oh, S. P. 2013, ApJ, 767, 87
- Zweibel (2013) Zweibel, E. G. 2013, Physics of Plasmas, 20, 055501
- Zweibel & Kulsrud (1975) Zweibel, E. G., & Kulsrud, R. M. 1975, ApJ, 201, 63