Polar Kerr Effect from Time Reversal Symmetry Breaking in the Heavy Fermion Superconductor PrOs4Sb12
Abstract
We present polar Kerr effect measurements of the filled skutterudite superconductor PrOs4Sb12. Simultaneous AC susceptibility measurements allow us to observe the superconducting transition under the influence of heating from the optical beam. A nonzero Kerr angle develops below the superconducting transition, saturating at nrad at low temperatures. This result is repeated across several measurements of multiple samples. By extrapolating the measured to zero optical power, we are able to show that the Kerr angle onset temperature in one set of measurements is consistent with the transition to the B phase at . We discuss the possible explanations for this result and its impact on the understanding of multi-phase and inhomogeneous superconductivity in PrOs4Sb12.
Chiral superconducting phases exhibited by certain heavy fermion (HF) materials have recently attracted heightened interest as hosts for Majorana particles and other topologically ordered states Chakravarty and Hsu (2015); Kallin and Berlinsky (2016); Sato and Fujimoto (2016). Of these, the filled skutterudite PrOs4Sb12 has been proposed as a leading candidate for hosting three-dimensional Majorana fermions Kozii et al. (2016). PrOs4Sb12, currently the only known Pr-based HF-superconductor Bauer et al. (2002), exhibits many interesting phenomena Maple et al. (2006), including a field-induced ordered state Aoki et al. (2002) and two zero-field superconducting transitions, corresponding to an A phase with K, and a B phase with K Izawa et al. (2003); Vollmer et al. (2003). Past experiments have suggested that quadrupolar order and fluctuations may be the basis of all these phases Bauer et al. (2002); Maple et al. (2006); Aoki et al. (2007). Theoretical models posit that such a quadrupolar superconducting state breaks time-reversal symmetry (TRS) and that the double transition arises from spin-orbit coupling Miyake et al. (2003). A muon spin relaxation study of PrOs4Sb12 showed evidence of TRS breaking (TRSB) appearing around the superconducting transition, thus suggesting that the superconductivity is chiral, but could not resolve whether TRSB was associated with the A phase or B phase Aoki et al. (2003). Whether these transitions are even distinct, and what are the possible symmetries allowed for this compound, are subjects of considerable debate Maple et al. (2006); Méasson et al. (2006); Seyfarth et al. (2006); Aoki et al. (2007). There is strong evidence of inhomogeneity in the superconducting state; furthermore, reducing the size of a crystal below m in any dimension eliminates the transition at Méasson et al. (2008); Andraka and Pocsy (2012). This raises the possibility that the “two phases” are just ordinary transitions of two different materials in the same sample. However, this inhomogeneity may simply indicate that the A phase is delicate, and requires a large crystal to exist—in this case, an inhomogeneous crystal would be composed of regions which support both A and B phases, combined with regions supporting only the B phase. This argument is bolstered by evidence that powdering the material (i. e. introducing defects and impurities) suppresses the upper transition McBriarty et al. (2009). In order to clear up this controversy, it is thus crucial to determine the exact TRS of the superconducting state below and between and .
In this Letter we report polar Kerr effect measurements of several PrOs4Sb12 crystals along the [001] direction using a zero-area loop Sagnac interferometer (ZALSI). In-situ AC susceptibility measurements allow us to track the two superconducting transitions with the optical beam incident and thus accurately account for optical heating. We find a finite Kerr angle, saturating at nrad at low temperature, which develops below the superconducting transition temperature after the sample has been cooled in a small symmetry-breaking magnetic field. When cooled in zero field, the sample develops a Kerr angle with random sign and magnitude (also saturating at nrad), indicating the formation of TRSB domains with random direction. By measuring (on one sample) the power dependence of the temperature at which the Kerr angle onsets, we are able to extrapolate to the true onset temperature of TRSB in the limit of no sample heating. We find the onset temperature is consistent only with . We measure several other spots on multiple samples, finding results which are consistent with this power dependence. We take this to indicate that PrOs4Sb12 has a TRSB superconducting state below , which may be the B phase of a multi-phase superconductor.
In general, a TRSB order parameter with particle-hole asymmetry will lead to complex indices of refraction for right-circular () and left-circular () polarizations that are unequal and depend on the direction of propagation of light Sauls (1994). This generates a small but finite polar Kerr effect (PKE), wherein circularly polarized light reflected from a TRSB material is phase-shifted by the Kerr angle , with the sign of depending on the direction of polarization. For a multiband, TRSB superconductor with K measured with m light, we expect rad Ord . Such a small PKE may be resolved using a ZALSI as described previously Xia et al. (2006a); Kapitulnik et al. (2009a). Our ZALSI apparatus, operating at m, yields a finite only if TRS is broken, while rejecting any reciprocal effects that may happen to rotate polarization. Since if reciprocity holds the PKE is identically zero Kapitulnik (2015), a finite PKE is an unambiguous determination of TRSB in any material system, including unconventional superconductors. Indeed, we have used ZALSI in the past to detect TRSB in Sr2RuO4 and in the HF-superconductors URu2Si2 Schemm et al. (2015) and UPt3 Schemm et al. (2014). Importantly, the ZALSI has also ruled out TRSB in the HF-superconductor CeCoIn5 Schemm et al. (2017), in mirrors Xia et al. (2006b), and in high- cuprates Kapitulnik et al. (2009b).
We measured 5 samples in total, labeled samples A through E. These ranged in size from approximately mm mm thick to approximately mm mm thick. The single crystals of PrOs4Sb12 were grown in an Sb flux as described in Ref. Bauer et al. (2001); all samples except B were from the same growth batch, grown under identical conditions, and were measured on as-grown (100) surfaces. X-ray diffraction measurements Bauer et al. (2002) on PrOs4Sb12 reveal that it crystallizes in the LaFe4P12-type BCC structure with a lattice parameter ÅBraun and Jeitschko (1980). These crystals typically have a residual resistivity ratio RRR 300 K2 K Bauer et al. (2002); Maple et al. (2006); Frederick and Maple (2003). A sample is attached to a thin sapphire wafer on top of a copper stage that is mounted on the base plate of our 3He refrigerator. The optical beam from the Sagnac interferometer comes down from above and reflects off the top of the sample. The mutual inductance (MI) apparatus for measuring AC susceptibility consists of an astatically-wound pickup coil inside a drive coil just underneath the sample, as shown in the inset of Fig. 1. We drive the outer coil at kHz and measure the induced voltage in the pickup. The pickup coil is nominally balanced to provide zero signal when the sample susceptibility is zero and finite signal when is finite. In practice there is always some background signal; we measure this offset well above and subtract it from our data. We measure with the optical beam on, thus determining the effect of sample heating from our optical measurement.
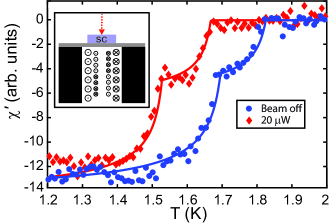
PKE measurements of PrOs4Sb12 proved challenging because of the low reflectivity at the measurement wavelength (m). Signal to noise ratio (SNR) could be increased by increasing optical power, which in turn resulted in heating of the sample. To get reliable data in the limit of low optical power we measured PKE at different powers and the compared the data to AC susceptibility data taken at the same optical powers. AC susceptibility measurements of sample A under illumination at different optical powers are shown in Fig. 1. With the optical beam off, we observe two transitions in the real component of the susceptibility beginning at 1.83 K and 1.7 K. These temperatures are consistent with and from previously reported measurements of PrOs4Sb12 Maple et al. (2006); Aoki et al. (2007). With the optical beam on, both transitions shift to lower temperature (as measured by a RuOx thermometer mounted to the sample stage away from the beam). This indicates that the sample is heated by the beam and thus sits at higher temperature than the stage. The double-transition shape of the curve remains unchanged, although at high powers a hint of the transition at 1.83 K may be seen, presumably due to uneven thermalization of the sample due to the focused heating spot. It is the temperature of this spot that is relevant for our analysis, as the PKE measurement samples over the volume that the beam interacts with.
To fit the MI data, we use the canonical susceptibility of a cylinder in a parallel field,
where is the cylinder radius, is the penetration depth, and are the modified Bessel functions Brandt (1998). We sum the susceptibilities due to two superconducting states, , using a phenomenological temperature dependence for penetration depths
The exact shape of these fits seems unimportant, as the values extracted do not depend strongly on the choice of functional form; however, a two-transition fit is necessary to capture the shape of the data. The values extracted from fitting agree with estimates “by eye” of the beginnings of the transitions. We may thus use these temperatures to determine what state the sample is in at a given temperature for the Kerr measurements. We note that this functional form, which sums susceptibilities, seems to imply inhomogeneity as the source of the two transitions. However, similar curve shapes and values of are generated by models that assume two phases with different ’s Khasanov et al. (2007).
PKE measurements were performed with no MI drive to prevent any spurious effects from the AC magnetic field. The measurement procedure is thus: the sample is warmed far above the , typically to 4 K. After a short wait for thermalization, a small DC magnetic field may be applied, or the field may be left at zero. The sample is then cooled to base temperature ( mK) and the field is set to 0 (remnant field in the absence of applied field is mG Schemm et al. (2015), well below Oe Cichorek et al. (2005)). Finally, the sample is warmed slowly and PKE measurements are performed during warm-up.
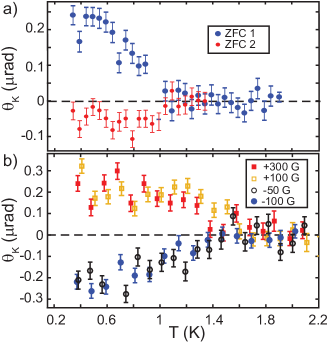
PKE data taken on sample E after two different zero field cooldowns at W incident power are shown in Fig. 2(a). One run shows a positive signal saturating around 250 nrad, while the other shows a negative signal of roughly 50 nrad. Several ZFC runs taken on multiple samples showed Kerr angles with random sign and amplitude. This behavior, together with the field-cooled measurements discussed below, suggest that we observe the effect of finite domain structure. Similar to a finite-size ferromagnet, the TRSB sample may break into domains that are smaller than the gaussian waist of our optical beam. In this case the average signal is expected to be zero, with a standard deviation reflecting the ratio of domain width to beam waist Xia et al. (2006b). Occasionally a large domain may form under the beam, leading to a finite signal, but this measurement would not be repeatable. We observe exactly this behavior.
Again as in a ferromagnet, the sample can be trained to form a single domain by cooling through the TRSB transition in a symmetry-breaking magnetic field aligned with the optical beam Xia et al. (2006b). It is important to note, however, that the field is removed at low temperature, and all data are taken while warming up in zero field. Data taken at W optical power after cooling sample C in field are shown in Fig. 2(b). A nonzero develops below K at all fields, and saturates at nrad at low temperature. The sign of reverses with the field direction, as would be expected for trained TRSB. The magnitude of shows no field dependence, indicating that vortex cores are likely not the source of the signal and that a 50 G field fully trains the sample.
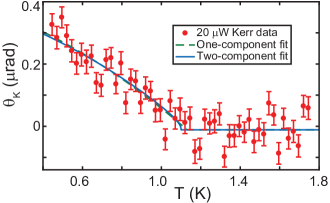
In order to accurately extract the temperature at which becomes nonzero (i. e. at which TRSB begins) we fit the data. An example, using W data on sample E, is shown in Fig. 3. We use two phenomenological models for these fits. The first (dashed green line) assumes a single component to the order parameter:
Here, is the optical spot heating, so the measured is given by . Either or may be used; the values extracted are nearly identical. The second model (solid blue line) assumes two components to the order parameter, i. e. two critical temperatures:
Both equations fit the data well, although the two-component fit gives a smaller confidence interval for and usually has larger R-square. The one-component fit gives K, while the two-component fit gives K (error bars represent 95% confidence intervals). These values are lower than the temperatures of both MI transitions (measured to be 1.672 and 1.528 K at this power); this is to be expected in the presence of optical heating, as the Kerr measurement samples only the volume heated by the optical beam while the MI measurement measures the entire sample. A finite-element model of optical heating gives a “hot spot” which is mK hotter than the bulk crystal, consistent with our results.
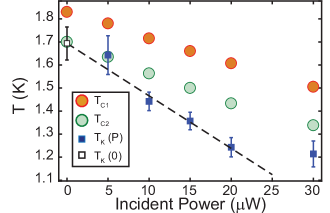
In order to determine the true value of (in the absence of heating) we measure Kerr data at different incident optical powers () and extract from two-component fits as above. At low powers the SNR of our measurement is too low to consistently fit for . However, since field-trained data is repeatable with the same amplitude and onset temperature, we may fit several data sets simultaneously to improve SNR. We then fit , weighted by the confidence interval of each extracted value, to find . Fit procedure details may be found in the Supplementary Material sup . Results for sample C are shown in Fig. 4, along with measured MI transition temperatures at each power. We fit a linear dependence to from to W; at the highest power, W, we expect a deviation from linear dependence as the thermal conductivities of the sample and stage have changed significantly, and the heating is sufficiently large that the Kerr data is not well-fit by the same functions. The linear fit gives K. These error bars represent 95% confidence bounds sup . Thus, we see that becomes nonzero at a temperature consistent with K and inconsistent (at the 3.8- level) with K. Repeating this procedure with one-component fits gives K, which again is more consistent with , although is just barely within the 2- window.
In order to test whether at all points—i. e. to test whether inhomogeneities lead to any regions where TRSB begins at —we measured 8 different spots across 3 samples (A, C, and E) sam . Because measuring dependence is extremely time-consuming, we instead measured at W and extracted the difference between the measured and at that power. This difference should depend only on the thermal conductivity of the sample and the size of the optical spot (assumed to be very similar for all samples); therefore should be constant for all measurements if is the same. We find that this value agrees in 6 of the measurements sup , indicating that ; the other 2 measurements were inconclusive due to spurious signals that corrupted the data and made fitting unreliable. We take this as moderate evidence that the superconducting states entered at and have different TRS, likely indicating multiphase superconductivity.
However, we have not fully ruled out inhomogeneities as the source of the multiple transitions. It is possible that the transition only occurs inside a crystal, and that the surface only becomes superconducting at –indeed, the fact that reducing crystal size eliminates the upper transition would point to this possibility. Our measurement only probes down to the optical penetration depth ( nm), and so is unable to determine if this is the case. In order to fully correlate the TRS and of the superconducting states, a measurement of at the optical spot is needed. This could be accomplished using a scanning probe de Lozanne (1999), a SQUID susceptometer Gardner et al. (2001), or by measuring optical properties such as thermoreflectance. Future experiments should focus on correlating and across many regions of a sample.
In conclusion, we have found a finite polar Kerr effect below in PrOs4Sb12. The random PKE after cooling in zero field, together with a finite PKE after cooling in a small magnetic field, suggest that time-reversal symmetry is broken in PrOs4Sb12, with typical domain size that is smaller than our m optical spot. This finding puts strong constraints on the possible symmetries allowed to describe the superconducting state in this material system. Further study is necessary to investigate the role of inhomogeneities and determine whether the two superconducting transitions are truly distinct.
Acknowledgements.
We thank Daniel Agterberg and Liang Fu for useful discussions. Single crystal growth and characterization at UCSD was supported by the US Department of Energy, Office of Basic Energy Sciences, Division of Materials Sciences and Engineering, under Grant No. DEFG02-04-ER46105. Kerr effect measurements at Stanford were supported under Department of Energy Contract No. DE-AC02-76SF00515.References
- Chakravarty and Hsu (2015) S. Chakravarty and C.-H. Hsu, Modern Physics Letters B 29, 1540053 (2015).
- Kallin and Berlinsky (2016) C. Kallin and J. Berlinsky, Reports on Progress in Physics 79, 054502 (2016).
- Sato and Fujimoto (2016) M. Sato and S. Fujimoto, J. Phys. Soc. Jpn. (2016).
- Kozii et al. (2016) V. Kozii, J. W. F. Venderbos, and L. Fu, (2016), arXiv:1607.08243 .
- Bauer et al. (2002) E. D. Bauer, N. A. Frederick, P.-C. Ho, V. S. Zapf, and M. B. Maple, Phys. Rev. B 65, 100506 (2002).
- Maple et al. (2006) M. B. Maple, N. A. Frederick, P.-C. Ho, W. M. Yuhasz, and T. Yanagisawa, Journal of Superconductivity and Novel Magnetism 19, 299 (2006).
- Aoki et al. (2002) Y. Aoki, T. Namiki, S. Ohsaki, S. R. Saha, H. Sugawara, and H. Sato, Journal of the Physical Society of Japan 71, 2098 (2002).
- Izawa et al. (2003) K. Izawa, Y. Nakajima, J. Goryo, Y. Matsuda, S. Osaki, H. Sugawara, H. Sato, P. Thalmeier, and K. Maki, Phys. Rev. Lett. 90, 117001 (2003).
- Vollmer et al. (2003) R. Vollmer, A. Faißt, C. Pfleiderer, H. v. Löhneysen, E. D. Bauer, P.-C. Ho, V. Zapf, and M. B. Maple, Phys. Rev. Lett. 90, 057001 (2003).
- Aoki et al. (2007) Y. Aoki, T. Tayama, T. Sakakibara, K. Kuwahara, K. Iwasa, M. Kohgi, W. Higemoto, D. E. MacLaughlin, H. Sugawara, and H. Sato, Journal of the Physical Society of Japan 76, 051006 (2007).
- Miyake et al. (2003) K. Miyake, H. Kohno, and H. Harima, Journal of Physics: Condensed Matter 15, L275 (2003).
- Aoki et al. (2003) Y. Aoki, A. Tsuchiya, T. Kanayama, S. R. Saha, H. Sugawara, H. Sato, W. Higemoto, A. Koda, K. Ohishi, K. Nishiyama, and R. Kadono, Phys. Rev. Lett. 91, 067003 (2003).
- Méasson et al. (2006) M.-A. Méasson, D. Braithwaite, B. Salce, J. Flouquet, G. Lapertot, J. Pécaut, G. Seyfarth, J.-P. Brison, H. Sugawara, and H. Sato, Physica B: Condensed Matter 378–380, 56 (2006), proceedings of the International Conference on Strongly Correlated Electron Systems.
- Seyfarth et al. (2006) G. Seyfarth, J. P. Brison, M.-A. Méasson, D. Braithwaite, G. Lapertot, and J. Flouquet, Phys. Rev. Lett. 97, 236403 (2006).
- Méasson et al. (2008) M.-A. Méasson, D. Braithwaite, G. Lapertot, J.-P. Brison, J. Flouquet, P. Bordet, H. Sugawara, and P. C. Canfield, Phys. Rev. B 77, 134517 (2008).
- Andraka and Pocsy (2012) B. Andraka and K. Pocsy, Journal of Applied Physics 111, 07E115 (2012).
- McBriarty et al. (2009) M. E. McBriarty, P. Kumar, G. R. Stewart, and B. Andraka, Journal of Physics: Condensed Matter 21, 385701 (2009).
- Sauls (1994) J. Sauls, Advances in Physics 43, 113 (1994).
- (19) Currently the two known scenarios that result in a finite Kerr effect in a TRSB superconductor require either Magnetic scattering or interband coupling. See discussion in Kapitulnik (2015) and references therein.
- Xia et al. (2006a) J. Xia, Y. Maeno, P. T. Beyersdorf, M. M. Fejer, and A. Kapitulnik, Phys. Rev. Lett. 97, 167002 (2006a).
- Kapitulnik et al. (2009a) A. Kapitulnik, J. Xia, and E. Schemm, Physica B: Condensed Matter 404, 507 (2009a).
- Kapitulnik (2015) A. Kapitulnik, Physica B-Condensed Matter 460, 151 (2015).
- Schemm et al. (2015) E. R. Schemm, R. E. Baumbach, P. H. Tobash, F. Ronning, E. D. Bauer, and A. Kapitulnik, Phys. Rev. B 91, 140506 (2015).
- Schemm et al. (2014) E. R. Schemm, W. J. Gannon, C. M. Wishne, W. P. Halperin, and A. Kapitulnik, Science 345, 190 (2014).
- Schemm et al. (2017) E. Schemm, E. Levenson-Falk, and A. Kapitulnik, Physica C: Superconductivity and its Applications 535, 13 (2017).
- Xia et al. (2006b) J. Xia, P. T. Beyersdorf, M. M. Fejer, and A. Kapitulnik, Appl. Phys. Lett. 89 (2006b).
- Kapitulnik et al. (2009b) A. Kapitulnik, J. Xia, E. Schemm, and A. Palevski, New Journal of Physics 11 (2009b).
- Bauer et al. (2001) E. D. Bauer, A. Slebarski, E. J. Freeman, C. Sirvent, and M. B. Maple, Journal of Physics: Condensed Matter 13, 4495 (2001).
- Braun and Jeitschko (1980) D. Braun and W. Jeitschko, Journal of the Less Common Metals 72, 147 (1980).
- Frederick and Maple (2003) N. A. Frederick and M. B. Maple, Journal of Physics: Condensed Matter 15, 4789 (2003).
- Brandt (1998) E. H. Brandt, Phys. Rev. B 58, 6523 (1998).
- Khasanov et al. (2007) R. Khasanov, S. Strässle, D. Di Castro, T. Masui, S. Miyasaka, S. Tajima, A. Bussmann-Holder, and H. Keller, Phys. Rev. Lett. 99, 237601 (2007).
- Cichorek et al. (2005) T. Cichorek, A. C. Mota, F. Steglich, N. A. Frederick, W. M. Yuhasz, and M. B. Maple, Phys. Rev. Lett. 94, 107002 (2005).
- (34) See supplementary material, which includes Refs. mul ; York et al. (2004).
- (35) Samples B and D were measured only at high power (38 W). Both showed TRSB, but cannot be included in this analysis due to the absence of 20 W data. Data on these samples is included in the Supplementary Material.
- de Lozanne (1999) A. de Lozanne, Superconductor Science and Technology 12, R43 (1999).
- Gardner et al. (2001) B. W. Gardner, J. C. Wynn, P. G. Björnsson, E. W. J. Straver, K. A. Moler, J. R. Kirtley, and M. B. Ketchen, Review of Scientific Instruments 72, 2361 (2001), http://dx.doi.org/10.1063/1.1364668 .
- (38) See https://www.mathworks.com/matlabcentral/fileexchange/40613-multiple-curve-fitting-with-common-parameters-using-nlinfit.
- York et al. (2004) D. York, N. M. Evensen, M. L. Martı́nez, and J. D. B. Delgado, American Journal of Physics 72, 367 (2004), https://doi.org/10.1119/1.1632486 .