33email: bruno.arsioli@asdc.asi.it
Searching for -ray signature in WHSP blazars:
Abstract
Aims. A direct search of -ray emission centered on multi-frequency selected candidates is a valuable complementary approach to the standard search adopted in current -ray Fermi-LAT catalogs. Our sources are part of the 2WHSP sample that was assembled with the aim of providing targets for Imaging Atmospheric Cherenkov Telescopes (IACT). A likelihood analysis based on their known position enabled us to detect 150 -ray excess signals that have not yet been reported in previous -ray catalogs (1FGL, 2FGL, 3FGL). By identifying new sources, we solve a fraction of the extragalactic isotropic -ray background (IGRB) composition, improving the description of the -ray sky.
Methods. We perform data reduction with the Fermi Science Tools using positions from 400 high synchrotron peaked (HSP) blazars as seeds of tentative -ray sources; none of them have counterparts from previous 1FGL, 2FGL and 3FGL catalogs. Our candidates are part of the 2WHSP sample (currently the largest set of HSP blazars). We focus on HSPs characterised by bright synchrotron component with peak flux ergs/cm2/s, testing the hypothesis of having a -ray source in correspondence to the WHSP positions. Our likelihood analysis considers the 0.3-500 GeV energy band, integrating over 7.2 yrs of Fermi-LAT observation and making use of the Pass 8 data release.
Results. From the 400 candidates tested, a total of 150 2WHSPs showed excess -ray signature: 85 high-significance detections with test statistic (TS)25, and 65 lower-significance detections with TS between 10 to 25. We assume a power law spectrum in the 0.3-500 GeV band and list in Table Searching for -ray signature in WHSP blazars: the spectrum parameters describing all 150 new -ray sources. We study the -ray photon spectral index distribution, the likelihood of detection according to the synchrotron peak brightness (figure of merit parameter), and plot the measured -ray LogN-LogS of HSP blazars, also discussing the portion of the IGRB that has been resolved by the present work. We also report on four cases where we could resolve source confusion and find counterparts for unassociated 3FGL sources with the help of high-energy TS maps together with multi-frequency data. The 150 new -ray sources are named with the acronym 1BIGB for the first version of the Brazil ICRANet Gamma-ray Blazar catalog, in reference to the cooperation agreement supporting this work.
Key Words.:
galaxies: active – BL Lacertae objects: general – Radiation mechanisms: non-thermal – Gamma rays: diffuse background – Gamma rays: General1 Introduction
Catalogs of -ray sources currently compiled by the Fermi-LAT team are based on -ray data only, and their standard detection method is blind with respect to information coming from other wavelengths. This approach is clean and unbiased with respect to any class of potential -ray emitters. However, there are populations of astrophysical objects that are now known to emit -rays, and the knowledge of their position in the sky can be used to facilitate the detection and identification of new -ray sources. Based on this principal, we select a sample of candidates to be used as seeds for a direct search of -ray signatures using likelihood analysis with the Fermi Science Tools.
Blazars are the most abundant -ray sources in the latest Fermi-LAT 3FGL catalog, being 1147 (660 BL Lacs and 487 Flat Spectrum Radio Quasars - FSRQ) of the total 3034 (Acero et al., 2015). Even so, one third of the known blazars from 5BZcat111The 5BZcat (Massaro et al., 2015) is a large sample of 3 561 identified blazars. Multi-frequency data for the 5BZcat is available at http://www.asdc.asi.it/bzcat with a direct link to the SED-builder tool. are not confirmed as -ray emitters. Probably many of them are faint -ray sources that are hard to identify by automatic search methods only based on Fermi-LAT data. The blazar population has been extensively studied by means of a multi-frequency approach considering dedicated databases on radio, microwave, infra-red (IR), optical, ultra-violet (UV), and X-ray, since they are characterised by radiation emission extending along the whole electromagnetic spectrum, up to TeV energies.
A particular family of extreme sources with the synchrotron component peaking at frequencies larger than 1015 Hz is classified as a high synchrotron peak blazar (HSP, Padovani & Giommi, 1995; Abdo et al., 2010) and is the dominant population associated with extragalactic very high-energy (VHE: E0.1 TeV, Rieger et al., 2013) sources in the 2nd Catalog of Hard Fermi-LAT Sources (2FHL, Ackermann et al., 2016b). Therefore, HSPs constitute a key population for the detection of point-like -ray sources within Fermi-LAT data.
A large sample of HSP blazars was recently assembled using a multi-frequency selection procedure that exploits the unique features of their spectral energy distribution (SED). This sample is known as the 1WHSP catalog (Arsioli et al., 2015) and was built using a primary source-selection based on IR colours (following Massaro et al., 2011), later demanding all potential candidates to have a radio, IR and X-ray counterpart. The sources had to satisfy broadband spectral slope criteria (from radio to X-rays) that were fine-tuned to match the SED of typical HSP blazars. In addition, their multi-frequency SEDs were inspected individually using the SED-builder tool (http://www.asdc.asi.it) fitting the synchrotron component with a third degree polynomial to determine the parameter, only keeping cases with Hz. The catalog name “WHSP” stands for WISE High Synchrotron Peak blazars, since all sources have an IR counterpart from the WISE mission (Wright et al., 2010), which defines their positions. The 1WHSP catalog includes 992 objects at Galactic latitude . A total of 299 1WHSPs have a confirmed -ray counterpart in 1FGL, 2FGL and 3FGL (Arsioli et al., 2015), but many HSPs with bright synchrotron peak are still not detected/confirmed in the -ray band.
Given the importance of finding new HSP blazars, an extension of the 1WHSP sample (the 2WHSP, Chang et al., 2016) has ben assembled. It considers sources located at latitudes as low as with a total of 1 693 sources, 439 of which have counterparts within the error circles from the 3FGL catalog. The 2WHSP sample avoids the selection based on IR colours that was used as a primary step for the 1WHSP catalog. This brings an overall improvement in completeness222 Also to improve the completeness of the final sample, known HSP sources at 10∘ were incorporate in the 2WHSP catalog., since some HSP blazars were out of the 1WHSP sample owing to the contamination of IR colours by the elliptical-galaxy thermal emission. Compared to the 1WHSP, the 2WHSP sample incorporates extra X-ray catalogs like Einstein IPC, IPC slew and Chandra (Harris et al., 1993; Elvis et al., 1992; Evans et al., 2010) as well as updated versions from 3XMM-DR5 and XMM-slew catalogs (Rosen et al., 2015; Saxton et al., 2008). In addition, Swift-XRT alone performed a series of 160 new X-ray observation of WHSP sources (enabling us to better estimate synchrotron peak parameters) and an extensive study of X-ray extended sources helped to avoid contamination with spurious objects (more details are given by Chang et al. (2016)). The catalogs are available at: www.asdc.asi.it/1whsp or /2whsp; where multi-frequency SEDs can be quickly built using open access online tools. Since the 2WHSP catalog supersedes the 1WHSP (with improved selection and better estimate of synchrotron peak parameters), from now on we only refer to the 2WHSP sample.
2 Brightness of the synchrotron peak and detectability by Fermi-LAT
The HSP blazars are characterised by hard -ray spectrum with average photon index =1.850.01 (Arsioli et al., 2015; Ackermann et al., 2011, 2015b) favouring their detection in the high-energy band. Therefore, the 2WHSP catalog has collected an unprecedented number of remarkably rare and extreme sources that are expected to emit -rays.
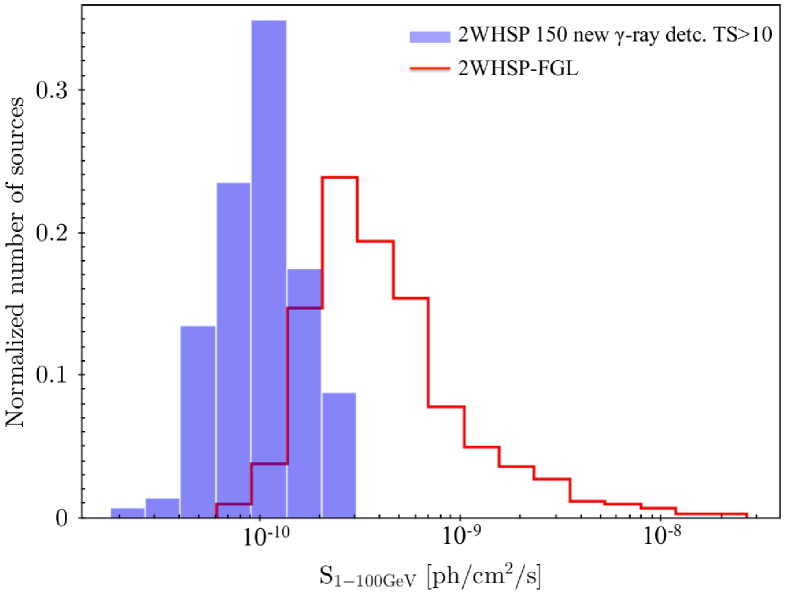
In Fig. 1 we plot the distribution of synchrotron peak fluxes (f) for the 2WHSP detected333 We may use 2WHSP-FGL when referring to the subsample of 439 2WHSPs that have counterparts from the 1FGL, 2FGL, and 3FGL catalogs. and undetected -ray sources. As seen, most of the bright 2WHSPs with Log(f11.2 ergs/cm2/s have already been unveiled by Fermi-LAT. The range between 12.4Log(f) ergs/cm2/s where histograms for detected and undetected sources have significant overlap, tells us that there must be a population of undetected 2WHSP blazars that is within the reach of Fermi-LAT; especially when taking into consideration integration time greater than 4 yrs, as used to build the 3FGL catalog.
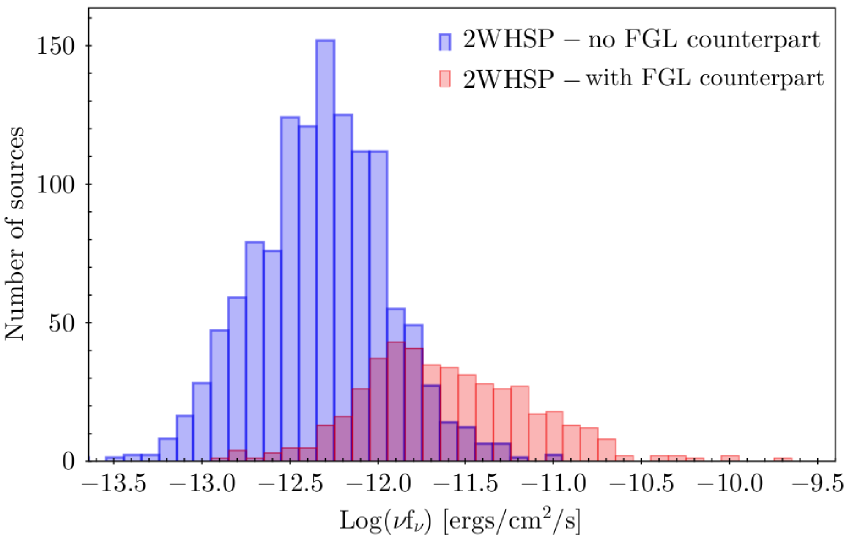
As a first step for testing the efficiency of a dedicated -ray sources-search, we performed a series of likelihood analysis on bright HSPs that were not included in previous Fermi-LAT catalogs 1FGL, 2FGL and 3FGL (FGL). It soon became clear that, when considering longer exposure time with improved event reconstruction of Femi-LAT Pass 8, a significant number of faint -ray sources could be detected. For the likelihood analysis, we define a subsample of 2WHSPs with a synchrotron component f ergs/cm2/s simply for limiting the number of seeds to 400, indeed showing its potential for wider studies with the whole 2WHSP sample.
Our present effort for unveiling new -ray sources not only provides targets for future follow-up and variability studies, but also helps us to enhance the current understanding on the nature of the VHE -ray background, which probably has a strong contribution from unresolved point-like sources (Ajello et al., 2015). Especially at the E10 GeV band, unresolved HSP blazars may have increasing relevance (Giommi & Padovani, 2015) as was confirmed by our results described in Sect. 5.
3 Fermi-LAT data reduction
The Fermi-LAT detector (Atwood et al., 2009) is characterised by a point spread function (PSF) which contains 68% of the 1 GeV events within 0.8∘. The PSF decreases with energy, following a trend up 10’s GeV, and is roughly constant at 0.1∘ from there to the highest energies considered in this paper.
Based on the position of a potential -ray source, we downloaded Pass 8 processed events from the public Fermi-database444http://fermi.gsfc.nasa.gov/ssc/data/access/ that includes all photons recorded in a region of interest (ROI) of 25∘ radius from the candidate’s position, for the whole 7.2 years of observations (MM/DD/YYYY: 08/04/2008 to 11/04/2015). In our analysis we used the Fermi Science Tools (v10r0p5), performing binned analysis to deal with the long integration time.
A series of quality cuts were applied to the raw data, starting with the selection of events having high probability of being photons (which is done by requiring and in the gtselect routine), working with maximum zenith angle-cut of 90∘ 555The zenith angle-cut is used to avoid contamination with Earth’s limb -ray photons, which are induced by cosmic-ray interactions with the atmosphere, and are known as strong source of background for the low-energy band covered by Fermi-LAT.. Given the fact that HSPs are characterised by hard -ray spectrum (with an average photon index ) we choose to work at E300 MeV, avoiding the need to calculate energy-dispersion correction during the data analysis (which is necessary for E300 MeV photons). With the gtmktime routine, we then generate a list of good time intervals (GTIs) to be considered in further analysis. In this step, some given flags ((DATA-QUAL0) and (LAT-CONFIG==1)) assure that only events acquired by LAT instrument in normal science data-taking mode are considered. Using the gtbin routine, we generate counts maps (CMAP) and counts cubes (CCUBE), having and pixels with /pixel, respectively. The CCUBE is a series of CMAPs, each one having photons within a given energy bin, and here we consider 37 logarithmically spaced energy bins along 0.3-500 GeV.
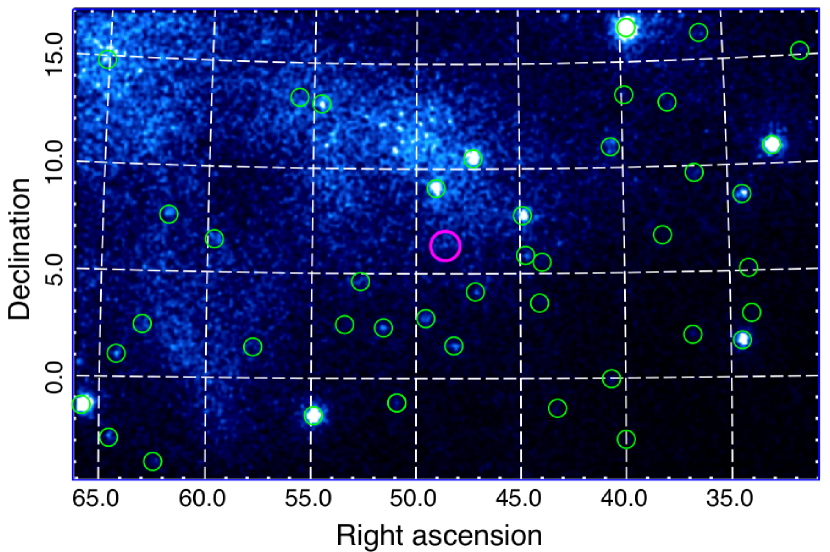
As an example, the CMAP (Fig.2) have green circles corresponding to known 3FGL sources, and a magenta circle to mark the 2WHSP J031423.8+061955 position. As seen, together with our candidate, other faint -ray sources may be present but cannot easily be distinguished from the counts map, demanding a dedicated data reduction to test the point-like source hypothesis.
A livetime cube is then generated using the gtltcube routine, holding information about the sky coverage as a function of inclination with respect to the LAT z-axis. An important parameter to set in this step is the cos(theta) which is related to the angle-binning, summing incoming photons from a particular solid angle; here we use 0.025∘ (following recommendations from the Fermi-LAT team). Later, the source map is created using the gtsrcmaps routine, and take into account the models describing all previously known -ray sources and background emission that are within radius from the center candidate. The models that describe point-like and extended sources, as well as the diffuse Galactic and isotropic background are included in a single .xml file. This was built using the script make3FGLxml.py666The make3FGLxml.py is a python routine written by T. Johnson, 2015, and provided by the Fermi-LAT team as an user contribution tool. and considers the 3FGL catalog for describing the point-like and extended sources known so far, loading parameters from the source file gll-psc-v16.fit. For the diffuse Galactic background content, the high-resolution model from the source file gll-iem-v06.fit was considered, and for the isotropic component we use the model from iso-source-v06.txt. We also considered the latest data and instrument response functions (IRFs) available at the time of work, P8R2 SOURCE V6, and event selection Pass 8 processed Source: front+back.
Since our -ray candidates are not part of the latest Fermi-LAT catalog 3FGL, they have to be added to the source-input file (.xml) that contains the model parameters and the positions of all known -ray sources. In this work, the spectrum of each -ray candidate is always modelled as a power law:
| (1) |
where is a scale parameter (also known as pivot energy), is the pre-factor (corresponding to the flux density in units ph/cm2/s/MeV at the pivot energy ), and is the photon spectral index for the energy range under consideration. Usually, the starting guess-values were chosen to be consistent with SEDs from HSP blazars, therefore: E0=1000 MeV, ph/cm2/s/MeV, =1.8 . Both and are set as free parameters and further adjusted by the gtlike fitting routine. The source position and the scaling are set as fixed parameters. In the source-input xml file, all sources within 10∘ from the candidate are set free to vary their spectral fitting parameters, therefore 3FGL models that are based on four years of observation are adjusted, since we now integrate over 7.2 years of data. This particular choice increases the computational burden of the analysis, but is crucial for adapting the model maps to the extra 3.2 years of exposure that is considered.
A likelihood analysis is then performed by the gtlike routine, considering all the information from the livetime cube, source maps and source input files, together with the PSF and IRFs, in order to best fit the free parameter from the source input list. Finally it is calculated the Test Statistic (TS) parameter, which is defined as (Mattox et al., 1996)
| (2) |
where is the likelihood of observing a certain photon-count for a model without the candidate source (the null hypothesis), and is the likelihood value for a model with the additional candidate source at the given location. The reported TS values correspond to a full band fitting, which constrains the whole spectral distribution along 0.3-500 GeV to vary smoothly with energy and assuming no spectral break. Considering we have a good description of Galactic and extragalactic diffuse components, this is a measure of how strong a source emerges from the background, also assessing the goodness of free parameters fit. A TS25 is equivalent to a 4-5 detection (Abdo et al., 2010) (depending on the strength of the background in the region), and only cases with TS25 are considered by the Fermi-LAT team as a positive detection of point-like source. We first run the gtlike with the fitting optimiser mode DRMNFB, which generates an enhanced source-input list with all the free parameters recalculated (the first interaction of the fitting procedure). We again feed the gtlike routine with the enhanced source-input list, and use the fitting optimiser mode NEWMINUIT to generate the final model for all sources in the ROI.
4 New -ray detections. Validation and population properties
Here we present the -ray detection of 85 2WHSP sources at TS25 level; and we extend the -ray analysis by considering another 65 2WHSPs with lower significance -ray signal, with TS ranging between 10 and 25. In Table Searching for -ray signature in WHSP blazars: we list relevant information for these 150 sources, including names, positions, redshift, -ray model parameters and their associated uncertainties. The new -ray sources are named with the acronym 1BIGB for the first version of the Brazil ICRANet Gamma-ray Blazar catalog, with source designation 1BIGB JHHMMSS.sDDMMSS, and coordinates corresponding to the 2WHSP seed-positions. We also present a few examples of TS maps (Sect. 4.2 and 4.3) both for high and low-significance -ray signatures, showing that they all emerge as point-like sources, and should not be taken as spurious signals.
In Sect. 4.4 we test a direct source-search using the 3FGL catalog analysis setup, showing that we could successfully probe faint -ray emitters and add complementary -ray detections. In Sect. 4.5 we calculate the -ray detection efficiency based on the brightness of the synchrotron peak (figure of merit). In Sect. 4.6 we plot the photon spectral index () distribution for the newly-detected -ray sources and compare their spectral properties with the FGL counterparts from 2WHSP sources. We also show the vs. flux (1-100 GeV band) so that the improvement, with respect to the flux threshold when considering detections down to TS=10, can be evaluated. In Sect. 4.7 we comment on flux-fluctuations associated with sources close to the flux-threshold (Eddington bias effect) showing that this effect is not severe in our context.
4.1 High-significance -ray sources with TS25
In Sect. 2 we show that the natural candidates for our analysis are the bright 2WHSP sources777By bright sources we mean: 2WHSPs with the largest flux density associated to the synchrotron peak fν-peak component. that have not yet been detected by Fermi-LAT (in previous 1FGL, 2FGL and 3FGL catalogs), as suggested from Fig. 1. Therefore, by sorting the 2WHSP source based on their synchrotron peak brightness, we considered cases down to Log(f)=-12.1 ergs/cm2/s, selecting 400 -candidates, from which 85 (21%) have shown high-significance -ray signature with TS25.
For each source of interest, we inspected a region of 50’ radius around it, checking for any previous -ray detections or for the presence of bright blazars that could also be potential high-energy counterparts. For this task we made use of the Sky Explorer Tool, available from the ASDC web site (tools.asdc.asi.it), which displays all radio, optical, X-ray, and -ray detections for a given ROI. During the preparation of this work, the 2FHL catalog (Ackermann et al., 2016b), which contains only E50 GeV detections was released, including six of the sources we were working with. Also Campana et al. (2015), as well as Campana et al. (2016), reported on possible counterparts of photon-clustering detected by Fermi-LAT at E10 GeV, which included eight of our detections (two in common with the six 2FHL). We keep them in our Table Searching for -ray signature in WHSP blazars:, indicated with “a” and “b” superscripts, respectively, since they constitute positive detections based on our primary approach, showing the intersection between valuable methods for unveiling new -ray sources.
The fact that few 2FHL-sources and Campana-sources are in common with our detections is certainly due to their analysis being based only on -rays, applied to E50 GeV and E10 GeV, respectively. Our energy threshold at E300 MeV is much lower and well suited to the way we select our seeds (based on multi-frequency information from radio to X-rays, not only on -ray data). Therefore, we are able to probe hard -ray sources, even if they have low flux at E10 GeV (we do not depend on -ray photon clustering to identify our seeds). In fact, both approaches are powerful and should be seen as complementary, since they all apply to the goal of enriching our description of the -ray sky.
4.2 The TS map and -ray spectrum
A TS map consists of a pixel-grid where the existence of a point-like source is tested in each pixel. This is a demanding computational task when exposure time that is longer than few months are considered. Here we study the case of 2WHSP J021631.9+231449, defining a 25x25 grid with 0.05∘/pixel, and evaluated each grid-bin using likelihood analysis from gttsmap routine. Given the fact that WHSP blazars are expected to be hard spectrum -ray sources, we built a TS map that only considers photons with energy larger than 3 GeV 888For HSP sources with high-significance -ray signature, the cut at 3 GeV in many cases provided (and is therefore the reason why we choose it; see examples on Sect. 6) a good balance between computation time and ability to solve the gamma-ray signature as a point-like source. Also, despite the fact we are dealing with HSP blazars (with mean -ray photon index 1.9) Fermi-LAT has relatively good sensitivity along the 1-100 GeV band, and improved PSF at 3 GeV, which helped to achieve better localization for the -ray sources when necessary.. The cut in photon energy helps not only to save computation time, it also has another important purpose: Since the PSF improves with increasing energy, working with high-energy photons help us to determine the TS-peak position with better precision. When building the TS map from Fig. 3, the input model (.xml file) does not contain our -candidate, so that the map alone can test the existence of point-like sources (with no previous bias), which may manifest as a TS peak that emerges from the background.
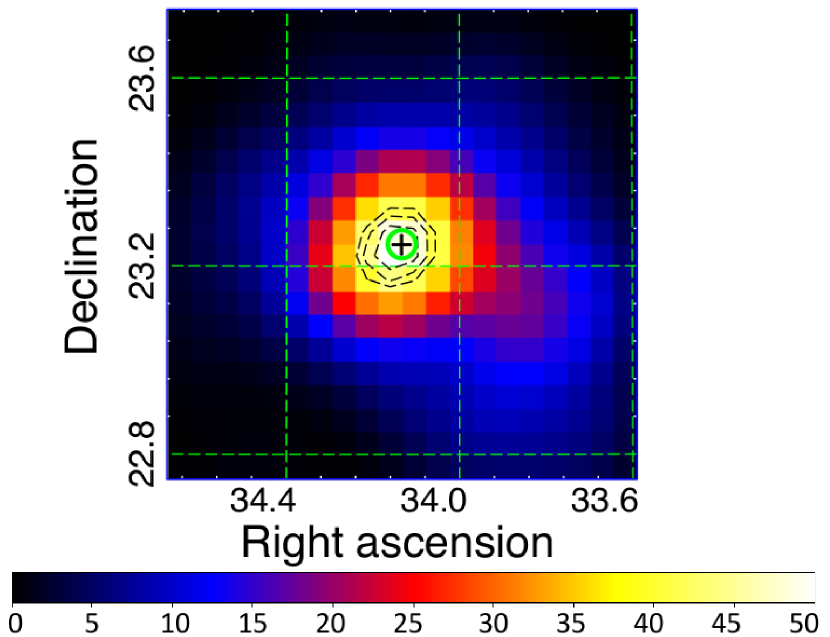
All sources within 7∘ from the grid center have their corresponding model parameters set as free to adjust for the current analysis. Also, we set as free parameters the Normalization (from the diffuse extragalactic background model) and ConstantValue (from the Galactic background model) to avoid having large TS values that are only due to an overestimated background flux. An overestimated background usually manifest as a smooth distribution of high TS values along the whole grid, therefore it is important to properly scale it in the studied region, and evaluate if the source emerges with high TS values from a low TS () background. When the background is not well described, it could affect (or mimic) a point-like source detection. Since we are mainly working at high Galactic latitude , we avoid most of the Galactic diffuse emission (which is strong and highly structured at lower latitudes), preventing spurious detections. As seen in Fig. 3, the 2WHSP source is well within the 68% confinement region for -ray signature (Mattox et al., 1996), and TS values at the grid center contrasts with outer regions, ensuring that the observed TS peak is due to a point-like source rather than an overestimated background component.
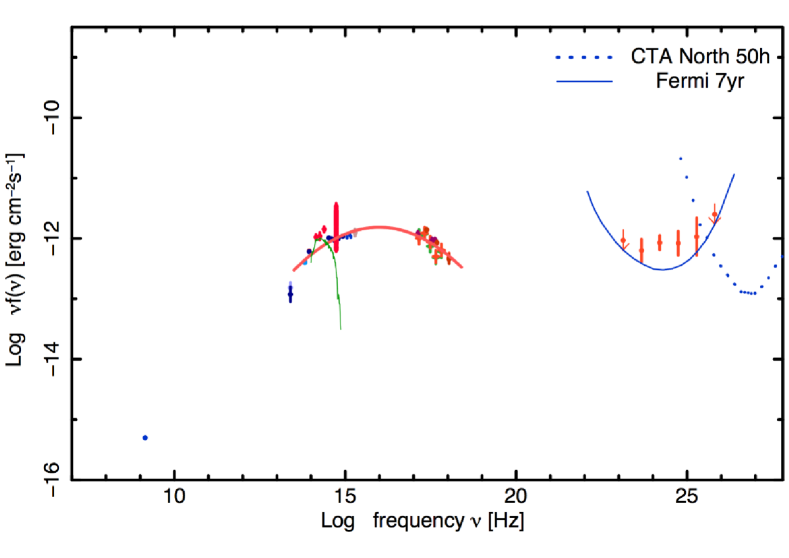
In Fig. 4 we show the multi-frequency SED 999Here we make use of the Sky-Explorer tool from www.asdc.asi.it, quickly retrieving multi-frequency information from public data bases, to cite: White & Becker (1992); Gregory et al. (1996); Cohen et al. (2007); Condon et al. (1998); Nieppola et al. (2007); White et al. (1997); Dixon (1970); Wright et al. (2010); Warren et al. (2007); Harris et al. (1996); Voges et al. (1999, 2000); Watson et al. (2009); Saxton et al. (2008); Puccetti et al. (2011); D’Elia et al. (2013); Alam et al. (2015). for 2WHSP J021631.9+231449. The -ray SED was calculated by dividing the full energy band 0.3-500 GeV into 6 bins, equally spaced in a logarithmic scale, to compensate for the lower number-counts when increasing the photon energy. The upper limits (u.l.) are computed only for energy bins with TS9, and considering a 95 confidence level on the integrated flux along the whole energy bin. The broadband sensitivity at a certain energy E (thin blue line in Fig. 4) is calculated as the maximum flux of a power law source at the LAT detection threshold, for any spectral index.
The source 2WHSP J021631.9+231449 (=1.970.12) is clearly a promising candidate for observation in the VHE domain with the future Cherenkov Telescope Array (CTA, Actis et al., 2011), or even in reach for present detectors during flaring events. This new -ray detection is only one example within the many cases listed in Table Searching for -ray signature in WHSP blazars:, raising our expectations for future VHE studies. Currently, we do not have TS maps and -ray SEDs calculated for all sources101010The computational demand for accomplishing such task is relatively large, and requires further planning together with our Computer-Cluster partners; to cite: Joshua-Cluster from ICRANet Italy, and Gauss-Cluster from CESUP Brazil.. However, we plan to make them available in the near future as a natural extensions of the present work, given the importance of HSP blazars for upcoming observations with CTA.
4.3 Lower significance -ray sources
Within the 400 2WHSPs studied, 65 had faint signatures of -ray emission with TS values ranging between 10 and 25, and are also listed in Table Searching for -ray signature in WHSP blazars:. We call these lower-significance detections because these sources have TS25 (the threshold-limit assumed by the Fermi-LAT team) but they still represent relevant findings considering the number of seed-positions used in our present approach.
As known, the significance can be approximated as (Mattox et al., 1996) and, working with TS=10 threshold, implies our detections have significance of the order of 3. Since we performed a series of 400 binned likelihood analyses for positions only associated with WHSP sources, the number of spurious detections (Nspur) expected is N40010-3=0.40; therefore we do not consider spurious detections as a concern in our work. In fact, we have individuated a total of 150 -ray excess within TS10 level, which corresponds to positive signatures for all the 400 candidates tested.
It should be clear that we are not performing a blind-analysis of the whole -ray sky, therefore the number of seed-positions we inspect is very small. The strong threshold cut (TS25) adopted by the Fermi-LAT team manifest their rigour before validating any new populations of -ray emitters. In contrast, our candidates are a particularly small population of well-characterised (from radio to X-rays) blazars which are firmly established as a family of -ray emitters, therefore a 3 detections threshold is suitable for our approach.
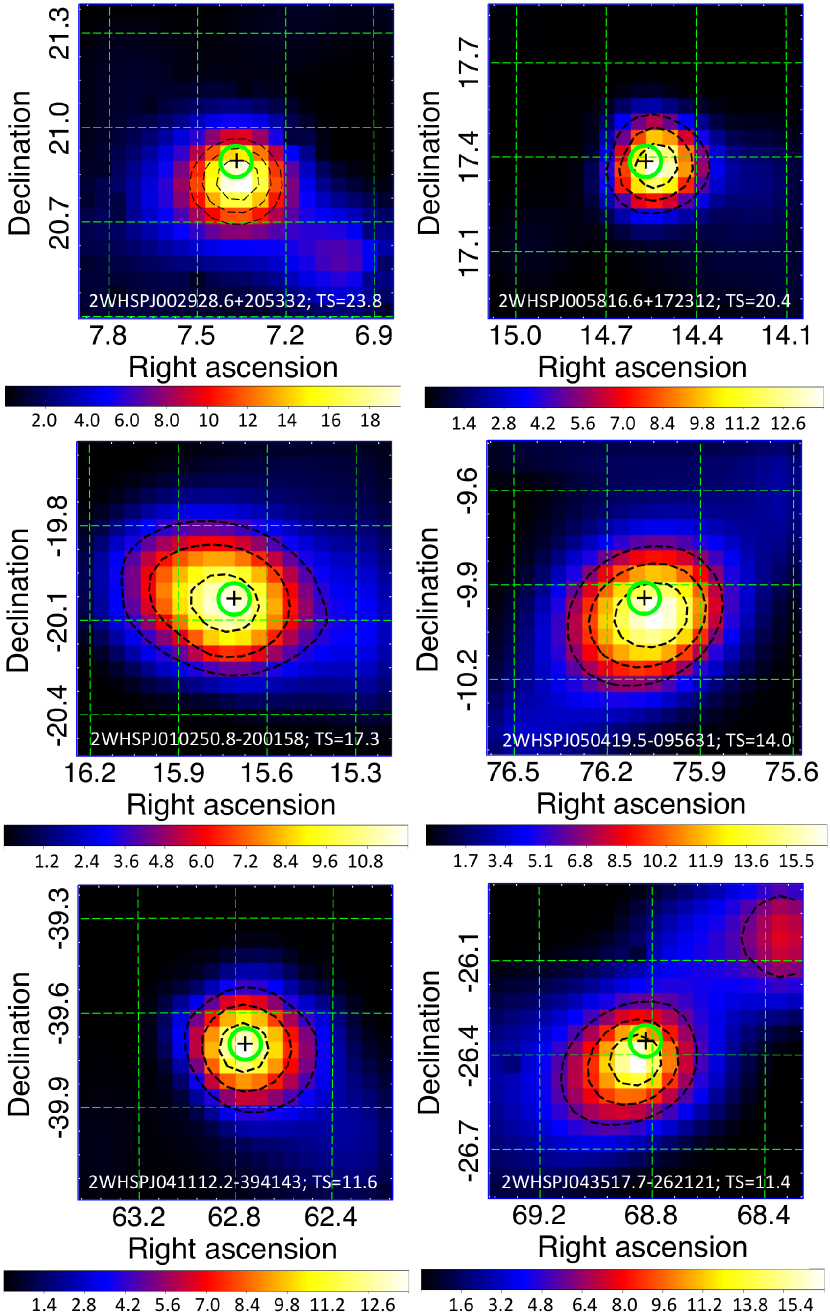
As a complementary test to evaluate if our lower-significance detections are consistent with point-like sources, we randomly choose six cases with TS in the range from 10 to 25 and calculate their corresponding TS maps (Fig. 5). Since lower-significance sources are hard to detect based only on 3 GeV photons, to improve the photon counts we go to lower energies (0.6-500 GeV), which helps to individuate the gamma-ray signatures111111Also, we should add that the overall computation time for lower-energy TS maps integrating over 7 yrs can easily became prohibitive (weeks). Especially for bright sources; large photon-counts translate into large computational demand. Therefore, there is no absolute way to choose a working energy-range. We are always limited by the computation time, and many cases demand us to adapt (for example, see the lower-energy TS map from Sect. 6.1, where we had to work in a narrow energy range of 700-800 MeV to reach results in reasonable time).. All six candidates studied clearly emerge from the background as point sources, and are consistent with the 2WHSP positions within the 68% confident radius for the -ray signature. In fact, this reinforces our view that assuming a TS10 threshold does not contaminate our results with spurious detections.
Given the variability of one order of magnitude is often observed for HSP blazars in the GeV-TeV bands121212For dedicated studies on variability involving HSP blazars, see Krawczynski et al. (2004) reporting on 1ES 1959+650 2WHSP J195959.8+650853, or Błażejowski et al. (2005); Sahu et al. (2016) reporting on Mrk421 2WHSP J110427.3+381230., most of these lower-significance detections may be in reach of CTA during flaring episodes (see Fig. 4). In fact, the validation of lower-significance detections associated with HSP blazars provide relevant hints about the population responsible for considerable portion of the high-energy isotropic -ray background (IGRB); and it is also important to account for their existence and imprints, since they add anisotropic contribution to the IGRB (Malyshev & Hogg, 2011; Cuoco et al., 2012; Ackermann et al., 2012; Inoue, 2014).
knowledge about the position and model-parameter for describing individual faint -ray sources may also help to improve tentative correlations of the IGRB with the large-scale structures/clusters (Ando et al., 2014; Prokhorov & Churazov, 2014), since their contribution could be subtracted from the currently unresolved background (i.e., to clean the IGRB from faint point-like sources before trying any sort of correlation). By relying on multi-frequency data to search for faint -ray source, we may improve our capability of resolving them. Moreover, since the present evaluation is primary driven by the position of HSP blazars, it is important to keep track of any case that shows a faint -ray signature even if not enough to fit in the current TS-limit for detection demanded by Fermi-LAT team.
4.4 A direct source-search as a complementary approach to probe faint -ray emitters
To evaluate the potential of using direct source-search as a complementary method when building -ray catalogs, we select 30 objects with the highest significance -ray signatures from our list of new-detections (all sources having TS45 in our analysis with Pass 8 data integrating over 7.2 yrs). We then test if these sources could be detectable with high/lower-significance based on the -ray analysis setup used to build the 3FGL catalog. We download Pass 7 data131313Pass 7 data: http://heasarc.gsfc.nasa.gov/FTP/fermi/data/ lat/weekly/p7v6/ corresponding to the first four yrs of observations (MM/DD/YYYY: 08/04/2008 to 08/04/2012) and proceed with the likelihood analysis that considers a background of extended and point-like sources built based on the gll-psc-v14.fit list, with information available at that time. For the diffuse Galactic background content we consider the source file gll-iem-v05-rev1.fit, and the iso-source-v05.txt model for the isotropic component. We also choose the IRF corresponding to the preparation of 3FGL catalog P7REP SOURCE V15, and event selection Pass 7 reprocessed source data (front+back).
The results are listed in Table Searching for -ray signature in WHSP blazars:, showing four high-significance detections at TS25 level, and 17 lower-significance cases with TS in between 10 to 25. Indeed, our test shows that a direct-source search can be used as a complementary method to refine the description of the -ray sky; not only revealing high-significance sources, but also allowing lower-significance sources to be successfully probed. The fact that we only present four extra sources that could fit the 3FGL detection threshold should not mislead us into thinking that these types of contributions are not worth to incorporate. As discussed, this test considers only a few sources, and an extended study over the whole blazar population could add a significant complementary contribution. Also, with increasing integration time from Fermi-LAT data, we reach a lower flux threshold (S), and the source number-count may improve S-1.5; therefore the impact of a direct source-search probably has increasing relevance to the building of the next -ray catalogs.
Clearly, most of our new high-significance detections based on 7.2 yrs with Pass 8 data are mainly driven by a longer integration time (from four years, enhanced to 7.2 years) and improved event reconstruction (from Pass 7 to Pass 8). However, all 150 detections presented in our work (Table Searching for -ray signature in WHSP blazars:) were only possible because we knew where to look, using selected seed positions selected when considering multi-frequency data. In this regard, multi-frequency selected seeds are indeed very promising for driving new -ray detections just as gamma-ray seeds are, and here we emphasise their complementarity. Also, a likelihood analysis based on seeds selected from populations of -ray emitter enabled us to successfully probe a population of lower-significance emitters (using Pass 7 - 4 yrs) that are later confirmed with TS45 when working with 7.2 yrs of Pass 8 data.
4.5 Detection efficiency according to FOM parameter
The figure of merit (FOM) parameter (Arsioli et al., 2015) is defined as the ratio between the synchrotron peak flux f of a given source and that of the faintest 1WHSP blazar already detected in the TeV band ( f= 10-11.3 erg/cm2/s); FOM = f / 10-11.3. The FOM then provides an objective way of assessing the likelihood for GeV-TeV detection of HSP blazars, based on the synchrotron peak brightness, and is not affected by absorption of VHE photons owing to the interaction with extragalactic background light (EBL, Franceschini et al., 2008).
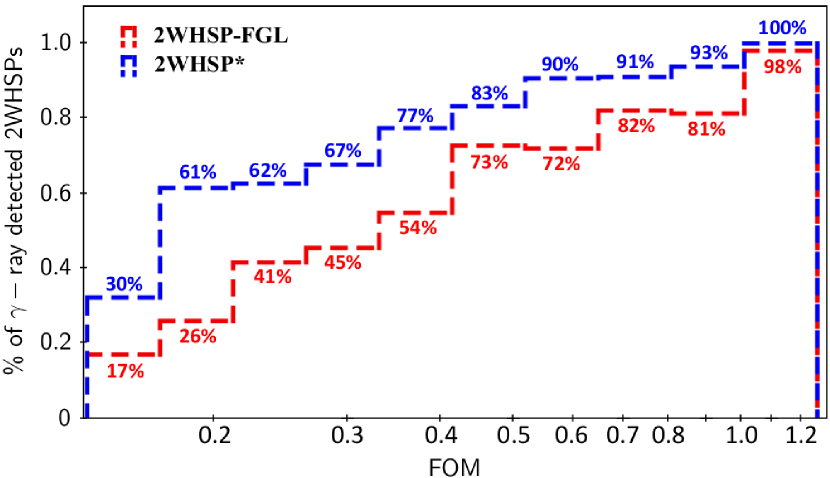
Figure 6 illustrates this concept, showing the fraction of 2WHSPs already detected in -ray according to different FOM bins, considering the subsample of 439 2WHSP-FGL sources (in red), and the subsample of 589 2WHSP* 141414We may use 2WHSP* when referring to the total 589 sources that include: 439 2WHSP-FGL + our 150 -ray detections at TS10 level., which represents all -ray detections (in blue). Clearly, the detection efficiency increases with increasing FOM, and there is a considerable increment in the fraction of sources detected for each FOM-bin when accounting for the 150 sources listed in Table Searching for -ray signature in WHSP blazars:. Therefore, the 2WHSP sample shows its potential for unveiling high/lower-significance -ray sources, emphasising the power of considering multi-frequency information to select VHE -ray targets for Cherenkov Telescope Arrays, as discussed in Arsioli et al. (2015) and Chang et al. (2016). In addition, given that -ray detected HSP blazars have been suggested as counterparts of IceCube astrophysical neutrinos (Padovani et al., 2016), our present work may contribute to discussions in the realm of multi-messenger astrophysics, especially when studying cross-correlations between extreme -ray blazars and astro-particles.
4.6 The -ray spectral properties of 2WHSP blazars
In Fig. 7 we present the photon spectral index () distribution for the 150 new -ray excess signals (indigo), and compare it with the distribution for the 439 2WHSP-FGL sources (red continuous line). The histogram is normalized with respect to the size of each subsample, so we can visualise their distribution-shape more accurately. A Kolmogorov-Smirnov (KS) test comparing both histograms gives a pvalue=0.991, meaning the distributions are fully consistent with the same parent population and have similar -ray distribution properties. Also, the mean photon spectral index only associated with the 150 new -ray sources is in good agreement with that calculated for the 2WHSP-FGL sample . Considering all -ray detections together (the 2WHSP* subsample) we have .
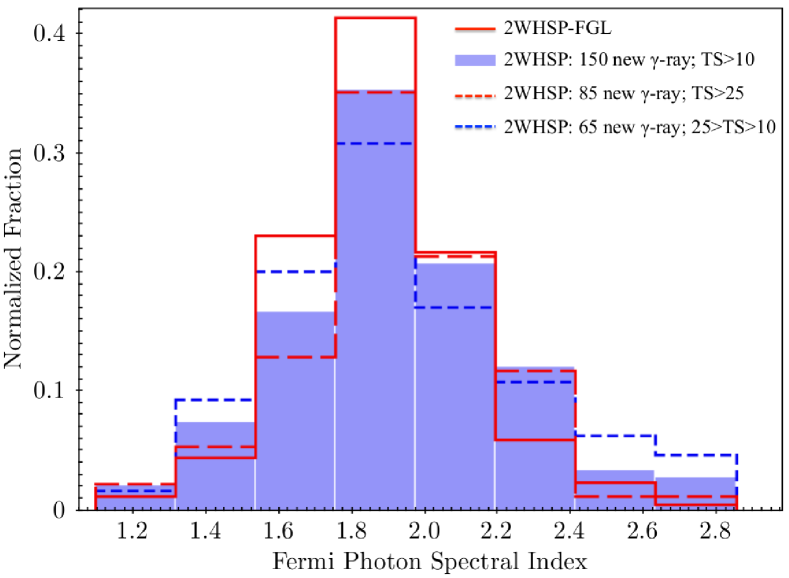
When comparing the photon spectral index distribution of 2WHSP-FGL with the subsample only having our 85 new -ray detections at TS25; also with the one only having our 65 lower-significance -ray detections, the p-values are respectively: p=0.987 and p=0.763. Therefore, since all the cases we compared showed p0.05, we should not reject the hypothesis that all distributions are similar, consistent with a single-parent population.
The vs. S plot (Fig. 8) shows how we went into lower flux-limit (blue dashed line) compared to previous -ray catalogs (red dashed line). This improvement is a combination of many elements: Our dedicated search for -ray counterparts based on WHSP positions, the larger exposure time used (since we integrate over 7.2 yrs of observations), better events reconstruction (from Pass7 to Pass 8), and also the fact that we consider sources down to TS10.
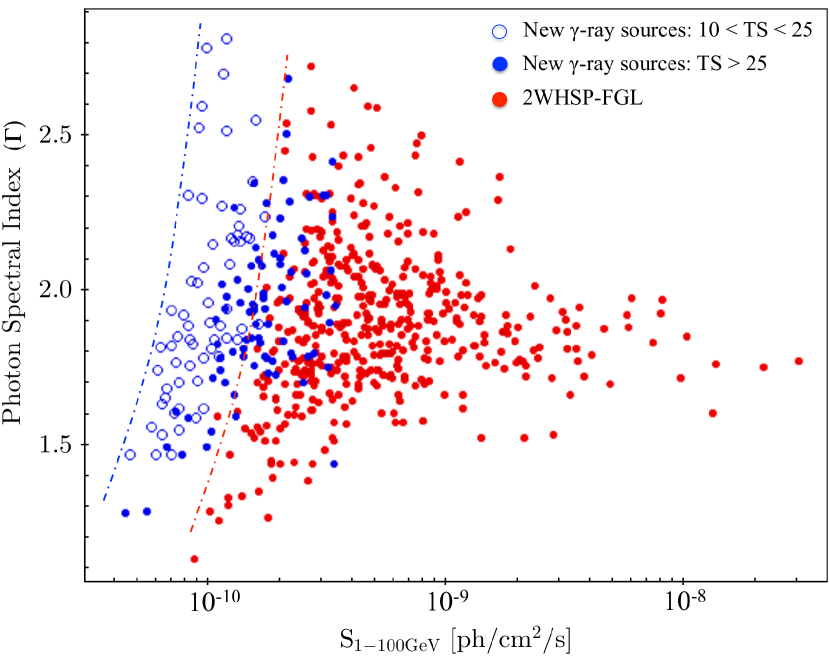
The overlapping between red and blue dots (Fig. 8) in the range 1-410-10 ph/cm2/s illustrates how we improved completeness for our HSP -ray sample, when considering the new detections presented in Table Searching for -ray signature in WHSP blazars:. We note that the -ray threshold sensitivity for HSP blazars has little dependence on the photon spectral index down to S10-11 ph/cm2/s, so that sub-samples with flux-limit S have low bias arising from . On the other hand, the threshold dependence on is much stronger when considering the integrated flux along the whole band 0.1-100 GeV, as reported in Nolan et al. (2012) and Acero et al. (2015). Therefore, the discussion in section 5 considers the 1-100 GeV energy range151515The integral flux for the energy range 1-100 GeV is commonly reported in all Fermi-LAT catalogs (1FGL, 2FGL and 3FGL). For practical reasons we work in the same energy range, making it easy to combine flux information from our current list (Table Searching for -ray signature in WHSP blazars:) with the 1-100 GeV flux reported in Fermi-LAT catalogs. Moreover, since the 1-100 GeV band is covered with relatively good sensitivity by Fermi-LAT, the power law modelling of faint hard-spectrum -ray sources is more reliable in this range. for the flux distribution histogram (Fig. 9) and also for the -ray LogN-LogS studies (Fig. 11 and 12).
If we plot the histogram of -ray flux for the 2WHSP-FGL subsample, comparing it to our 150 -ray detections with TS10 (Fig. 9), we see that our sources dominate the faint-end. A KS test comparing both histograms gives a p-value of 0.062, which is relatively low, almost excluding the hypothesis that the histograms are similar with respect to the flux distribution. In fact, it shows that our new -ray detections (Table Searching for -ray signature in WHSP blazars:) are part of a population of faint sources that was not probed before, and represents a contribution to the IGRB that was previously unresolved.
As is clear from Fig. 9, there is a region in the S histogram where our new detections overlap the 2WHSP-FGL sources. For fluxes lower than 2.710-10 ph/cm2/s the detection efficiency from the 3FGL catalog drops considerably (also shown by a sharp cut in differential number counts dN/dS, Fig. 12 in Sect. 5). As discussed in Sect. 4.4, our new detections at the faint-end of S histogram are mainly driven by longer integration time, improved event reconstruction, and a lower TS threshold; not only, a direct search can bring complementary sources that improve detection efficiency close to the flux-limit. In addition, the Fermi-LAT exposure is not uniform (Acero et al., 2015, see their Fig. 1) and therefore sky-regions inspected with lower exposure (4-yrs with Pass 7) now benefit from better sensitivity owing to longer exposure, revealing new sources at the same faintest flux levels probed by the 3FGL setup. Therefore, taking all of this into consideration, we naturally expect an overlap in the S faint-end.
4.7 Comments on the Eddington bias effect
Ackermann et al. (2016a) has called attention to the statistical fluctuations of photon flux, especially for faint -ray sources close to the Fermi-LAT detection limit, which could lead to overestimated flux-values. The statistical fluctuation of sources close to the flux threshold of any sample is known as an Eddington bias (Eddington, 1913) and has a direct impact on the number counts (LogN-LogS) or any other study relying upon the measured flux. For the 2FHL catalog it has been shown through simulations (Ackermann et al., 2016a) that the measured fluxes along 50 GeV-2 TeV band could be overestimated up to 10 for the faintest sources. However, we should note that this factor also has a strong dependence on the -ray spectral properties from individual sources.
Especially, the distribution for the 2FHL sample ranges from 1.0 to 5.5 (see Fig. 10) with mean value . Naturally, statistical fluctuations on photon flux measurements are more extreme for the steepest -ray spectra (Fig. 10, right side).
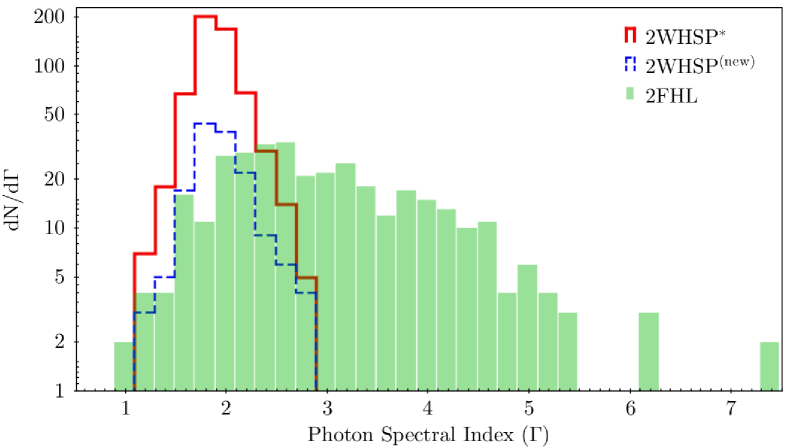
In this case, we may be subject to the same effect, however the distribution for the 2WHSP∗ sample is well confined to the 1.2 to 2.8 range, with mean value . Since the mean -ray spectrum for the 2WHSP∗ sources is close to flat, the effect of statistical flux fluctuations is much less severe in our sample, and does not compromise the measured-flux.
To estimate the effect of the Eddington bias in the faint-end of our sample we compare the parameter S from Tables Searching for -ray signature in WHSP blazars: and Searching for -ray signature in WHSP blazars: that were calculated for the same sources, but with different flux limits (see Sect. 4.4). In the first case, the likelihood setup is based on 7.2 yrs Pass 8 data, and the second one is based on 4 yrs Pass 7 data; therefore different flux-thresholds.
From Table Searching for -ray signature in WHSP blazars: let us assume that the 17 sources with TS in between 10-25 are a good representative of our lower-significance detections, for which the measured fluxes S could be overestimated. When analysing these same 17 sources with an advanced setup of 7.2 yrs with Pass 8 (Table Searching for -ray signature in WHSP blazars:) all of them become -ray detected with relatively high-significance TS45, and their measured fluxes can be considered as the true ones, S, since the flux threshold is now relatively improved.
We then calculate S/S=0.79 as an estimate for the order of magnitude of flux fluctuations for 2WHSP sources close to the Fermi-LAT threshold. This is far from the 10 factor that could affect FHL sources, especially the ones with a steep -ray spectrum. Clearly, the effect is not representative for our sample and does not compromise further results. Moreover, in systematically overestimating the flux from faint sources, the Eddington bias would manifest as re-steepening in the number counts, which is not observed (see Fig. 11 and 12).
In conclusion, the S/S value tells us that the -ray variability associated with HSP blazars probably dominates eventual oscillations of the S parameter when the two likelihood analysis-setups are compared. Also, it shows that the overlapping between -ray subsamples in Fig. 9 is mainly driven by better detection efficiency (from longer exposure time and improved event reconstruction from Pass 8) rather than statistical flux fluctuations.
5 The isotropic -ray background: Contribution from HSP blazars to the diffuse component
Since we unveil and model a relatively large number of -ray emitters down to TS=10, we try to evaluate quantitatively what is the impact of our approach for resolving the extragalactic -ray background (EGB), and isotropic -ray background (IGRB) components.
| Ebin (GeV) | IEGB | IIGRB | I | EGB | IGRB | I | EGB | IGRB |
|---|---|---|---|---|---|---|---|---|
| 1.1-13 | 4.510-7 | 2.710-7 | 1.2210-9 | 0.27% | 0.45% | 1.7310-9 | 0.38% | 0.65% |
| 13-36 | 1.410-8 | 8.210-9 | 8.4810-11 | 0.61% | 1.0% | 1.1910-10 | 0.86% | 1.4% |
| 36-51 | 1.810-9 | 1.110-9 | 1.5910-11 | 0.88% | 1.4% | 2.2410-11 | 1.2% | 2.0% |
| 51-72 | 1.110-9 | 6.310-10 | 1.1910-11 | 1.1% | 1.9% | 1.6810-11 | 1.5% | 2.7% |
| 72-100 | 6.210-10 | 3.610-10 | 8.6910-12 | 1.4% | 2.4% | 1.2310-11 | 2.0% | 3.4% |
| 100-140 | 3.110-10 | 1.510-10 | 6.8910-12 | 2.2% | 4.6% | 9.8210-12 | 3.2% | 6.5% |
| 140-200 | 1.910-10 | 9.810-11 | 5.6310-12 | 2.9% | 5.7% | 8.0510-12 | 4.2% | 8.2% |
Following the discussion from Ackermann et al. (2015a), we refer to EGB as the sum of all resolved and unresolved contributions from individual extragalactic sources (Blazars, misaligned AGNs and Starburst Galaxies) plus the diffuse emission coming from outer Milky Way regions (which could be related to dark-matter annihilation, intergalactic shocks, and -ray cascades induced by ultra high-energy cosmic rays). The exact EGB composition is a matter of intense debate161616 Ackermann et al. (2015a) also discuss the challenges for measuring the EGB component, which demands a proper modelling of the diffuse Galactic emission (DGE) especially as a result of cosmic rays interacting with the Milky Way gas and photon fields. The DGE has intensity comparable to the EGB, and to obtain the EGB, both the DGE and the known Galactic sources have to be subtracted from the total-sky -ray counts. The reported EGB flux (1.1-200 GeV) is I ph/cm2/s/sr., and it is well known that contributions owing to unresolved sources may build-up a dominant fraction of the diffuse EGB. Therefore, resolving point-like sources translates directly into narrowing the window available for putative truly-diffusive components, especially when constraining the upper-limits of dark-matter annihilation cross-section as discussed by e.g. Ajello et al. (2015) and Fornasa & Sánchez-Conde (2015).
Another term commonly used is isotropic -ray background (IGRB), and it is obtained by subtracting the known extragalactic sources from the EGB. Therefore IGRB represents the sum of a true extragalactic diffuse component, plus the contribution of unresolved sources (which mimic and contaminate the diffuse component). According to Di Mauro et al. (2014), Di Mauro (2015) and Giommi & Padovani (2015), unresolved HSPs/BL lacs may be the dominant component of the IGRB at E10 GeV and indeed, here we bring evidence of a population composed of faint -ray HSP blazars near the detectability threshold from Fermi-LAT, that was previously undetected.
Based on the model for individual sources, we calculate their corresponding fluxes for each energy bin (Ebin are listed in Table 1), and sum over our -ray detections at 10∘ listed in Table Searching for -ray signature in WHSP blazars:. We then normalize these values multiplying by Asky/(4 A), where Asky = 41252.96 deg2 is the total sky area, A = 34110.3 deg2 is the sky area out of the Galactic disk, and the factor 4 normalize the integral flux per unit of steradian, [ph/cm2/s/sr], written as Inew-detc. We compared Inew-detc with the IGRB and EGB intensities (IIGRB and IEGB) as reported by Ackermann et al. (2015a), following the same Ebin steps as theirs. Since our source-modelling does not account for broken power law features that may arise from EBL absorption, especially for large redshift sources, we extend our calculations up to 200 GeV only.
Table 1 lists the corresponding IGRB and EGR fractions we resolved, showing that the subsample of previously undetected -ray HSP blazars has increasing relevance for the background composition at higher energies. We evaluate separately the impact owing to all new detections at TS10 level, and also owing only to the cases reported with TS25. This helped us understand what to expect (in terms of ability to solve the IGRB) from dedicated source-searches based on catalogs of potential -ray candidates, and also to evaluate the importance of taking into account lower-significance detections from faint -ray blazars. As can be seen, their contribution is not negligible, showing an increment of the order of 40 larger IGRB solved for each energy bin if we compare the subsamples of our new -ray sources detected at TS25 and TS10.
We also report on the LogN-LogS for HSP blazars using all -ray information currently available for the 2WHSP sample. Especially, we incorporate a complementary description for the HSP population at lower -ray fluxes by considering our 150 new -ray detections down to TS10 level. We define the 2WHSP∗ -ray sample (which encloses all 2WHSP-FGL sources together with our new detections) and compare it to the 2WHSP-FGL.
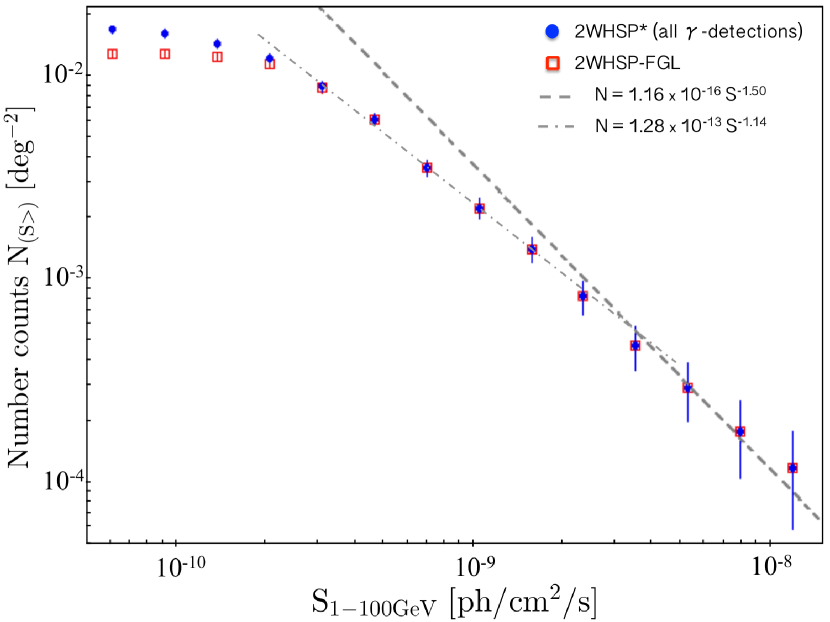
In Fig.11 we plot the cumulative number counts N [deg-2] with flux S larger than the corresponding value on the x-axis. By fitting the -ray LogN-LogS with a broken power law (Fig. 11), we consider an Euclidian behaviour for the bright-end, and an early break171717To confirm the presence of this early break in the number counts, we extracted the LogN-LogS data from Acero et al. (2015) paper (their Fig. 29) plotting the cumulative energy flux distribution for the clean sample of HSP blazars (also uncorrected for non-uniform sensitivity and detection efficiency). Although they do not mention the fitting parameters, we found good agreement with a broken power law that has similar slopes as ours: N = 3.2 10-19 S, N = 1.8 10-15 S; In this case S 3.5 10-11 ergs/cm2/s, but there is also a strong cut at S 7.0 10-12 ergs/cm2/s. Therefore also manifesting two breaks that probably have the same origin as in our case. at Sbreak-1=3.510-9 ph/cm2/s:
| (3) |
As a test of consistency, we calculate the number of sources n predicted by the fitting (Eq. 3), which have flux in the interval (with Smax=1.010-8 and Smin=3.010-10 ph/cm2/s) where the LogN-LogS is well described by the broken power law. The number of sources predicted is: , where the parameter =34110.3 deg2 is the sky area at high Galactic latitudes , resulting in n 309.5, which is in very good agreement with the number of -ray sources expected from the 2WHSP∗ sample in this same interval, n(2WHSP∗) = 311.
An important point to mention is that our new detections only add improvements to the LogN-LogS after the second break. The region in between the first and the second break is not affected by the incompleteness of the 2WHSP -ray sample. However, even if the LogN-LogS for SSbreak-1 deviates from the Euclidian prediction, it is early to argue we are probing evolution of HSP blazars; further studies need to introduce corrections owing to non-uniform exposure from Fermi-LAT.
When plotting the differential number counts -dN/dS vs. S (Fig. 12), the low flux threshold (Sbreak-2) is evidenced. This manifests as a sharp cut in dN/dS at S2.710-10 ph/cm2/s, showing that incompleteness becomes severe for both samples (2WHSP-FGL and 2WHSP∗) at that particular flux level. Figure 12 also clearly presents how we increment the -ray sample completeness, specially at the faint-end where the 2WHSP* (blue) detaches from the 2WHSP-FGL (red).
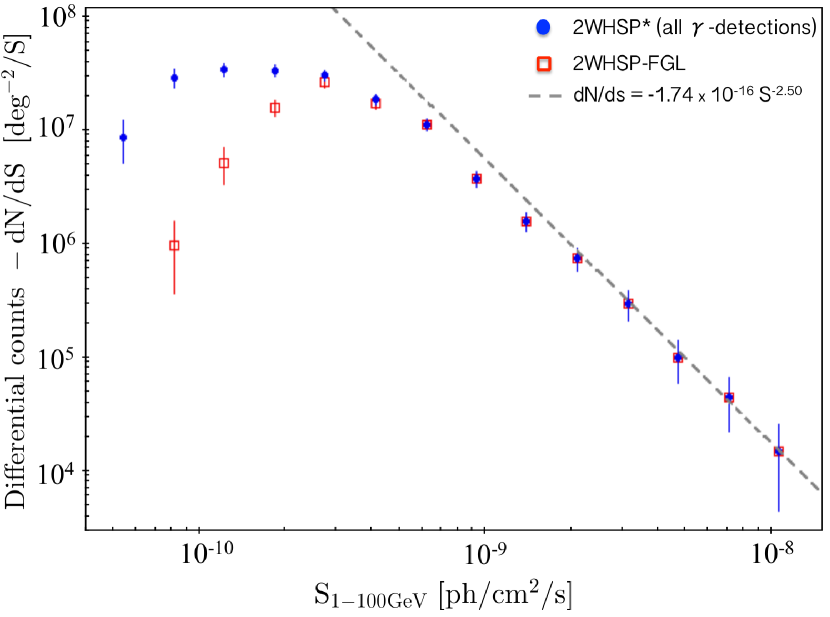
If we assume there is no cut owing to the flux threshold at Sbreak-2, so that the power law (Eq. 3) is a good description for the number counts when extrapolating to the faint-end (from Smax=1.010-8 down to Smin=6.010-11 ph/cm2/s)181818We choose the faint-end to be ph/cm2/s since this is consistent with our flux threshold; as can be seen in Fig. 9, there is a sharp cut in the number of -ray sources for fluxes lower than that., it is possible to estimate the integral contribution of HSP blazars to the EGB in the 1-100 GeV band, I:
| (4) |
where Asky = 41252.96 deg2, and the factor 4 is for normalizing the total flux per unit of sky-steradian. The total 1-100 GeV flux generate by HSP blazars is of the order I 4.80 10-8 ph/cm2/s/sr, which represents 8.5 when compared to the total EGB content for the same energy band I = 5.63 10-7 ph/cm2/s/sr (Ackermann et al., 2015a, their Table 3).
We should note (from Fig. 11) that the fitting presented in Eq. 3 is suitable for the flux range SSbreak-2 (2.710-10 ph/cm2/s), which is well described by the 2WHSP-FGL subsample even without incorporating the 150 new -ray detections. In fact, our new detections mainly address the problem of incompleteness at S 2.710-10 ph/cm2/s, as evidenced from Fig. 12. However, we are now confident of extrapolating Eq. 3 down to Smin=6.010-11 ph/cm2/s only because our new detections push to a lower flux threshold. We emphasise that the measured -ray LogN-LogS was calculated without corrections for non-uniform Fermi-LAT exposure. Therefore, the total flux estimated when extrapolating the LogN-LogS to lower fluxes should be regarded as a lower bound to the true contribution of HSP blazars in the 1-100 GeV band, bearing in mind that HSPs have increasing relevance for the high-energy channels (Table 1).
Other intervening factors to mention, that may add corrections to the LogN-LogS fitting are:
-
•
The point spread function (PSF) and effective area from Fermi-LAT depends on energy, therefore the true sensitivity-limits rely on the intrinsic source spectrum properties.
-
•
The data taken mode is turned off during Fermi-LAT passages along the South Atlantic Anomaly inducing 15% sensitivity differences between North and South hemisphere.
-
•
Another bias is related to the incompleteness introduced by the poor all-sky coverage in X-rays, and probably an extra component owing to limitations imposed by current radio surveys (SUMMS and NVSS) that were used when building the 2WHSP sample. Evolution of the HSP Population could play an important role as well and demands further investigation.
Therefore, a refined representation of the -ray LogN-LogS for HSP blazars demands further corrections (see Ackermann et al. (2016a) for a practical example) that needs to incorporate parameters like the Fermi-LAT detection efficiency, sensitivity non-uniformities along the sky, and selection-efficiency of current blazar catalogs.
6 Addressing unassociated sources and confusion
In Sect. 2 we described the selection of 400 2WHSP sources to search for their -ray signatures using the Fermi Science Tools. Before any likelihood analysis takes place, we inspect the region within 60’ radius from all candidates, considering multi-frequency databases from radio to -rays (using the Sky-Explorer Tool at tools.asdc.asi.it). In this process, we found four cases where the 2WHSP -ray candidates were close to one of the 3FGL sources, but outside, or at the border of, 3FGL error-circles. In the following we study these fields in more details by working with energy dependent TS maps, trying to improve the -ray signature description and confirm the association.
The cases studied are 3FGL J0536.4-3347, 3FGL J0935.1-1736, 3FGL J0421.6+1950, and 3FGL J1838.5-6006; well representative examples of how a multi-frequency approach can lead to refined scientific products, especially for -ray confused sources.
In particular we draw attention to 3FGL J0935.1-1736 and 3FGL J0421.6+1950 which are currently unassociated. As known, a large number of 3FGL objects (1058) have no official association to date, despite the fact that many of them have blazars and AGNs as main association-candidates (especially the 541 unassociated -ray sources out of the Galactic plane 10∘ (Fujinaga et al., 2015; Doert & Errando, 2013)). Although a clear picture that accounts for the large fraction of unassociated 3FGL source is yet to be build, there is evidence of sources that are not clearly related to pulsars nor to AGNs (Acero et al., 2013). In this context, any new association may help to clarify the true nature of current unassociated -ray source, and therefore we report on those two cases for which we propose new associations.
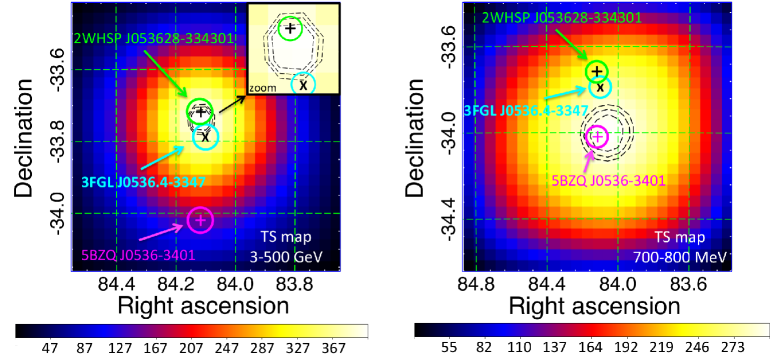
6.1 3FGL J0536.4-3347: a case of source confusion
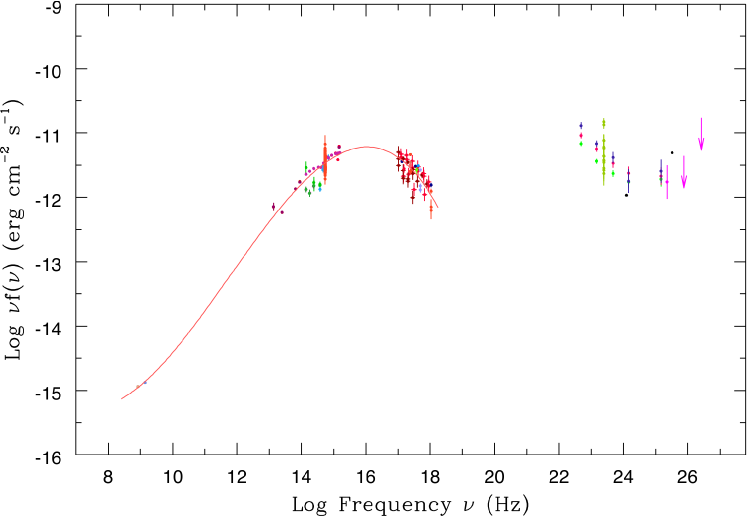
Source 3FGL J0536.4-3347 is one of the unassociated -ray detections in the 3FGL catalog. At this sky position the 2FHL catalog (Ackermann et al., 2016b) reports the source 2FHLJ0536.4-3342, which has been associated with 5BZBJ0536-3343 (=2WHSPJ053628.9-334301) with SED shown in Fig. 13. The -ray description of this source is very rich, being detected in the 1FGL, 2FGL and 3FGL catalogs (blue/red/green points); pink dots and u.l. correspond to the 2FHL counterpart at E50 GeV. For this case, there is a steep+hard component (fig 13) in the -ray SED, which may be hard to explain as intrinsic emission from a single source.
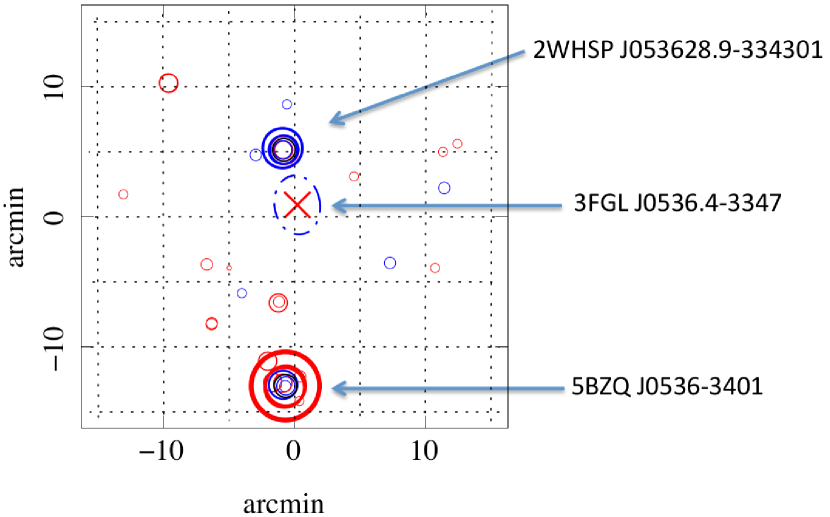
Exploring the sky area around 3FGL J0536.4-3347 with the ASDC error circle tool (Fig. 14) we note that blazar 2WHSP J053628.9-334301 is just outside the -ray error ellipse; Also, there is a bright FSRQ (5BZQ J0536-3401) within 15’ from the 3FGL source, and it could contribute to the overall -ray flux that is observed.
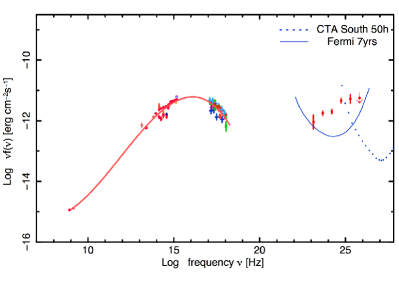
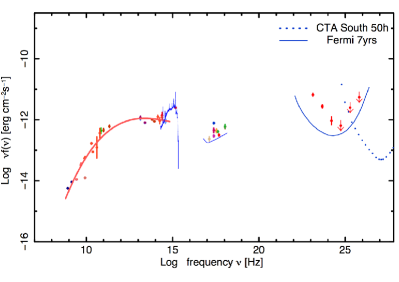
A likelihood analysis, assuming two -ray sources instead of one (with position corresponding to 5BZQ J0536-3401 and 2WHSP J053628.9-334301), results in a model adjustment with a very large statistical significance for both, as reported in Table 2. Each of the resolved sources is associated with a distinct -ray spectral component (one steep and one hard) in agreement with expectations: hard for the 2WHSP source and steep for the BZQ object, as shown in Fig. 15. We then consider 2WHSP J053628.9-334301 as part of the 2WHSP-FGL sample (with updated -ray parameters), but 5BZQ J0536-3401 does not count as part of the 150 new detections associated with 2WHSP blazars (since this source is not an HSP).
| Source | (10-13) | TS | |
|---|---|---|---|
| 5BZQ J0536-3401 | 17.820.97 | 2.750.05 | 813.9 |
| 2WHSP J053628.9-334301 | 7.080.84 | 1.760.05 | 482.8 |
To validate our modelling, we also calculated TS maps for the region, taking into consideration different energy bands: 3-500 GeV (high-energy map), and 700-800 MeV (lower-energy map191919In the lower-energy map we use lower resolution, to account for the larger PSF with respect to high-energy photons. In this case, the particular lower-energy range was chosen to try to balance between “going to the lowest energies probed by Fermi-LAT” and “still acceptable computation time” of the order of two weeks. A lower energy range could be used, but since it is a bright -ray source, photon-counts (and therefore computation time) escalate very rapidly.).
We build the high-energy map so that the hard -ray spectrum source dominates, driving the TS-map peak over the 2WHSP J053628.9-334301, left side of Fig. 16. The lower-energy map was build so that the steeper source dominates, driving the TS peak over 5BZQ J05363401, right side of Fig. 16. This approach can be applied for disentangling confused -ray components within 10’-15’, just as shown in Fig. 15 where we plot the resolved SED for both sources. One of the main reasons for source confusion is related to the PSF strong dependence on photon energy. The final position associated to the confused -ray sources is misplaced from their real counterparts, since the arrival direction of photons originating from distinct source are competing. In the case of close-by sources with steep/hard components, the improved PSF at high-energies may favour the association with the hard -ray spectrum sources (as seen in Fig. 14).
The source 2WHSP J053628.9334301 is a promising candidate for observation with Imaging Atmosphere Cherenkov Telescope (IACTs) and probably a future targets for the CTA-South array (Rieger et al., 2013). Therefore, any dedicated -ray analysis has strong motivations, especially when modelling the high-energy component of TeV candidates properly. In this case we have combined multi-frequency knowledge of potential GeV-TeV emitters with information from the TS-maps, showing that higher quality scientific products can be extracted from the currently available data bases.
Other cases that have their -ray SED characterised by steep + hard component may help to identify potential cases of confusion. Source confusion between objects with similar photon spectral index seems harder to identify, but a multi-frequency study in the vicinity of each -ray detection is useful to evaluate the presence of potential -ray emitters. In a hypothetical case, where a steep+hard -ray spectrum could emerge from a single source (multiple blobs scenario), the present treatment would help to evaluate/rule-out the possibility of source confusion for any candidate under study.
6.2 Solving a case of source confusion for the unassociated source 3FGL J0935.1-1736
The source 3FGL J0935.1-1736 is one of the unassociated 3FGL objects. Here we provide strong evidence for source confusion in -rays involving two objects: a blazar candidate (brighter -ray source in the field) and 2WHSP J093430.1-172120 (fainter -ray source in the field). In Fig. 17 we study the -ray signature in the 3-500 GeV band, to revel the TS distribution that is based on improved PSF photons. For the left-grid marked with TS map, we removed the 3FGL source from the input-model, to show the TS distribution without any bias from the 3FGL catalog. As can be seen, the TS peak matches the 3FGL position (within 99% confinement radius, shown as dashed green line), but the -ray signature clearly extends towards the 2WHSP source, embracing it with high-significance .
To test if the extended signature is due to an extra -ray source in the field, we built a residual map, as shown in Fig.17, right. It corresponds to a TS map that considers the 3FGL J0935.1-1736 source is in the background (therefore, it is part of the input-model and positioned at the center of the magenta circle). In this case, the TS distribution is a result of excess photons with respect to the modelled background, which includes point sources and the diffuse component. Clearly, the residual map shows our 2WHSP blazar matching the TS peak, well within the 68% containment region for the -ray signature.
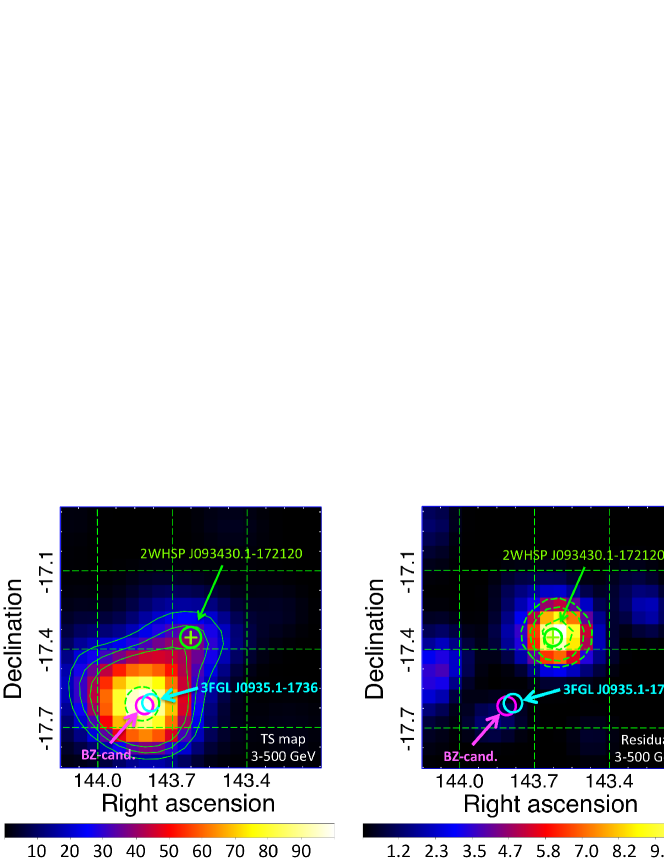
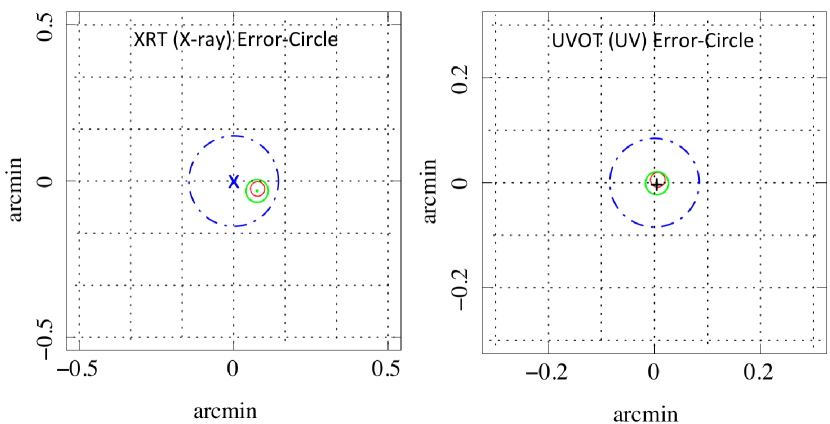
This is clearly a case of source confusion where the 2WHSP is a counterpart for the residual -ray signature, and the brighter source is a counterpart of an, as yet, unidentified object. However, when inspecting this region searching information from other wavelengths, we find the radio-source NVSS J093514-173658 (Fig.18, in red). Recent measurements with Swift satellite XRT/UVOT show both UV and an X-ray signatures matching the radio source within their error ellipses (Fig.18). Together with IR, optical, UV and X-ray counterparts we study the multi-frequency SED for NVSS J093514-173658 which turns to be a blazar candidate202020The term blazar candidate refers to a source with multi-frequency SED characteristic of blazars, but missing optical identification (optical spectrum is not available). with synchrotron-peak parameters 1015.0 Hz and =10-12.0 ergs/cm2/s, marked as BZ-cand in Fig. 17, and probable counterpart for the high-significance TS peak.
| Source | (10-13) | TS | |
|---|---|---|---|
| NVSSJ093514-173658 | 3.460.87 | 1.920.12 | 102.9 |
| 2WHSP J093430.1-172120 | 1.260.73 | 1.870.24 | 21.7 |
A likelihood analysis that considers two sources (with positions corresponding to the 2WHSP and NVSS, removing the 3FGL from the field) results in a relatively good adjustment, as shown in Table 3. Although the blazar candidate could be of HSP type, it is not part of the 2WHSP catalog (because the X-ray data was not available at the time of the sample selection) and therefore we do not count it within the 2WHSP-FGL -ray subsample; the source 2WHSP J093430.1-172120 is considered a lower-significance -ray detection, so we count it within the 150 sources listed in Table Searching for -ray signature in WHSP blazars: .
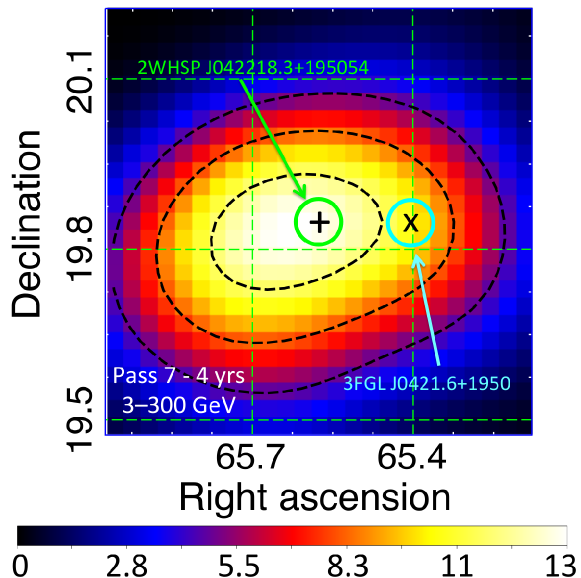
6.3 Improved position for the unassociated source 3FGL J0421.6+1950
In Fig. 19 we show a chart that includes the 3FGL J0421.6+1950 source (indicated with a red ) and its corresponding error-ellipse, which is determined over the entire Fermi-LAT energy range. However, it is well known that the detection of lower-energy photons (E1 GeV) from point-like sources have large PSF, so that the -ray signature can spread along a region of the order of 1∘, as shown in the right side of Fig. 16.
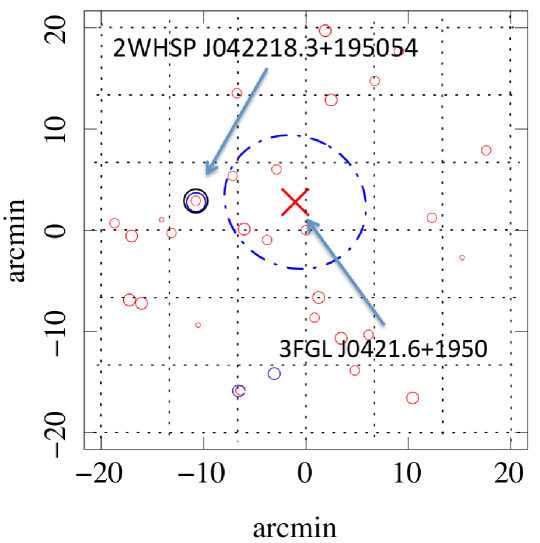
Since the unassociated 3FGL J0421.6+1950 is 10’ away from a 2WHSP source (see Fig. 19), we tried to better evaluate the -ray signature localization by studying the high-energy TS map (E3 GeV), which benefits from smaller PSF with respect to lower-energy photons.
For the TS map in Fig. 20, we removed 3FGL J0421.6+1950 from the model-input so that the TS distribution has no bias from previous -ray catalogs. The TS map peaks at the position of 2WHSP J042218.3+195054 (thick green circle centered on +) well within the 68% confinement region for the -ray signature, which is 9.7’ away from the position reported in the 3FGL catalog (thick circle centered on ). This source is taken as part of the 2WHSP-FGL subsample, using 3FGL parameters to describe it (since there is no -ray confusion in this particular case).
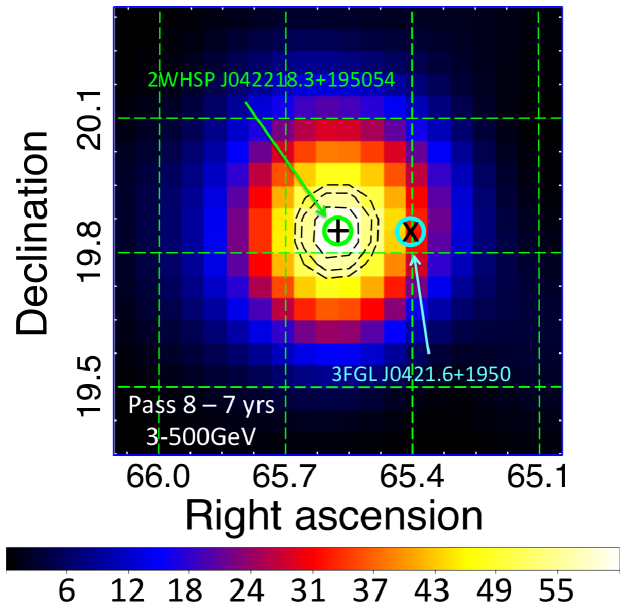
Although the 3FGL positions are based on information associated with the full energy band 0.1-300 GeV, we attempted to improve the -ray signature localization by selecting only high-energy photons that are know to have better PSF. In fact, we also improve the localization owing to longer exposure time (since we now integrate along seven years of Fermi-LAT observations instead of four years in the 3FGL), but it is important to mention that the high-energy maps, integrated over four years of Pass 7 data (with the same analysis setup used to build the 3FGL catalog, as described in Sect. 4.4) already enabled this kind of study, as seen in Fig. 21. Probably, when using the full energy range from Fermi-LAT (0.1-500 GeV), lower-energy photons with the largest position uncertainties could be degrading the final source localization. Indeed, based on currently available data, there is room for improvements which may bring complementary and relevant information for describing the -ray sky.
Working with high-energy TS maps proved to be very useful when searching for candidate-counterparts of current unassociated -ray sources, and could be applied systematically as a complementary refinement for the building of upcoming catalogs with the potential to improve source localization for the whole -ray sample. In the next subsection, we discuss a case where the 3FGL association has already been done, but we still improve the -ray localization using high-energy TS maps.
6.4 Improved position for the 3FGL J1838.5-6006 source
Here we study 3FGL J1838.5-6006, which is associated with the radio-source SUMSS J183806-600033 (2WHSP J183806.7-600032).
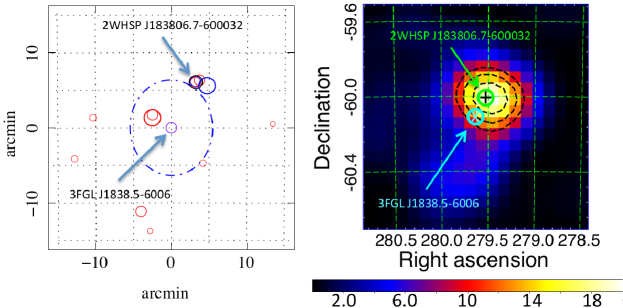
In this case, the 2WHSP blazar is just at the border of the 3FGL error-circle (Fig. 22, left) and therefore we try improving the -ray source localization by working only with high-energy photons only. As shown in Fig. 22, the high-energy TS peak is few arcminutes away from the 3FGL position, and matches our 2WHSP source (which is within the 68% confinement radius for the -ray signature).
Although the association is correct, this is another example where we could improve the -ray signature localization (6.9’ drift) just by working with E3 GeV photons. We also study this region at a lower-energy band (850-950 MeV) and there is no evidence of another close-by source that could be the cause of the offset position. Therefore, it could be that, for some cases the determination of the source position based on the broadband counts 0.1-500 GeV is non optimal, probably because of the large PSF associated with lower-energy photons. Building high-energy TS maps may help to improve source positioning, especially for cases with hard -ray spectrum, as shown for 3FGL J0421.6+1950 and 3FGL J1838.5-6006.
7 Conclusions perspectives
The 2WHSP catalog was built to select promising VHE candidates for the present and future generation of Cherenkov Telescope Arrays, therefore we have tested the efficiency of a direct search for -ray signatures associated with 2WHSP blazars, achieving significant results.
We have detected 150 -ray excess signals out of 400 seed positions based on 2WHSP sources that had no counterpart in previous 1FGL, 2FGL, and 3FGL catalogs. A total of 85 sources were found with high-significance with TS25, and we also report on 65 lower-significance detections with TS between 10 to 25. The 150 new -ray sources presented in Table Searching for -ray signature in WHSP blazars: are named with acronym 1BIGB (first version of the Brazil ICRANet Gamma-ray Blazar catalog) which corresponds with the 2WHSP seed-positions used for our likelihood analysis. Clearly, the subsample of 2WHSP blazars that have not yet been detected by Fermi-LAT is a key representative population of faint -emitters, and we show how the new detections down to TS10 level can probe the faint-end of the flux-distribution (see Fig. 8 and 9). As discussed in Sect. 4.3, a -ray source-search based on the seed positions from HSP blazars can be used to unveil faint HE sources down to TS=10 without compromising the -ray sample with spurious detections.
Our current work enabled us to associate a relevant fraction of the IGRB to a population of faint -ray emitters that had been previously unresolved. Moreover, we show the increasing relevance of faint-HSPs for the IGRB composition with respect to energy (see Table 1), specially for E10 GeV, reaching 6-8 in the 100-200 GeV band. Motivated by this first assessment, we plan to perform a complete -ray analysis of the 2WHSP sample, down to the lowest fluxes, and probably extend the search to other blazar families with potential to improve the -ray description of lower-significance -ray blazars, also helping to constrain the origins of the extragalactic diffuse -ray background.
We have worked out the possibility of solving source confusion when considering multi-frequency data for identifying potential -ray emitters in a certain ROI, and building energy dependent TS maps to help disentangle hard-steep components from confused sources.
We also addressed cases of unassociated 3FGL sources by studying high-energy TS maps to evaluate possible counterparts. This could be a key for solving cases of unassociated -ray sources (just as discussed in Sect. 6.2, 6.3 and 6.4) showing that we can improve the -ray signature localization based on currently available databases. Certainly, it is interesting to evaluate if this kind of approach could be applied systematically as a complementary refinement for the building of upcoming -ray catalogs.
Acknowledgements.
BA is supported by the Brazilian Scientific Program Ciências sem Fronteiras from Cnpq, YLC is supported by the Government of the Republic of China (Taiwan). We thank ICRANet and Prof. Carlo Bianco for the cooperation that enabled us to perform part of the data reduction at Joshua Cluster, Rome-Italy. We thank the Centro Nacional de Supercomputação (CESUP) Porto Alegre-Brazil, and Carlos Brandt, for the cooperation that enabled us to perform part of the data reduction using CESUP machines; This work was supported by the ASDC, Agenzia Spaziale Italiana Science Data Center; and University La Sapienza of Rome, Department of Physics. We thank the guidance and comments from Prof. Paolo Giommi, and the special attention from Dr. Dario Gasparrini, Dr. Sara Cutini, Dr. Stefano Ciprini and Prof. Toby Brunett. This publication makes use of public data products and software from Fermi-LAT collaboration. We also make use of archival data and bibliographic information obtained from the NASA/IPAC Extragalactic Database (NED), data and software facilities from the ASDC managed by the Italian Space Agency (ASI).References
- Abdo et al. (2010) Abdo, A. A., Ackermann, M., Agudo, I., et al. 2010, ApJ, 716, 30
- Abdo et al. (2010) Abdo, A. A., Ackermann, M., Ajello, M., et al. 2010, ApJS, 188, 405
- Acero et al. (2015) Acero, F., Ackermann, M., Ajello, M., et al. 2015, ApJS, 218, 23
- Acero et al. (2013) Acero, F., Donato, D., Ojha, R., et al. 2013, ApJ, 779, 133
- Ackermann et al. (2015a) Ackermann, M., Ajello, M., Albert, A., et al. 2015a, ApJ, 799, 86
- Ackermann et al. (2016a) Ackermann, M., Ajello, M., Albert, A., et al. 2016a, Physical Review Letters, 116, 151105
- Ackermann et al. (2012) Ackermann, M., Ajello, M., Albert, A., et al. 2012, Phys. Rev. D, 85, 083007
- Ackermann et al. (2011) Ackermann, M., Ajello, M., Allafort, A., et al. 2011, ApJ, 743, 171
- Ackermann et al. (2015b) Ackermann, M., Ajello, M., Atwood, W. B., & Baldini, e. a. 2015b, ApJ, 810, 14
- Ackermann et al. (2016b) Ackermann, M., Ajello, M., Atwood, W. B., et al. 2016b, ApJS, 222, 5
- Actis et al. (2011) Actis, M., Agnetta, G., Aharonian, F., et al. 2011, Experimental Astronomy, 32, 193
- Ajello et al. (2015) Ajello, M., Gasparrini, D., Sánchez-Conde, M., et al. 2015, ApJ, 800, L27
- Alam et al. (2015) Alam, S., Albareti, F. D., Allende Prieto, C., et al. 2015, ApJS, 219, 12
- Ando et al. (2014) Ando, S., Benoit-Lévy, A., & Komatsu, E. 2014, Phys. Rev. D, 90, 023514
- Arsioli et al. (2015) Arsioli, B., Fraga, B., Giommi, P., Padovani, P., & Marrezi, P. M. 2015, A&A
- Atwood et al. (2009) Atwood, W. B., Abdo, A. A., Ackermann, M., et al. 2009, ApJ, 697, 1071
- Bernlöhr et al. (2013) Bernlöhr, K., Barnacka, A., Becherini, Y., et al. 2013, Astroparticle Physics, 43, 171
- Błażejowski et al. (2005) Błażejowski, M., Blaylock, G., Bond, I. H., et al. 2005, ApJ, 630, 130
- Campana et al. (2016) Campana, R., Massaro, E., & Bernieri, E. 2016, Ap&SS, 361, 183
- Campana et al. (2015) Campana, R., Massaro, E., Bernieri, E., & D’Amato, Q. 2015, Ap&SS, 360, 19
- Chang et al. (2016) Chang, Y.-L., Arsioli, B., Giommi, P., & Padovani, P. 2016, ArXiv e-prints
- Cohen et al. (2007) Cohen, A. S., Lane, W. M., Cotton, W. D., et al. 2007, AJ, 134, 1245
- Condon et al. (1998) Condon, J. J., Cotton, W. D., Greisen, E. W., et al. 1998, AJ, 115, 1693
- Cuoco et al. (2012) Cuoco, A., Komatsu, E., & Siegal-Gaskins, J. M. 2012, Phys. Rev. D, 86, 063004
- Danforth et al. (2010) Danforth, C. W., Keeney, B. A., Stocke, J. T., Shull, J. M., & Yao, Y. 2010, ApJ, 720, 976
- D’Elia et al. (2013) D’Elia, V., Perri, M., Puccetti, S., et al. 2013, A&A, 551, A142
- Di Mauro (2015) Di Mauro, M. 2015, in 5th International Fermi Symposium Nagoya, Japan, October 20-24, 2014
- Di Mauro et al. (2014) Di Mauro, M., Donato, F., Lamanna, G., Sanchez, D. A., & Serpico, P. D. 2014, ApJ, 786, 129
- Dixon (1970) Dixon, R. S. 1970, ApJS, 20, 1
- Doert & Errando (2013) Doert, M. & Errando, M. 2013, in Proceedings of the 33rd International Cosmic Ray Conference, Rio de Janeiro 2-9 July 2013
- Eddington (1913) Eddington, A. S. 1913, MNRAS, 73, 359
- Elvis et al. (1992) Elvis, M., Plummer, D., Schachter, J., & Fabbiano, G. 1992, ApJS, 80, 257
- Evans et al. (2010) Evans, I. N., Primini, F. A., Glotfelty, K. J., et al. 2010, ApJS, 189, 37
- Fornasa & Sánchez-Conde (2015) Fornasa, M. & Sánchez-Conde, M. A. 2015, Phys. Rept., 598, 1
- Franceschini et al. (2008) Franceschini, A., Rodighiero, G., & Vaccari, M. 2008, A&A, 487, 837
- Fujinaga et al. (2015) Fujinaga, Y., Niinuma, K., Kimura, A., et al. 2015, Publications of the Astronomical Society of Japan
- Furniss et al. (2013) Furniss, A., Williams, D. A., Danforth, C., et al. 2013, ApJ, 768, L31
- Giommi & Padovani (2015) Giommi, P. & Padovani, P. 2015, MNRAS, 450, 2404
- Gregory et al. (1996) Gregory, P. C., Scott, W. K., Douglas, K., & Condon, J. J. 1996, ApJS, 103, 427
- Harris et al. (1996) Harris, D. E., Forman, W., Gioa, I. M., et al. 1996, VizieR Online Data Catalog, 9013, 0
- Harris et al. (1993) Harris, D. E., Forman, W., Gioia, I. M., et al. 1993, The Einstein Observatory catalog of IPC X ray sources. Volume 1E: Documentation
- Inoue (2014) Inoue, Y. 2014, Fifth Fermi Symposium Proceedings, Nagoya, Japan.
- Krawczynski et al. (2004) Krawczynski, H., Hughes, S. B., Horan, D., et al. 2004, ApJ, 601, 151
- Malyshev & Hogg (2011) Malyshev, D. & Hogg, D. W. 2011, ApJ, 738, 181
- Masetti et al. (2013) Masetti, N., Sbarufatti, B., Parisi, P., et al. 2013, A&A, 559, A58
- Massaro et al. (2015) Massaro, E., Maselli, A., Leto, C., et al. 2015, Ap&SS, 357
- Massaro et al. (2011) Massaro, F., D’Abrusco, R., Ajello, M., Grindlay, J. E., & Smith, H. A. 2011, The Astrophysical Journal Letters, 740, L48
- Mattox et al. (1996) Mattox, J. R., Bertsch, D. L., Chiang, J., et al. 1996, ApJ, 461, 396
- Nieppola et al. (2007) Nieppola, E., Tornikoski, M., Lähteenmäki, A., et al. 2007, AJ, 133, 1947
- Nolan et al. (2012) Nolan, P. L., Abdo, A. A., Ackermann, M., et al. 2012, ApJS, 199, 31
- Padovani & Giommi (1995) Padovani, P. & Giommi, P. 1995, ApJ, 444, 567
- Padovani et al. (2016) Padovani, P., Resconi, E., Giommi, P., Arsioli, B., & Chang, Y. L. 2016, MNRAS, 457, 3582
- Pita et al. (2014) Pita, S., Goldoni, P., Boisson, C., et al. 2014, A&A, 565, A12
- Prokhorov & Churazov (2014) Prokhorov, D. A. & Churazov, E. M. 2014, A&A, 567, A93
- Puccetti et al. (2011) Puccetti, S., Capalbi, M., Giommi, P., et al. 2011, A&A, 528, A122
- Rieger et al. (2013) Rieger, F. M., de Oña-Wilhelmi, E., & Aharonian, F. A. 2013, Frontiers of Physics, 8, 714
- Rosen et al. (2015) Rosen, S. R., Webb, N. A., Watson, M. G., et al. 2015, ArXiv e-prints, Submitt. to A&A
- Sahu et al. (2016) Sahu, S., Miranda, L. S., & Rajpoot, S. 2016, European Physical Journal C, 76, 127
- Saxton et al. (2008) Saxton, R. D., Read, a. M., Esquej, P., et al. 2008, A&A, 480, 611
- Sbarufatti et al. (2005) Sbarufatti, B., Treves, A., Falomo, R., et al. 2005, AJ, 129, 559
- Shaw et al. (2013a) Shaw, M. S., Filippenko, A. V., Romani, R. W., Cenko, S. B., & Li, W. 2013a, AJ, 146, 127
- Shaw et al. (2013b) Shaw, M. S., Romani, R. W., Cotter, G., et al. 2013b, ApJ, 764, 135
- Vanden Berk et al. (2001) Vanden Berk, D. E., Richards, G. T., Bauer, A., et al. 2001, AJ, 122, 549
- Voges et al. (1999) Voges, W., Aschenbach, B., Boller, T., et al. 1999, A&A, 349, 389
- Voges et al. (2000) Voges, W., Aschenbach, B., Boller, T., et al. 2000, IAU Circ., 7432, 3
- Warren et al. (2007) Warren, S. J., Cross, N. J. G., Dye, S., et al. 2007, ArXiv Astrophysics e-prints: astro-ph/0703037
- Watson et al. (2009) Watson, M. G., Schröder, A. C., Fyfe, D., et al. 2009, A&A, 493, 339
- White & Becker (1992) White, R. L. & Becker, R. H. 1992, ApJS, 79, 331
- White et al. (1997) White, R. L., Becker, R. H., Helfand, D. J., & Gregg, M. D. 1997, ApJ, 475, 479
- Wright et al. (2010) Wright, E. L., Eisenhardt, P. R. M., Mainzer, A. K., et al. 2010, AJ, 140, 1868
[x]llrc—cccc
The 150 new -ray signatures detected down to TS10 level are named with the acronym 1BIGB (for the first version of “Brazil ICRANet Gamma-ray Blazar” catalog) with coordinates corresponding to those of 2WHSP seeds used for the likelihood analysis. The first three columns show respectively the 1BIGB source names, right ascension “R.A.” and declination “Dec.” in degrees (J2000). The fourth column shows the reported redshifts from literature (Shaw et al. 2013b; Pita et al. 2014; Furniss et al. 2013; Danforth et al. 2010; Shaw et al. 2013a; Masetti et al. 2013; Sbarufatti et al. 2005; Massaro et al. 2015), flag “?” is used for values reported as uncertain; lower limit are marked with “” (all lower-limits shown here were derived in Arsioli et al. 2015; Chang et al. 2016), and sources with currently absent redshift were given “0.” value. The -ray model parameters from Fermi Science Tools assume a power law to describe the spectrum within the studied energy range 0.3-500 GeV. The parameter “” (see eq. 1) is given in units of [ph/cm2/s/MeV], and “” is the spectral photon index, which are direct outputs from the likelihood analysis over 7.2 years of Fermi-LAT data in the 0.3-500 GeV band; those results consider the pivot energy fixed as E0=1 GeV. The column “Flux” gives the photon counts in units of [ph/cm2/s] calculated by integrating eq. 1 along the energy range 1-100 GeV. Sources marked with (a) are also reported in the 2FHL catalog (Ackermann et al. 2016b), and sources marked with (b) were reported as possible counterparts of photon clustering detected by Fermi-LAT at E10 GeV (Campana et al. 2015). Source 2WHSPJ194356.2+211821 is the single case located at b10∘ (see footnote 2).
1BIGB Source name R.A.(deg.) Dec.(deg.) z (10-13) TS Flux
\endfirstheadcontinued.
1BIGB Source name R.A.(deg) Dec.(deg) z (10-13) TS Flux
\endhead\endfoot1BIGB J000949.6431650 2.45708 43.28056 0.56 2.10 0.15 2.22 0.48 67.0 2.0
1BIGB J001328.8+094929 3.37000 9.82500 0. 2.35 0.23 2.07 0.68 16.0 1.53
1BIGB J001527.8+353638 3.86625 35.61083 0.57 1.98 0.23 1.17 0.57 25.1 1.18
1BIGB J002928.6+205332 7.36917 20.89250 0. 1.46 0.22 0.31 0.23 23.8 0.6
1BIGB J004146.9470136 10.44583 47.02667 0. 1.73 0.27 0.46 0.28 14.0 0.6
1BIGB J005816.6+172312 14.56958 17.38694 0. 1.80 0.25 0.85 0.52 20.4 1.02
1BIGB J010250.8200158 15.71208 20.03278 0.38 1.55 0.22 0.34 0.22 17.3 0.57
1BIGB J011501.6340027 18.75708 34.00750 0.48 1.49 0.17 0.53 0.29 54.0 0.97
1BIGB J012657.1+330730 21.73833 33.12500 0. 2.27 0.26 1.45 0.54 14.2 1.13
1BIGB J014040.8075849 25.17000 7.98028 0.49 1.78 0.14 1.40 0.43 49.0 1.73
1BIGB J020106.1+003400 30.27542 0.56667 0.298 1.82 0.28 0.58 0.38 12.0 0.7
1BIGB J020412.9333339(b) 31.05375 33.56111 0.617 1.78 0.20 0.76 0.36 22.8 0.95
1BIGB J021205.6255757 33.02375 25.96611 0. 1.93 0.16 1.63 0.47 44.4 1.71
1BIGB J021216.8022155 33.07000 2.36528 0. 1.94 0.19 1.48 0.53 35.2 1.54
1BIGB J021631.9+231449 34.13333 23.24722 0.288 1.89 0.11 2.90 0.64 102.0 3.19
1BIGB J022048.4084250 35.20167 8.71389 0.43 1.74 0.19 0.85 0.40 32.4 1.11
1BIGB J023340.9+065611 38.42042 6.93639 0. 2.05 0.19 2.72 1.10 52.0 2.56
1BIGB J023430.5+804336 38.62750 80.72694 0. 1.65 0.20 0.44 0.28 18.2 0.65
1BIGB J030103.7+344100 45.26542 34.68361 0.24 2.30 0.15 3.43 0.69 43.1 2.63
1BIGB J030330.1+055429 45.87542 5.90833 0.196 1.46 0.24 0.36 0.31 22.0 0.69
1BIGB J030433.9005403(a) 46.14125 0.90111 0.511 1.70 0.17 0.85 0.41 30.4 1.17
1BIGB J030544.1+403509 46.43375 40.58611 0. 1.84 0.28 0.71 0.53 12.4 0.83
1BIGB J031103.1440227 47.76333 44.04111 0. 2.02 0.32 0.93 0.44 13.5 0.9
1BIGB J031423.8+061955 48.59958 6.33222 0.62? 1.79 0.12 2.26 0.65 69.9 2.76
1BIGB J032009.1704533 50.03833 70.75917 0. 1.75 0.21 0.65 0.33 21.7 0.83
1BIGB J032037.9+112451 50.15833 11.41444 0. 2.17 0.28 1.75 0.98 10.0 1.48
1BIGB J032056.2+042447 50.23458 4.41333 0. 2.68 0.21 3.62 0.71 32.3 2.15
1BIGB J032647.2340446 51.69708 34.07972 0. 1.99 0.14 1.70 0.42 52.7 1.7
1BIGB J032852.6571605 52.21917 57.26806 0. 1.60 0.20 0.47 0.26 29.6 0.73
1BIGB J033623.7034738(b) 54.09875 3.79389 0.162 1.61 0.23 0.49 0.33 22.0 0.75
1BIGB J033831.9570447 54.63333 57.08000 0. 1.63 0.23 0.42 0.27 20.7 0.63
1BIGB J035856.1305447 59.73375 30.91306 0.65? 1.88 0.14 1.60 0.44 57.6 1.77
1BIGB J041112.2394143 62.80125 39.69528 0.7 1.81 0.22 0.52 0.28 11.6 0.62
1BIGB J041238.3392629 63.16000 39.44139 0. 1.93 0.24 0.65 0.34 11.4 0.69
1BIGB J042900.1323641 67.25042 32.61139 0.51 1.89 0.21 0.92 0.38 18.2 1.01
1BIGB J043517.7262121 68.82375 26.35611 0. 2.52 0.31 1.39 0.48 11.4 0.91
1BIGB J044127.4+150454 70.36417 15.08194 0.109 2.06 0.17 3.49 1.30 45.3 3.26
1BIGB J044240.6+614039(a) 70.66917 61.67750 0. 1.95 0.12 3.30 0.92 94.5 3.42
1BIGB J044328.3415156 70.86833 41.86556 0.39 1.94 0.20 1.10 0.30 33.2 1.16
1BIGB J050335.3111506 75.89750 11.25167 0.57 1.83 0.13 1.76 0.55 59.3 2.06
1BIGB J050419.5095631 76.08125 9.94222 0.46 2.15 0.22 1.49 0.62 14.9 1.28
1BIGB J050601.6382054 76.50667 38.34861 0.182 2.07 0.14 1.81 0.40 41.5 1.67
1BIGB J050727.1334635 76.86333 33.77639 0. 1.72 0.10 1.44 0.36 78.7 1.91
1BIGB J053626.8254748 84.11167 25.79667 0. 1.97 0.17 1.67 0.52 38.4 1.69
1BIGB J053645.2255841 84.18875 25.97806 0. 1.81 0.18 1.15 0.49 33.0 1.39
1BIGB J055716.7061706 89.32000 6.28500 0. 1.79 0.15 1.80 0.73 44.1 2.21
1BIGB J060714.2251859 91.80958 25.31639 0.275 1.93 0.16 1.39 0.43 35.0 1.47
1BIGB J062149.6341148 95.45667 34.19694 0.529 2.50 0.17 3.17 0.64 33.9 2.1
1BIGB J062626.2171045 96.60917 17.17944 0.7 2.05 0.19 2.35 0.83 35.7 2.2
1BIGB J063014.9201236 97.56250 20.21000 0. 1.84 0.27 1.13 0.95 14.9 1.32
1BIGB J065932.8674350 104.88708 67.73056 0. 1.53 0.21 0.37 0.26 23.8 0.63
1BIGB J071745.0552021 109.4375 55.33944 0. 2.16 0.15 2.87 0.64 53.3 2.44
1BIGB J073152.6+280432 112.96958 28.07583 0.248 2.07 0.20 1.63 0.54 27.7 1.5
1BIGB J073329.5+351542 113.37292 35.26167 0.177 2.59 0.30 1.49 0.48 11.7 0.93
1BIGB J075936.1+132116 119.90042 13.35472 0. 1.78 0.13 1.81 0.54 82.1 2.24
1BIGB J080015.4+561107 120.06458 56.18528 0. 1.96 0.11 2.06 0.42 74.8 2.11
1BIGB J080135.8+463824 120.39958 46.64000 0.369 2.30 0.36 1.06 0.52 10.2 0.81
1BIGB J082904.7+175415 127.27000 17.90417 0.089 2.41 0.12 4.69 0.61 94.6 3.3
1BIGB J083724.5+145819 129.35250 14.97222 0.278 2.00 0.22 1.48 0.61 30.7 1.46
1BIGB J085749.8+013530 134.45750 1.59167 0.281 2.51 0.24 1.80 0.55 13.9 1.18
1BIGB J090802.2095936 137.00917 9.99361 0.053 1.82 0.25 0.71 0.47 13.7 0.85
1BIGB J090953.2+310602 137.47167 31.10083 0.272 1.91 0.23 0.73 0.35 13.2 0.78
1BIGB J091322.3+813305 138.34292 81.55139 0.639? 1.49 0.16 0.36 0.17 39.6 0.66
1BIGB J091651.8+523827 139.21625 52.64111 0.19 1.79 0.15 1.04 0.34 54.9 1.26
1BIGB J093239.2+104234(b) 143.16375 10.70972 0.361 2.00 0.16 2.06 0.58 46.7 2.02
1BIGB J093430.1172120 143.62542 17.35583 0. 1.87 0.24 1.26 0.73 21.7 1.42
1BIGB J095224.1+750212(a)(b) 148.10042 75.03694 0.181 1.28 0.16 0.21 0.12 55.0 0.54
1BIGB J095507.9+355100 148.78292 35.85000 0.834 1.88 0.25 0.73 0.40 20.0 0.82
1BIGB J095628.2095719 149.11750 9.95528 0. 1.68 0.25 0.47 0.33 14.6 0.66
1BIGB J095849.8+703959 149.70750 70.66639 0. 2.03 0.20 1.36 0.51 36.6 1.3
1BIGB J102100.3+162554 155.25125 16.43167 0.556 2.34 0.25 2.08 0.61 25.6 1.54
1BIGB J104303.7+005420 160.76583 0.90556 0. 1.73 0.17 1.33 0.55 48.3 1.76
1BIGB J104857.6+500945 162.24000 50.16250 0.402 2.26 0.17 1.63 0.40 28.0 1.28
1BIGB J105534.3012616 163.89292 1.43778 0. 1.78 0.12 2.09 0.59 77.8 2.59
1BIGB J111717.5+000633 169.32292 0.10917 0.451 2.17 0.20 2.18 0.63 29.4 1.84
1BIGB J112317.9323217 170.82500 32.53833 0. 1.88 0.21 1.01 0.46 17.9 1.12
1BIGB J112611.8203723 171.54958 20.62333 0. 2.16 0.24 1.58 0.70 13.7 1.36
1BIGB J113046.0313807(a) 172.69208 31.63528 0.151 1.28 0.21 0.17 0.13 28.0 0.44
1BIGB J113105.2094405 172.77167 9.73500 0. 1.84 0.17 1.23 0.48 34.3 1.43
1BIGB J113444.6172900 173.68625 17.48361 0.571 1.58 0.20 0.55 0.33 24.3 0.88
1BIGB J113755.6171041(a)(b) 174.48167 17.17833 0.6 1.69 0.10 1.80 0.45 90.7 2.48
1BIGB J121158.6+224233 182.99417 22.70917 0.45 1.78 0.18 0.90 0.38 27.6 1.12
1BIGB J121510.9+073203 183.79542 7.53444 0.137 1.78 0.16 1.12 0.41 38.6 1.39
1BIGB J121603.1024304(b) 184.01333 2.71778 0.169 2.30 0.12 3.95 0.64 65.4 3.01
1BIGB J124141.4+344029 190.42250 34.67500 0.7 1.96 0.18 1.31 0.45 32.6 1.34
1BIGB J125015.4+315559 192.56458 31.93306 0. 1.76 0.32 0.57 0.44 16.7 0.72
1BIGB J125341.2393159 193.42167 39.53306 0.179 1.83 0.18 1.40 0.59 37.0 1.64
1BIGB J125847.9044744 194.70000 4.79583 0.586? 1.84 0.20 1.40 0.50 32.9 1.62
1BIGB J130145.6+405623 195.44000 40.94000 0.652 2.08 0.14 2.16 0.46 66.6 1.98
1BIGB J130713.3034430 196.80542 3.74194 0. 2.55 0.20 2.44 0.12 20.5 1.57
1BIGB J132541.8022809 201.42417 2.46944 0.8? 2.16 0.20 1.45 0.70 18.2 1.23
1BIGB J132617.7+122957 201.57375 12.49944 0.204 2.14 0.29 1.20 0.55 12.9 1.04
1BIGB J132833.4+114520 202.13958 11.75556 0.811 2.10 0.20 1.78 0.57 28.0 1.61
1BIGB J133612.1+231958 204.05042 23.33278 0.267 1.92 0.14 1.43 0.38 43.2 1.52
1BIGB J135328.0+560056(b) 208.36667 56.01556 0.404 2.28 0.18 2.23 0.51 48.7 1.73
1BIGB J140629.9393508 211.62500 39.58583 0.37 1.46 0.15 0.40 0.21 26.2 0.76
1BIGB J143342.7730437 218.42792 73.07722 0. 1.26 0.23 0.10 0.09 13.6 0.27
1BIGB J143825.4+120418 219.60625 12.07167 0. 2.02 0.33 0.87 0.57 11.2 0.83
1BIGB J144236.4462300 220.65167 46.38361 0.103 1.98 0.20 3.08 0.08 61.2 3.1
1BIGB J145508.2+192014 223.78417 19.33750 0.115 2.78 0.36 1.75 0.51 13.9 0.98
1BIGB J145543.6760051 223.93167 76.01444 0. 1.54 0.14 0.60 0.26 34.6 1.02
1BIGB J145603.5+504825 224.01500 50.80722 0.49 2.17 0.31 1.56 0.78 23.6 1.32
1BIGB J150637.0054004 226.65458 5.66778 0.518 1.89 0.19 1.42 0.61 28.2 1.57
1BIGB J151041.0+333503 227.67125 33.58444 0.114 1.47 0.28 0.24 0.21 15.6 0.46
1BIGB J151136.8165326 227.90375 16.89056 0.56 2.69 0.35 1.95 0.65 10.1 1.15
1BIGB J151618.7152344 229.07792 15.39556 0.54 2.23 0.22 2.12 0.74 18.5 1.7
1BIGB J151826.5+075222 229.61083 7.87278 0.41 1.70 0.23 0.54 0.34 15.0 0.74
1BIGB J151845.7+061355 229.69042 6.23222 0.102 1.84 0.19 1.30 0.58 31.9 1.5
1BIGB J152646.6153025 231.69417 15.50722 0.43 2.12 0.17 2.86 0.78 40.0 2.51
1BIGB J152913.5+381216 232.30625 38.20472 0.59 1.82 0.19 0.91 0.37 27.5 1.08
1BIGB J154202.9291509 235.51250 29.2525 0. 1.75 0.10 2.44 0.54 100.0 3.14
1BIGB J154625.0285723 236.60417 28.95639 0.6 1.70 0.19 0.65 0.36 14.2 0.89
1BIGB J155053.2082245 237.72167 8.37944 0. 1.93 0.23 1.47 0.76 25.7 1.55
1BIGB J155432.5121324 238.63542 12.22361 0. 1.78 0.14 1.40 0.50 30.2 1.75
1BIGB J160218.0+305108 240.57500 30.8525 0.47 1.95 0.21 0.96 0.40 22.7 0.99
1BIGB J160519.0+542058 241.32917 54.34972 0.212 2.02 0.20 1.17 0.30 35.4 1.13
1BIGB J160618.4+134532 241.57667 13.75889 0.29 2.35 0.24 2.81 0.71 32.4 2.07
1BIGB J161327.1190835 243.36292 19.14333 0. 2.23 0.16 4.11 1.00 34.3 3.31
1BIGB J162115.1003140 245.31333 0.52778 0.52 1.84 0.21 0.91 0.49 13.9 1.06
1BIGB J162330.4+085724 245.87708 8.95667 0.533 1.94 0.26 1.12 0.61 21.6 1.18
1BIGB J162646.0+630047 246.69167 63.01333 0. 1.95 0.15 1.47 0.42 61.5 1.52
1BIGB J164220.2+221143 250.58458 22.19528 0.592 2.13 0.21 1.79 0.66 29.8 1.56
1BIGB J164419.9+454644 251.08333 45.77889 0.225 1.90 0.19 0.97 0.36 31.9 1.06
1BIGB J165517.8224045 253.82458 22.67917 0. 1.89 0.20 1.47 0.70 15.4 1.62
1BIGB J171108.5+024403 257.78583 2.73444 0. 1.87 0.19 1.22 0.55 18.5 1.36
1BIGB J174419.7+185218 266.08250 18.87167 0. 1.61 0.19 0.61 0.33 20.4 0.94
1BIGB J174702.5+493800 266.76042 49.63361 0.46? 2.12 0.17 2.13 0.56 45.5 1.89
1BIGB J184822.4+653656 282.09375 65.61583 0.364 1.58 0.16 0.51 0.24 37.0 0.81
1BIGB J185023.9+263153 282.60000 26.53139 0. 1.77 0.16 1.47 0.61 45.6 1.84
1BIGB J185813.3+432451 284.55583 43.41417 0. 2.28 0.16 2.81 0.58 43.1 2.18
1BIGB J193412.7241919 293.55292 24.32222 0. 1.59 0.14 0.82 0.33 41.2 1.29
1BIGB J194356.2+211821(a) 295.98417 21.30611 0. 1.43 0.20 1.69 0.40 128.0 3.34
1BIGB J200204.0573644 300.51708 57.61250 0. 1.94 0.11 2.42 0.53 69.6 2.52
1BIGB J201200.9771219 303.00375 77.20528 0. 2.07 0.29 1.02 0.69 10.1 0.94
1BIGB J205242.4+081040 313.17708 8.17778 0. 1.46 0.23 0.3 0.20 20.8 0.57
1BIGB J214533.3043438 326.38875 4.57750 0.069 2.81 0.26 2.16 0.56 18.9 1.19
1BIGB J215214.0120540 328.05875 12.09472 0.121 2.30 0.16 4.10 0.91 62.8 3.12
1BIGB J220107.3590639 330.28042 59.11111 0. 1.85 0.21 0.64 0.31 13.0 0.74
1BIGB J220155.8170700 330.48250 17.11667 0.169 2.20 0.32 1.62 0.85 19.3 1.33
1BIGB J221029.5+362159 332.62333 36.36639 0. 2.08 0.29 1.33 0.81 14.7 1.22
1BIGB J221108.2000302(b) 332.78458 0.05056 0.326 1.66 0.16 0.88 0.38 34.3 1.27
1BIGB J223301.0+133601 338.25458 13.60028 0.214 1.60 0.23 0.45 0.32 19.6 0.71
1BIGB J223626.2+370713 339.10958 37.12028 0. 1.84 0.19 1.01 0.50 22.1 1.17
1BIGB J224910.6130002 342.29458 13.00056 0.5 2.23 0.19 2.47 0.68 33.8 1.99
1BIGB J225147.5320611 342.94792 32.10333 0.246 1.75 0.17 1.21 0.47 54.9 1.55
1BIGB J225613.3330338 344.05542 33.06056 0.243 2.29 0.33 1.22 0.54 13.1 0.94
1BIGB J230634.9110347 346.64583 11.06333 0. 2.26 0.26 1.71 0.60 20.1 1.35
1BIGB J232039.7630918 350.16583 63.15500 0.2 1.71 0.17 0.77 0.33 37.8 1.03
1BIGB J233112.8030129 352.80375 3.02500 0. 2.17 0.23 1.69 0.65 17.3 1.43
1BIGB J235320.9145856 358.33750 14.98250 0. 1.54 0.22 0.44 0.28 20.8 0.74
[x]l—cccc
Here we list 30 2WHSPs detected with the largest significance within our -ray likelihood analysis, all having TS45 based Pass 8 Fermi-LAT data when integrating over 7.2 yrs of observations. All those cases were re-evaluated based on Pass 7 data, integrating over the first 4 yrs of mission; in order to reproduce the setup used to prepare the 3FGL catalog (see sec. 4.4 for the setup description). First column show the 2WHSP source name, and following columns list the fitting parameter assuming a power-law model to describe the -ray spectrum in the 0.3-300 GeV band (we integrated up to 300 GeV following Fermi-LAT team recommendations to work with Pass 7); second column lists the photon spectral index , third column lists the pre-factor parameter in 10-13ph/cm2/s/MeV, fourth column list the TS values, and fifth column lists the integral flux [ph/cm2/s] in the 1-100 GeV energy band. For two sources (marked with ) the power-law fitting does not converge well given their significance is too low.
2WHSP Source name (10-13) TS Flux
\endfirstheadcontinued.
2WHSP Source name (10-13) TS Flux
\endhead\endfoot2WHSPJ144236.4462300 1.960.24 2.501.34 15.0 2.57
2WHSPJ154202.9291509 1.520.31 0.520.05 8.9 0.90
2WHSPJ000949.6431650 2.360.30 2.270.77 13.8 1.66
2WHSPJ011501.6340027 1.570.28 0.550.43 11.1 0.89
2WHSPJ014040.8075849 1.870.31 1.030.72 9.1 1.16
2WHSPJ021631.9+231449 2.000.21 2.811.08 26.3 2.78
2WHSPJ023340.9+065611 2.560.81 1.871.98 3.9 1.19
2WHSPJ031423.8+061955 1.900.24 1.991.03 16.3 2.17
2WHSPJ032647.2340446 1.890.19 1.650.62 20.3 1.82
2WHSPJ035856.1305447 1.660.36 0.640.57 8.8 0.92
2WHSPJ044240.6+614039 2.270.31 3.261.77 12.2 2.55
2WHSPJ050335.3111506 1.960.32 1.601.02 9.6 1.64
2WHSPJ050727.1334635 1.660.30 0.640.47 12.0 0.92
2WHSPJ071745.0552021 2.240.40 1.481.01 5.8 1.18
2WHSPJ075936.1+132116 1.610.31 0.660.58 12.2 1.01
2WHSPJ080015.4+561107 1.850.19 1.360.6 19.8 1.56
2WHSPJ082904.7+175415 2.340.21 3.790.98 25.6 2.82
2WHSPJ091651.8+523827 1.760.33 0.660.53 10.0 0.84
2WHSPJ104303.7+005420 1.900.30 1.690.99 17.5 1.84
2WHSPJ105534.3012616 2.060.23 2.480.96 19.5 2.32
2WHSPJ113755.6171041 1.780.22 1.530.75 19.6 1.90
2WHSPJ121603.1024304 2.160.22 3.381.24 25.4 2.89
2WHSPJ130145.6+405623 1.750.22 1.240.60 22.6 1.60
2WHSPJ135328.0+560056 2.110.24 1.730.76 15.7 1.54
2WHSPJ162646.0+630047 2.460.36 1.670.66 8.5 1.14
2WHSPJ194356.2+211821 1.550.17 1.710.91 18.1 2.86
2WHSPJ200204.0573644 2.130.29 1.550.77 5.7 1.36
2WHSPJ215214.0120540 2.460.26 4.861.55 29.5 3.32
2WHSPJ095224.1+750212* 0.760.39 0.020.02 8.3 0.16
2WHSPJ225147.5320611* 0.930.43 0.050.09 6.0 0.27