The role of mergers and halo spin in shaping galaxy morphology
Abstract
Mergers and the spin of the dark matter halo are factors traditionally believed to determine the morphology of galaxies within a CDM cosmology. We study this hypothesis by considering approximately 18,000 central galaxies at with stellar masses – selected from the Illustris cosmological hydrodynamic simulation. The fraction of accreted stars – which measures the importance of massive, recent and dry mergers – increases steeply with galaxy stellar mass, from less than 5 per cent in dwarfs to 80 per cent in the most massive objects, and the impact of mergers on galaxy morphology increases accordingly. For galaxies with , mergers have the expected effect: if gas-poor they promote the formation of spheroidal galaxies, whereas gas-rich mergers favour the formation and survivability of massive discs. This trend, however, breaks at lower masses. For objects with , mergers do not seem to play any significant role in determining the morphology, with accreted stellar fractions and mean merger gas fractions that are indistinguishable between spheroidal and disc-dominated galaxies. On the other hand, halo spin correlates with morphology primarily in the least massive objects in the sample (), but only weakly for galaxies above that mass. Our results support a scenario where (1) mergers play a dominant role in shaping the morphology of massive galaxies, (2) halo spin is important for the morphology of dwarfs, and (3) the morphology of medium-sized galaxies – including the Milky Way – shows little dependence on galaxy assembly history or halo spin, at least when these two factors are considered individually.
keywords:
galaxies: formation – galaxies: haloes – galaxies: interactions – galaxies: kinematics and dynamics – galaxies: structure – methods: numerical1 Introduction
11footnotetext: E-mail: vrg@jhu.eduSince Hubble (1926) proposed his galaxy classification scheme, numerous studies have investigated the physical mechanisms that lead to the formation of spiral and elliptical galaxies. Given the nonlinearity of the physical processes involved, many such studies have used numerical simulation as their main tool, with Toomre & Toomre (1972) and White (1978) being some of the first examples. To this day, one of the main questions in the field of galaxy formation remains to understand which properties of a halo (or its environment) determine the morphology of the galaxy formed at its centre (e.g. Parry, Eke & Frenk, 2009; Stinson et al., 2010; Sales et al., 2012; Teklu et al., 2015; Zavala et al., 2016).
Galactic discs are believed to form through the dissipational collapse of gas in dark matter (DM) haloes, which acquire their angular momentum through tidal torques in the early Universe (Peebles, 1969; Doroshkevich, 1970). Despite the fact that galactic outflows, misaligned gas accretion, and mergers tend to complicate the detailed conservation of specific angular momentum during the formation of a galaxy (e.g. van den Bosch et al., 2002; Brook et al., 2011; Zjupa & Springel, 2017), it is nevertheless expected that the largest galactic discs form preferentially in haloes with higher angular momentum (e.g. Fall & Efstathiou, 1980; Fall, 1983; Mo, Mao & White, 1998). Initial attempts to verify this prediction in cosmological simulations suffered from numerical issues leading to a ‘catastrophic’ loss of angular momentum (Navarro, Frenk & White, 1995), but more recent studies have been able to verify such a trend (e.g. Teklu et al., 2015).
On the other hand, elliptical galaxies are believed to be the remnants of repeated galaxy mergers (Toomre, 1977). This picture gained support as the hierarchical nature of structure formation (White & Rees, 1978) started to become recognized, although a number of objections (e.g. Ostriker, 1980) indicated that the situation was more complicated than this. Subsequent studies using idealized merger simulations have shown that the outcome of a galaxy merger is significantly affected by the masses, gas fractions, and morphologies of the progenitors, as well as by their orbital parameters (e.g. Barnes, 1992; Hernquist, 1992, 1993; Barnes & Hernquist, 1996; Naab & Burkert, 2003; Cox et al., 2006). Because of this, it is necessary to place such merger simulations in a ‘cosmological context’ in order to evaluate the impact of galaxy mergers from a statistical perspective.
A relatively inexpensive way of doing this consists in deriving simple prescriptions from such idealized merger simulations and then combining them with semi-analytic models (SAMs) of galaxy formation (e.g. Khochfar & Silk, 2006; Parry, Eke & Frenk, 2009; De Lucia et al., 2011; Zavala et al., 2012; Avila-Reese, Zavala & Lacerna, 2014; Fontanot et al., 2015; Kannan et al., 2015) or semi-empirical halo occupation models (e.g. Hopkins et al., 2009b; Stewart et al., 2009; Hopkins et al., 2010; Moster, Maccio & Somerville, 2014). A more straightforward approach, although far more computationally expensive, is to run a hydrodynamic cosmological simulation on a large comoving volume and then examine the morphologies of the resulting galaxies directly (see Naab et al. 2014, section 2; Somerville & Davé 2015, section 4.2, for reviews). With this technique, it has been found that both the numerical treatment of hydrodynamics and the feedback implementation can have a dramatic effect on galaxy morphology (e.g. Brook et al., 2004; Okamoto et al., 2005; Governato et al., 2007; Scannapieco et al., 2008, 2012; Ceverino & Klypin, 2009; Sales et al., 2010; Agertz, Teyssier & Moore, 2011; Torrey et al., 2012; Übler et al., 2014; Snyder et al., 2015a; Genel et al., 2015; Agertz & Kravtsov, 2016; Dubois et al., 2016). Despite all the inevitable uncertainties in the modelling of feedback, the latest generation of cosmological hydrodynamic simulations (e.g. Vogelsberger et al., 2014a; Dubois et al., 2014; Schaye et al., 2015) has been able to produce galaxy populations displaying a ‘morphological mix’ that agrees reasonably well with observations.
The latter approach, i.e. using hydrodynamic cosmological simulations to directly investigate the origin of galaxy morphology, has presented some serious puzzles for galaxy formation. For example, by studying a sample of Milky Way-sized simulated galaxies, Sales et al. (2012) found no correlation between galaxy morphology and properties such as halo spin and merging history, challenging the ‘standard’ model of the formation of discs and spheroids. Instead, Sales et al. (2012) proposed that a disc forms when the angular momentum of freshly accreted gas is aligned with that of earlier gas accretion. Furthermore, Zavala et al. (2016) found that galaxy morphology is correlated with the assembly history of the inner DM halo. In particular, they found that the ‘angular momentum loss’ of a galaxy’s stellar component is strongly linked to that of the inner DM halo, whereas the angular momentum history of a galaxy’s cold gas is statistically correlated with that of the whole DM halo.
In this work we explore the origin of discs and spheroids using the Illustris simulation (Vogelsberger et al., 2014a, b; Genel et al., 2014; Sijacki et al., 2015), a hydrodynamic cosmological simulation that has been shown to reproduce several galaxy observables reasonably well, including stellar angular momenta (Genel et al., 2015) and quantitative optical morphologies (Torrey et al., 2015; Snyder et al., 2015b), over a wide range of stellar masses. This makes the Illustris simulation a powerful tool to study the physical mechanisms that shape galaxy morphology in a cosmological context.
The results presented in this paper complement those of Genel et al. (2015), who showed that feedback – both from galactic winds and from active galactic nuclei – is crucial in order to produce simulated galaxies with stellar angular momenta in reasonable agreement with observations. Here, on the other hand, we adopt the fiducial model from the Illustris simulation and focus on how the morphology of a central galaxy at depends on its merging history and on the spin of its host halo.
The current paper is organized as follows. In Section 2 we briefly describe the set of cosmological simulations known as the Illustris Project, along with their merger trees and other post-processed catalogues, and present the galaxy sample considered for this study. An overview of galaxy morphology in the Illustris simulation, covering a wide range of stellar masses, is presented in Section 3. In Section 4 we investigate the dependence of galaxy morphology on merging history (Section 4.1), halo spin (Section 4.2), and a combination of both (Section 4.3). Finally, we summarize and discuss our results in Section 5.
2 Methodology
2.1 The Illustris and Illustris-Dark simulations
We use hydrodynamic and -body simulations from the Illustris Project (Vogelsberger et al., 2014a, b; Genel et al., 2014; Sijacki et al., 2015), a set of cosmological simulations of a periodic cube of 106.5 Mpc on a side, carried out with the moving-mesh code arepo (Springel, 2010). The main simulation considered in this study, known simply as the Illustris simulation, evolves DM particles with a mass of , along with approximately baryonic resolution elements (stellar particles or gas cells) with an average mass of . The simulation features a physical model of galaxy formation (Vogelsberger et al., 2013; Torrey et al., 2014) which has been shown to reproduce various galaxy observables, including several which were not used in the calibration of the model (e.g. Sales et al., 2015; Wellons et al., 2015; Rodriguez-Gomez et al., 2015; Genel et al., 2015; Mistani et al., 2016; Cook et al., 2016).
In addition, we consider an analogous DM-only (DMO) cosmological simulation, known hereafter as Illustris-Dark, which follows the evolution of DM particles with a mass of in a cosmological box of the same size, with the same initial conditions. In Section 2.3 we describe a method for matching haloes between the Illustris and Illustris-Dark simulations.
For each simulation snapshot, DM haloes are identified using the friends-of-friends (FoF) algorithm (Davis et al., 1985), which links together all particle pairs separated by less than 0.2 times the mean interparticle separation. Within each halo, gravitationally bound substructures are identified with the subfind algorithm (Springel et al., 2001; Dolag et al., 2009). For the remainder of this paper, FoF groups will be referred to as haloes and subfind haloes as subhaloes. The latter category includes a central subhalo (also known as ‘background’ subhalo) which, by definition, contains all of the gravitationally bound material in the FoF group which is not gravitationally bound to any satellite.
We define a galaxy as being composed of the stellar and star-forming (i.e. ‘cold’) gas components of a subhalo. Here, a gas cell is considered to be star-forming if its hydrogen particle density exceeds 0.13 cm-3 (Springel & Hernquist, 2003). Unless otherwise noted, we measure all properties of a galaxy (e.g. stellar mass or angular momentum) throughout the entire subfind object – namely, without truncating the particles found outside of a fiducial aperture such as twice the stellar half-mass radius.
Our simulations were run with a cold dark matter (CDM) cosmological model with parameters , , , , , and , consistent with the nine-year Wilkinson Microwave Anisotropy Probe measurements (Hinshaw et al., 2013).
2.2 Merger trees and stellar assembly catalogues
We use the sublink algorithm (Rodriguez-Gomez et al., 2015) to connect galaxies across the 136 snapshots produced by our simulations, resulting in data structures known as a merger trees. First, for each galaxy from a given snapshot, a descendant is identified in the next snapshot by matching the stellar particles and star-forming gas cells111The ‘default’ version of the sublink algorithm, included in the Illustris public data release (Nelson et al., 2015b), tracks only DM particles. However, the ‘baryonic’ version of merger trees is better suited for this study, as well as for most other galaxy formation applications (see Rodriguez-Gomez et al., 2015, for details). in a weighted fashion, putting more weight on elements which are more tightly bound. In some cases, a small galaxy is allowed to ‘skip’ a snapshot when finding a descendant, in order to avoid losing track of it while it is passing through a larger, denser structure. After assigning all the descendants, the main progenitor of each galaxy is defined as the one with the ‘most massive history’ behind it (De Lucia & Blaizot, 2007). This information is enough to construct the merger trees, which are stored in a ‘depth-first’ fashion (Lemson & Springel, 2006) in order to allow fast retrieval of the full evolutionary histories.
These merger trees have been used to determine the ‘accretion origin’ of every stellar particle in the Illustris simulation, which results in our so-called stellar assembly catalogues (Rodriguez-Gomez et al., 2016). These datasets provide a precise measurement of the ex situ stellar mass fraction of each galaxy, denoted by , which measures the fraction of a galaxy’s stellar mass contributed by stars that formed in other galaxies and which were subsequently accreted.
2.3 Matched halo catalogues
In order to isolate (or exclude) the effects of baryons on DM, it is often useful to match (sub)haloes from a hydrodynamic simulation to their counterparts in an analogous -body simulation. We carry out such a task for the Illustris and Illustris-Dark simulations in the following way. For each subhalo in Illustris, we define ‘matched’ subhalo candidates in Illustris-Dark as those which have at least one DM particle in common. For each candidate, we evaluate the merit function
| (1) |
where and are the binding energy ranks of the -th DM particles in the ‘full-physics’ (FP) and DMO runs, respectively, and the sum is carried out over all common DM particles. The exponent is chosen to be for subhaloes which are centrals in the DMO run, and for satellites. This choice maximizes the probability that a central is matched to a central, and a satellite to a satellite.222Equation (1) is very similar to the merit function used in Rodriguez-Gomez et al. (2015) to construct merger trees, except for the symmetry with respect to the two sets of subhaloes being considered (in this case those from the FP and DMO simulations) and the flexible choice of the exponent. As a final step, the same matching procedure is applied in reverse, i.e. by matching subhaloes from the DMO simulation to their counterparts in the FP run. Only those subhaloes with a bijective match are ultimately stored in the catalogue.
At , we find that 19,370 out of the 19,375 central galaxies in Illustris with have a bijective match. However, 2–3 per cent of these objects are classified as satellites in the DMO simulation and are therefore excluded in some parts of our analysis, as explained below.
2.4 The galaxy sample
We consider all central galaxies at with stellar masses . After removing a small spurious component, as explained below, our sample ultimately consists of 18,076 (17,650 in some calculations) central galaxies at . We do not consider satellite galaxies because a connection with the spin parameter of their host haloes would be difficult to interpret.
In order to account for two common problems that arise when connecting simulated galaxies across cosmic time, we apply the following small corrections to our galaxy sample. Firstly, we remove ‘orphan’ galaxies by making sure that all galaxies in the sample can be tracked back in time to at least . This removes 16 out of the 19,375 central galaxies originally included in the sample. Secondly, as a consequence of the halo identification procedure, a central and a satellite can sometimes ‘swap’ identities during close interactions (Srisawat et al., 2013; Avila et al., 2014). In order to minimize the effects from such spurious identifications, we only consider central galaxies which have never been classified as satellites during ten or more consecutive snapshots. This restriction removes a further 1,283 galaxies from our sample, or nearly 7 per cent, leaving a total of 18,076 central galaxies at . We find that these corrections have a negligible effect on the statistical trends shown in this paper.
Finally, when considering a DMO-matched quantity (namely, the spin of the DM halo), 426 central galaxies are further removed because their DMO counterparts are classified as satellites (see Section 2.3), reducing our sample to 17,650 central galaxies in these cases.
3 Galaxy morphology revisited
Galaxy morphology is known to correlate with various galactic properties such as the amount of rotation, star formation, gas content, and the spatial distribution of light (e.g. Kauffmann et al., 2003). In Snyder et al. (2015b), non-parametric optical morphologies were calculated for thousands of Illustris galaxies, and they were found to be in good agreement with their observational counterpart (Lotz et al., 2008). Furthermore, Genel et al. (2015) found that the specific stellar angular momenta of Illustris galaxies are consistent with observational trends (Romanowsky & Fall, 2012; Fall & Romanowsky, 2013). All of this provided evidence that the Illustris simulation can be a powerful tool to study galaxy morphology in a cosmological context. In the current work, however, we will exclusively consider kinematic morphologies rather than optical ones, as the former seem somewhat easier to interpret from a theoretical perspective. A detailed comparison between different measures of galaxy morphology in hydrodynamic simulations is deferred to future work.
3.1 The amount of rotational support
Throughout this work we quantify the morphology of a galaxy using the parameter, defined as the fraction of the total kinetic energy contributed by the azimuthal component of the stellar velocities, where the -axis coincides with the total angular momentum of the galactic stellar component. More explicitly, this parameter was introduced in Sales et al. (2012) as
| (2) |
where is the total kinetic energy of the stellar component, represents the mass of a particle, is the -component of the specific angular momentum, is the projected radius, and the sum is carried out over all stellar particles in the galaxy.333In the original definition from Sales et al. (2012), only stars within twice the stellar half-mass radius were considered. We find that both definitions yield qualitatively similar results. Following Genel et al. (2015), the calculation frame is centred at the position of the most bound stellar particle, while the velocity of the frame coincides with that of the stellar centre of mass. As discussed in Appendix A, we find that is a good proxy for the amount of rotational support in a galaxy.
We note that is strongly correlated with other measures of kinematic morphology (e.g. Sales et al., 2012, figure 1). In fact, throughout this paper will represent a whole class of kinematic morphological parameters, most of which are based on the distribution of the ‘orbital circularity’ parameter . This parameter is usually defined as , where is the maximum specific angular momentum possible for a star with specific binding energy (Abadi et al., 2003), or as , where is the circular velocity at the distance (Scannapieco et al., 2009, 2012). Some examples of such circularity-based morphological parameters include the disc-to-total ratio, defined as the fraction of stars with sufficiently circular orbits, typically (Aumer et al., 2013; Marinacci, Pakmor & Springel, 2014), or the bulge-to-total fraction, usually defined as (but see Martig et al., 2012; Zavala et al., 2016, for an improved B/T measurement). We have found that is strongly correlated with any of these alternative measures of kinematic morphology, despite the fact that cannot distinguish the sense of rotation of a particle about the -axis, i.e. corotating or counter-rotating (see Appendix A). Furthermore, has the advantage of being independent from particular choices of values that are considered to constitute ‘circular’ orbits, or from the assumption that the bulge component is symmetric with respect to the -parameter.
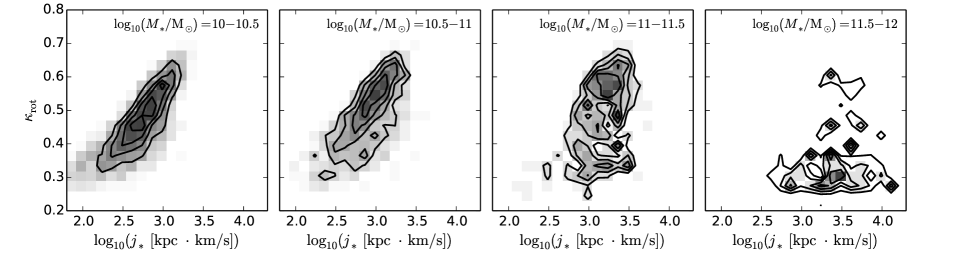
As expected, the parameter is also connected to the specific angular momentum of the stars in a galaxy. Such a correlation between galaxy morphology and specific angular momentum is clearly seen in observations (e.g. Fall, 1983; Romanowsky & Fall, 2012; Obreschkow & Glazebrook, 2014), as well as in hydrodynamic simulations of a CDM cosmology (e.g. Genel et al., 2015; Teklu et al., 2015; Sokolowska et al., 2016; Lagos et al., 2017b). We caution, however, that most of the stellar angular momentum in Illustris galaxies with is found at very large radii, which means that the total stellar angular momentum does not directly measure the degree of rotational support in the central, most luminous regions of such galaxies. The relationship between and angular momentum is discussed in more detail in Appendix B.
3.2 Visual impression
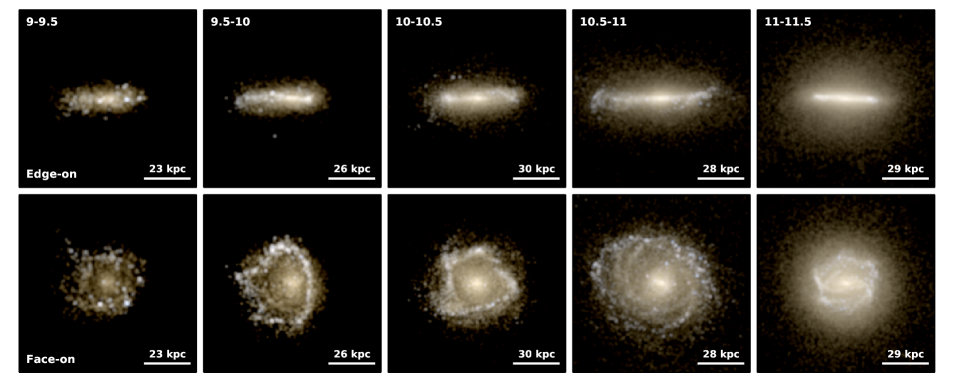
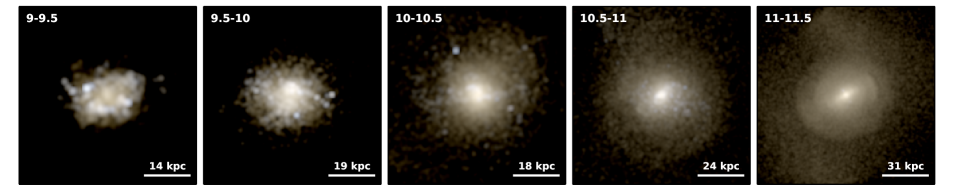
Fig. 1 shows images of randomly selected disc-like galaxies at in different stellar mass bins, ranging from – (first column) to – (last column). The upper and lower panels show edge-on and face-on projections of the same galaxies, respectively. These disc-like galaxies have been selected as those with (typically –), which constitutes the upper tail of the distribution, as we will see in Section 3.3.
Each image is a composite of Sloan Digital Sky Survey (SDSS; York et al. 2000) filters, calculated using stellar population synthesis models (e.g. Bruzual & Charlot, 2003). The scaling of the images is logarithmic (or, equivalently, linear on a magnitude scale) as described in Lupton et al. (2004), and the light from each stellar particle has been smoothed using a Gaussian kernel with a standard deviation equal to the gravitational softening length of baryonic resolution elements (0.7 kpc at ). In principle, these images could also be generated with adaptive softening as described in Torrey et al. (2015).
Similarly, Fig. 2 shows projected stellar density maps of randomly selected spheroidal galaxies at in the same stellar mass bins. These spheroidal systems have been selected as those satisfying (typically –). We can see that, as their stellar mass increases, spheroidal systems become more concentrated toward their centres, and some of them even display signs of shells and tidal streams.
3.3 Distribution of galaxy morphologies
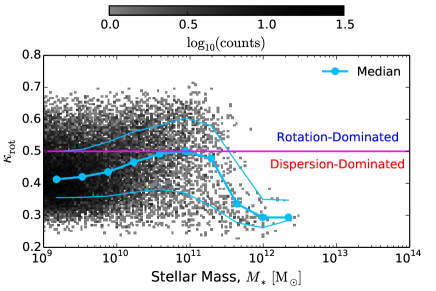
In Fig. 3, the two-dimensional histogram (effectively a scatter plot, given the small bin size) shows the distribution of galaxies with respect to and stellar mass, with darker shades of grey indicating a larger number of galaxies per bin. The use of a two-dimensional histogram to represent a scatter plot reduces the loss of information that is inevitable in the most densely populated regions of a ‘normal’ scatter plot. The thick cyan line shows the median value of as a function of stellar mass, while the thin cyan lines indicate the 16th to 84th percentile range, or . The horizontal magenta line is located at . Hereafter, we refer to galaxies with as rotation-dominated and to those with as dispersion-dominated. Although any value between 0 and 1 is possible in theory, as discussed in Appendix A, in practice takes values between and for Illustris galaxies.
We note that the distribution of kinematic morphologies shown in Fig. 3 is remarkably similar to the one found by Dubois et al. (2016) using the Horizon-AGN simulation (Dubois et al., 2014), despite the different (but also kinematic) definition of galaxy morphology used in their study, and the obviously different numerical methods used to model the hydrodynamics and other physical processes. In particular, the simulated galaxies from Dubois et al. (2016) as well as those from the current study are more likely to be disc-like at if their stellar masses are around –.
4 What drives galaxy morphology?
In this section we examine the connection between galaxy morphology, merging history, and halo spin across a wide range of stellar masses.
4.1 Merging history
Idealized merger simulations have shown that mergers can play an important role in determining the morphology of a galaxy (e.g. Toomre, 1977; White, 1978; Barnes & Hernquist, 1996). However, the ‘cosmologically averaged’ effect of mergers on galaxy morphology, as well as the relative impact on morphology produced by major versus minor mergers, or gas-rich versus dry mergers, are still the subject of significant discussion (e.g. Khochfar & Burkert 2003; Naab, Khochfar & Burkert 2006; Hopkins et al. 2009a, 2010; Fiacconi, Feldmann & Mayer 2014; see Naab et al. 2014, for a review). Here we explore these topics using a large, cosmologically representative sample of simulated galaxies at (defined in Section 2.4), with the help of merger trees and other useful data products described in Section 2.
4.1.1 The ex situ stellar mass fraction
The main parameter that we use to quantify the importance of merging history is the ex situ stellar mass fraction, denoted by and defined as the fraction of a galaxy’s stellar mass contributed by stars that formed in other galaxies and which were subsequently accreted. This quantity has already been measured to great precision in the Illustris simulation (Rodriguez-Gomez et al., 2016), where it was found to strongly correlate with stellar mass and other galaxy properties.
It is important to note that does not measure the merging history per se, but instead quantifies the relative importance of dry merging with respect to dissipative processes such as in situ star formation (e.g. Oser et al., 2010). Because of star formation quenching in massive galaxies, the ex situ fraction displays a much stronger variation with stellar mass than the merger rate itself, which shows a positive but relatively mild dependence on stellar mass (Rodriguez-Gomez et al., 2015).
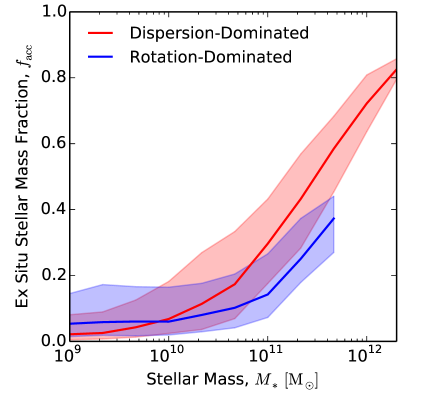
In Fig. 4 we show the median ex situ stellar mass fraction as a function of stellar mass , distinguishing between dispersion-dominated (, red) and rotation-dominated (, blue) central galaxies at . The shaded regions indicate the 16th to 84th percentile range, or 1, at a fixed stellar mass. Similar plots have already been shown in Rodriguez-Gomez et al. (2016), except that we now separate galaxies by adopting a fixed threshold at , instead of using the median value of at a fixed stellar mass.
Fig. 4 shows that dry mergers play an increasingly important role at higher masses, where dispersion-dominated galaxies have larger ex situ stellar mass fractions than rotation-dominated galaxies of similar masses, as expected within the framework of CDM cosmology and the merger hypothesis. A less expected result is that the correlation between and becomes very weak at . Interestingly, this is consistent with Sales et al. (2012), who found a null correlation between and for galaxies in a similar mass range using the gimic simulation (Crain et al., 2009).
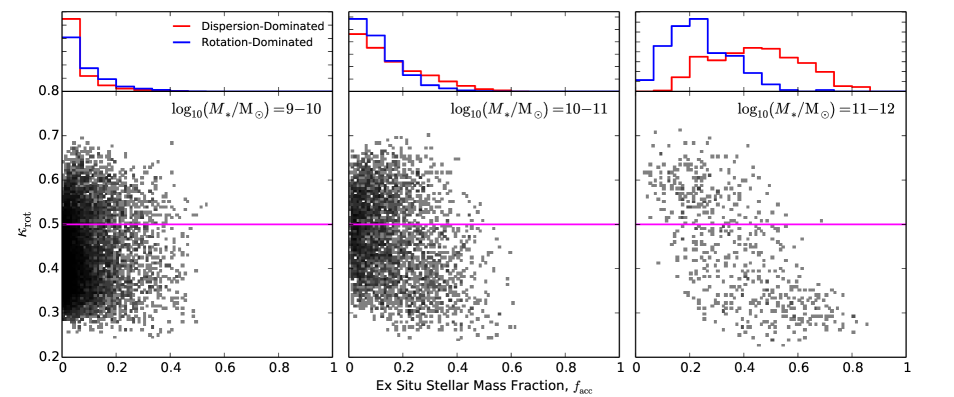
In Fig. 5 we further explore the statistical relationship between galaxy morphology and the ex situ stellar mass fraction. The scatter plots (or, more precisely, two-dimensional histograms with very small bins) show the galaxy distribution with respect to and in different stellar mass bins. The upper panels show the marginal distribution with respect to , separating between dispersion-dominated (, red) and rotation-dominated (, blue) systems. This figure shows even more explicitly that and are correlated at high masses, and that the trend fades out at lower masses.
4.1.2 Other merger statistics
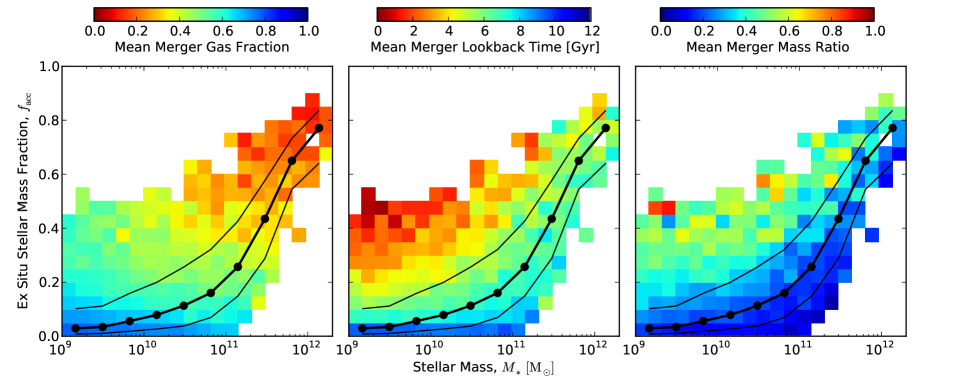
In addition to the ex situ stellar mass fraction, which we consider to be a ‘first order’ indicator of a galaxy’s merging history, we also define and explore the following merger statistics:
-
•
Mean merger gas fraction: the mean ‘cold’ (i.e. star-forming) gas fraction of all the objects that have merged with the galaxy in question, weighted by their maximum stellar masses. The cold gas fraction of each secondary progenitor is measured at the time when it reached its maximum stellar mass.
-
•
Mean merger lookback time: the mean lookback time of all the mergers that a galaxy has undergone, weighted by the maximum stellar mass of the secondary progenitors. Each merger is assumed to have taken place at the time when the two branches of the merger tree merged with each other.
-
•
Mean merger mass ratio: the mean stellar mass ratio of all the mergers that a galaxy has undergone, weighted by the maximum stellar mass of the secondary progenitors. Following Rodriguez-Gomez et al. (2015), each merger mass ratio is measured at the time when the secondary progenitor reached its maximum stellar mass.
In Fig. 6, the two-dimensional histograms in the different panels are coloured according to the median value of the three merger statistics described above, with the horizontal and vertical axes corresponding to and , respectively. For reference, the thick and thin black lines show the median and 1 scatter of as a function of stellar mass.
Apart from the evident trend between and stellar mass, which has already been discussed in Rodriguez-Gomez et al. (2016), Fig. 6 shows that – at any fixed stellar mass – is negatively correlated with the mean merger gas fraction and the mean lookback time (i.e. gas-rich mergers, as well as those which happened a longer time ago, tend to be associated with lower ex situ fractions) and positively correlated with the mean merger mass ratio (i.e. major mergers lead to higher values). Therefore, as a first approximation, we consider to be a good measure of the importance of dry, recent, and massive mergers (relative to in situ star formation). This justifies the ‘encapsulation’ of merging history – at least the kind of merging history that leads to spheroid formation – into a single number, i.e. the ex situ stellar mass fraction .
Besides the correlation between and each of the three additional merger statistics, a closer inspection of Fig. 6 reveals other interesting trends. First, dry mergers are prevalent for all galaxies with . An implication of this is that two galaxies with the same value but with different stellar masses need not have ‘equivalent’ merging histories. For example, Fig. 6 shows that galaxies with at the low-mass end of our sample are extreme outliers which appear to have undergone a single, recent, gas-rich major merger (note that these galaxies also have mean merger mass ratios around 0.4). On the other hand, the typical merging history of a very massive galaxy with consists of numerous dry, minor mergers. Therefore, although we often use as a simplified measure of the importance (relative to in situ star formation) of a galaxy’s merging history, a fixed value can have very different implications for galaxies of different masses.
Another observation about Fig. 6 worth mentioning is that, for the ‘bulk’ of the galaxy population (say, the galaxies contained within the thin black lines, or ), the mean merger mass ratio is essentially independent of stellar mass (Fig. 6, right panel). In other words, the ‘isochromes’ in the two-dimensional histogram are parallel to the median trend as a function of stellar mass. This is consistent with Rodriguez-Gomez et al. (2015), where it was found that the mass ratio dependence of the galaxy merger rate is approximately universal.
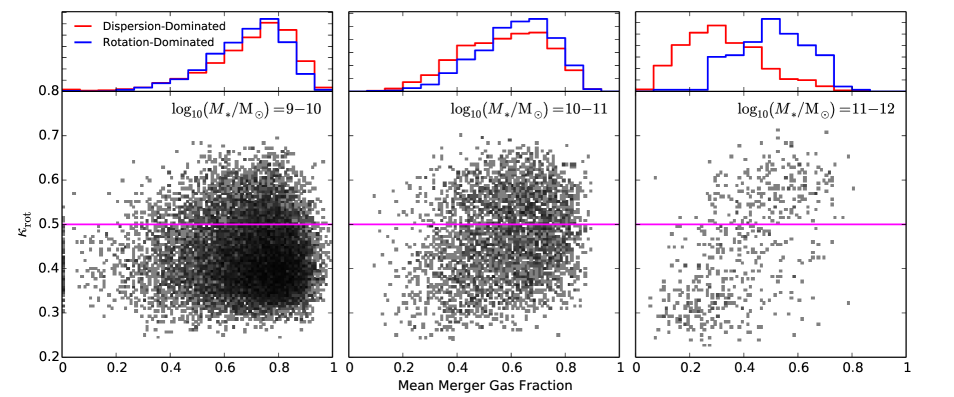
Among the three different merger statistics described above, perhaps the one that has been the topic of most discussion in the literature, at least regarding its effects on galaxy morphology, is the gas content of the merger, quantified here as the mean merger gas fraction. It is generally accepted that dry mergers are more effective at creating spheroids than gas-rich mergers (e.g. Khochfar & Burkert, 2003; Naab, Khochfar & Burkert, 2006; Hopkins et al., 2010).
Fig. 7 shows the correlation between galaxy morphology and mean merger gas fraction, using the same plotting style as Fig. 5. This figure shows that gas-poor mergers are indeed more effective spheroid formation mechanisms than gas-rich mergers, although the trend is significant only for galaxies with . This corresponds to the mass range where the fraction of accreted stellar mass has an impact on galaxy morphology (compare to Fig. 5), which is perhaps unsurprising given the strong, positive correlation between and the mean merger gas fraction displayed in Fig. 6. These results are consistent with those of Lagos et al. (2017a), who found that dry mergers have a more dramatic impact than gas-rich mergers on the angular momentum content of galaxies. The effects of gas fraction on individual mergers of Illustris galaxies is explored in detail in Penoyre et al. (in prep.), while Sparre & Springel (2016) investigate the evolution of galaxy morphology during and after gas-rich mergers using high-resolution ‘zoom-in’ resimulations of Illustris mergers.
We highlight that Fig. 7 is showing the gas fraction of the secondary progenitors, i.e. the gas brought in by mergers. Therefore, one might wonder about the effect on morphology due to gas in the primary galaxy itself. To investigate this, we compared to the gas fraction along a galaxy’s main branch444Defined as , where the sum is carried out over the galaxy’s main branch in the merger tree. and found the same qualitative behaviour as in Fig. 7: is correlated with gas fraction in massive galaxies, but the trend weakens at . This result, which we do not show for the sake of brevity, can be understood by noting that most galaxies with stellar masses below have been gas-rich throughout their histories, and therefore they all have the same ‘ability’ to form new stars and regrow their stellar discs. This allows other factors to play a more important role in determining the morphology of smaller galaxies, as we discuss in the next section.
4.2 Halo spin
Now we test whether the spin of a DM halo has an important effect on the morphology of the galaxy formed at its centre. For instance, the analytic arguments presented in Fall (1983) and Mo, Mao & White (1998) suggest that galactic discs that form in haloes with large spin should have large sizes and low surface densities, a prediction that has been shown to work reasonably well in cosmological hydrodynamic simulations (Sales et al., 2009; Grand et al., 2016). However, a systematic comparison between the spin of the DM halo and the parameter over a wide range of stellar masses has not been done before.
We parametrize halo spin using the definition from Bullock et al. (2001),
| (3) |
where is the radius enclosing an average density equal to 200 times the critical density of the Universe, is the total mass within , is the magnitude of the total angular momentum within , and . For our analysis we use the angular momentum vectors from the Illustris halo catalogue extension presented in Zjupa & Springel (2017). In this extension, is calculated including all resolution elements contained within , rather than only those which are also members of the FoF group in question.
The halo spin parameter defined by equation (3) is approximately mass-independent and its statistical distribution is well fitted by a log-normal distribution (e.g. Barnes & Efstathiou, 1987; van den Bosch, 1998; Bullock et al., 2001),
| (4) |
where and are the best-fitting values.555A slightly more accurate fitting formula was later proposed by Bett et al. (2007). A detailed study of halo spin in the Illustris and Illustris-Dark simulations has already been carried out in Zjupa & Springel (2017).
In order to study the effect of halo spin on the morphology of the galaxy hosted at its centre, while at the same time removing the influence of the baryons themselves on halo spin, we match each subhalo from Illustris to its counterpart in Illustris-Dark as described in Section 2.3. We denote these DMO-matched halo spin parameters by , and we will use them exclusively throughout the rest of this paper. We note, however, that none of our results would change appreciably if we had used the halo spin parameters from the hydrodynamic simulation.
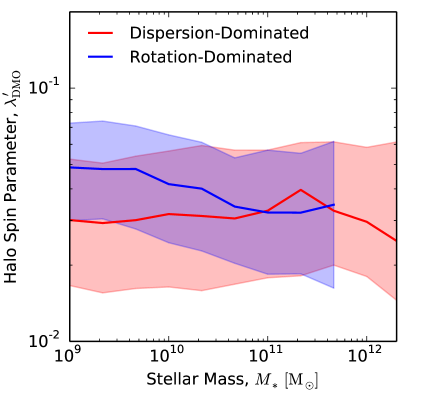
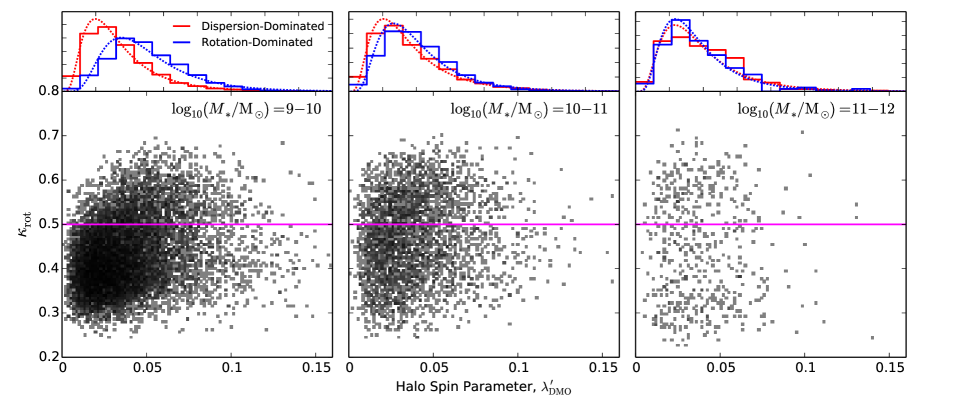
Fig. 8 shows the median spin parameter of DM haloes as a function of the stellar mass of the galaxies hosted at their centres, distinguishing between dispersion-dominated (; shown in red) and rotation-dominated (; shown in blue) systems. The shaded regions indicate the 16th to 84th percentile ranges of the individual distributions. This figure shows that the effect of halo spin on galaxy morphology is mass-dependent, being most effective in smaller galaxies () and becoming progressively weaker in more massive systems.
In Fig. 9 we further explore the correlation between morphology and halo spin. As before, the two-dimensional histograms (coloured using the same range of greys as in Fig. 3) are effectively scatter plots showing the overall galaxy distribution in different stellar mass bins, while the histograms in the upper panels show the marginal distributions for dispersion- and rotation-dominated systems. The data in the upper panels have been fitted with a log-normal distribution, with best-fit parameters specified in Table 1.
The left-hand panels of Fig. 9 once again show that there is a correlation between galaxy morphology and halo spin: galaxies with higher (lower) are more likely to be found at the centres of haloes with higher (lower) spin parameter, although there is significant overlap in the distributions of dispersion-dominated and rotation-dominated systems. This trend becomes weaker at (middle and right panels), in agreement with several previous results in this mass range (e.g. Scannapieco et al., 2009; Sales et al., 2012).
Recently, however, Teklu et al. (2015) studied the halo spin parameter of disc- and spheroid-dominated galaxies with (approximately ), finding a mild preference for disc-dominated galaxies to form in haloes with larger spin (see their figure 15). This is unlikely to be in contradiction with our work or with previous ones. In fact, their trend is similar to the one found in our sample, but only when we consider galaxies with . Because low-mass galaxies dominate in number compared to more massive systems, the signal prevails when the whole galaxy sample is considered at stellar masses , which is the case in Teklu et al. (2015). Nevertheless, we highlight that, at least in our sample, the trend between morphology and halo spin does exist in dwarf galaxies, disappearing later for more massive systems, likely as a combination of more complex assembly histories and the increasingly important role of mergers.
4.3 The complementary roles of mergers and halo spin
| range | Dispersion-dominated | Rotation-dominated |
|---|---|---|
| – | , | , |
| – | , | , |
| – | , | , |
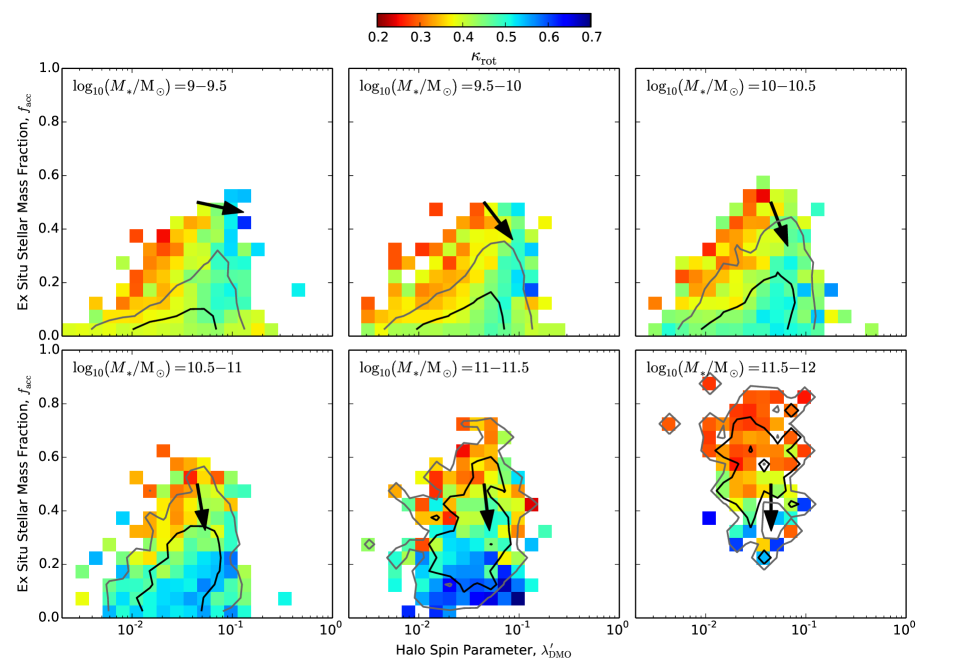
Here we expand on our results from Sections 4.1 and 4.2, but now focusing on the idea that merging history and halo spin play complementary roles in shaping galaxy morphology. We know from Fig. 5 that mergers are more effective at shaping the morphology of massive galaxies (–), while Fig. 9 suggests that halo spin plays a more important role at lower masses (–). However, the effect from any of these two factors alone is relatively unimportant for medium-sized galaxies (–). Here we explore the idea that a combination of both merging history and halo spin could be useful in understanding what determines the morphology of galaxies with masses similar to that of the Milky Way.
Fig. 10 shows how the morphologies of central galaxies at depend on halo spin (-axis), ex situ stellar mass fraction (-axis), and stellar mass (different panels). Each two-dimensional histogram is coloured according to the median value of the galaxies that fall into each two-dimensional bin, while the black and dark grey contours contain 68 and 95 per cent of the galaxies in each panel. The black arrows indicate the direction of increasing , obtained from a linear fit to the data in each panel, weighted by the number of galaxies.666We excluded galaxies with , since they are not well described by a plane in the upper left panel of Fig. 10. This has negligible effects in the other five panels, i.e. for galaxies with . This figure shows that, in general, depends on a combination of halo spin and ex situ fraction, as manifested by the ‘diagonal’ gradient seen in most panels: galaxies with violent (quiet) merging histories which are also found at the centres of slowly (fast) rotating haloes are more likely to be dispersion-dominated (rotation-dominated).
However, we had demonstrated in Sections 4.1 and 4.2 that the effect of merging history and halo spin on galaxy morphology depends on the stellar mass of the galaxies considered. This mass-dependent behaviour is manifested in Fig. 10 by the fact that the direction of the gradient changes with stellar mass. At low masses (top-left panels), the gradient is almost horizontal, which implies that the morphology of galaxies with ‘similar’ merging histories (i.e. with the same value) is mostly determined by the spin parameter of their parent haloes. On the other hand, the gradient becomes approximately vertical at (bottom-right panels), which means that mergers have a major impact on the morphology of massive galaxies, erasing any ‘pre-existing dependence’ on halo spin.
In order to interpret the changing direction of such gradients in Fig. 10 correctly, one must consider the following factors. Firstly, the stellar mass of a galaxy is strongly correlated with its gas fraction, as well as with the gas fraction of other galaxies that have merged onto it (Fig. 6, left panel). In general, more gas is involved in galaxy interactions at low stellar masses. Secondly, does not measure the merging history per se, but rather the impact of dry mergers relative to in situ star formation. Therefore, a low-mass galaxy with high (an indication of a recent, gas-rich major merger, as implied by Fig. 6) will nevertheless possess a considerable amount of gas, a higher specific star formation rate, and therefore the ‘ability’ to regrow its stellar disc (a quite direct demonstration of this effect was recently presented in Sparre & Springel 2016). The values of these low-mass discs are ultimately determined by the halo spin. Finally, there might be other factors driving the mass-dependent trends in Fig. 10, but whose effects are more challenging to quantify. For example, it has been argued that a large fraction of the gas accreted onto small galaxies at comes from a ‘galactic fountain’ of recycled gas (e.g. Nelson et al., 2015a, and references therein). This effect could introduce or enhance correlations between the angular momentum of the halo and that of the galaxy formed at its centre (e.g. Genel et al., 2015).
We finalize this section by making a more subtle observation about Fig. 10, which is that the ex situ stellar mass fraction and the halo spin parameter , usually assumed to be independent from each other, actually appear to be somewhat correlated, as evidenced by the mildly diagonal orientation of the contour lines. This suggests that galaxy mergers are associated with higher halo spin, as previously speculated by a number of investigations (e.g. Vitvitska et al. 2002; Peirani, Mohayaee & de Freitas Pacheco 2004; Hetznecker & Burkert 2006; Bett & Frenk 2012; Welker et al. 2014; but see D’Onghia & Navarro 2007, for an interesting caveat), although it is unclear whether this correlation implies causation (i.e. mergers directly increasing the spin of the DM halo), or whether haloes with higher spin simply happen to form in environments which are also favourable to galaxy mergers, such as along galaxy filaments.777The high velocity dispersion found in cluster environments, along with the associated lower gas fractions, tends to lower the likelihood of two nearby galaxies in such dense environments actually merging. A full discussion of this curious effect is beyond the scope of this paper.
5 Discussion and conclusions
We have investigated the connection between galaxy morphology, halo spin, and merging history in the Illustris cosmological simulation, considering approximately 18,000 central galaxies at over a wide range of stellar masses (–). We showed that disc-like and spheroidal galaxies arise naturally in the Illustris simulation over the mass range considered (Figs. 1 and 2), and then proceeded to investigate the effects of mergers and halo spin on galaxy morphology as a function of stellar mass.
Throughout this work, we quantified galaxy morphology using the parameter (Sales et al., 2012), defined in equation (2). This quantity is closely related to other kinematic morphological parameters, such as the kinematic disc-to-total fraction (sometimes denoted by D/T) that is often used in other simulation studies (see Section 3.1). Based on the arguments presented in Appendix A, we employed the parameter to classify galaxies as rotation-dominated () or dispersion-dominated (), as illustrated in Fig. 3.
In order to test the idea that mergers play an important role in determining galaxy morphology (e.g. Toomre, 1977; White, 1978; Barnes & Hernquist, 1996; Naab, Jesseit & Burkert, 2006; Naab et al., 2014), we used the ex situ stellar mass fraction to measure the overall impact of galaxy mergers (relative to in situ star formation). We found that mergers are indeed an important transformational mechanism in massive galaxies (), but their importance diminishes at lower masses (Figs. 4 and 5). To the best of our knowledge, this is the first time that a statistical demonstration of the ‘merger hypothesis’ has been carried out with a cosmological hydrodynamic simulation over such a wide range of stellar masses (however, see De Lucia et al. 2011 for a study using SAMs).
Beyond the ex situ stellar mass fraction, , we also considered three additional merger statistics: the mean merger gas fraction, the mean merger lookback time, and the mean merger mass ratio. By comparing these quantities to we found that – at any fixed stellar mass – a higher is associated with a larger number of massive, recent, and dry mergers (Fig. 6), which happen to be the kind of mergers that are believed to contribute most to the formation of spheroidal galaxies. In fact, in Fig. 7 we showed explicitly that gas-poor mergers contribute more to spheroid formation than gas-rich mergers, although the trend is strong only for massive galaxies ().
Having investigated the role of merging history in shaping galaxy morphology, we proceeded to test the hypothesis that, through conservation of specific angular momentum, the spin of a halo also plays a major role in determining the morphology of the galaxy formed at its centre. According to this picture, DM haloes with high angular momentum content favour the formation of rotationally supported discs. In order to rule out baryonic effects on halo spin, we matched each Illustris halo to its counterpart in Illustris-Dark and used the spin parameter of the latter for all our analyses. We showed in Figs. 8 and 9 that is somewhat determined by halo spin at , but the correlation between these two quantities becomes weaker at higher masses and eventually disappears, presumably due to the increasing impact of galaxy mergers.
Finally, we investigated the joint effect of halo spin and merging history on galaxy morphology. We found that, in general, galaxies with high (low) which are also located at the centres of slowly (fast) rotating haloes are more likely to be dispersion-dominated (rotation-dominated) systems, as manifested by the ‘diagonal’ gradients in Fig. 10. However, the relative importance between halo spin and is mass-dependent, as evidenced by the varying direction of the gradients: halo spin is the dominant driver of galaxy morphology at low masses, even for galaxies which have undergone major mergers, while dry mergers are more important in determining the morphology of more massive systems. The morphology of Milky Way-sized galaxies, at the transition between these two regimes (–), depends on a combination of and halo spin, as described above, but shows a weak dependence on any of these two factors alone. We argued that the physical origin of this mass-dependent response of galaxy morphology to mergers is largely due to the nature of the mergers undergone by galaxies in different mass ranges.
Indeed, as discussed in Section 4.1, two galaxies of different masses with the same value need not have ‘equivalent’ merging histories. For example, Fig. 6 shows that low-mass galaxies are more likely to have gas-rich mergers, while the merging history of a more massive system usually consists of numerous dry mergers. This has crucial consequences for galaxy morphology. In fact, it has been proposed that dry mergers are important in the formation of spheroidal systems (e.g. Khochfar & Burkert, 2003; Naab, Khochfar & Burkert, 2006), while gas-rich major mergers have been shown to produce disc galaxies (e.g. Springel & Hernquist, 2005; Robertson et al., 2006; Governato et al., 2007). Both of these ideas seem to be manifested statistically in the different panels of Fig. 10, where the ‘likelihood’ of galaxy mergers producing a spheroid increases with stellar mass, along with the ‘dryness’ of the galaxy mergers in each mass range (Fig. 6). Furthermore, we know that low-mass galaxies undergo major mergers somewhat less frequently than massive galaxies, by about an order of magnitude (Rodriguez-Gomez et al., 2015). This reduced merger frequency, along with the higher gas fractions (and specific star formation rates) present at low stellar masses, further adds to the apparent ‘resilience’ of small galaxies to the destructive effects of major mergers.
In other words, we interpret the shifting importance of mergers in determining galaxy morphology as being largely due to the varying nature of galaxy mergers in different mass ranges: mergers between low-mass galaxies tend to be gas-rich and less frequent, while the merging history of a massive galaxy is dominated by repeated gas-poor mergers. In addition, low-mass galaxies have larger gas reservoirs which allow them to regrow their stellar discs. Thus, our work supports a scenario in which galaxy mergers manifest themselves as different kinds of transformational mechanisms, potentially giving rise to both discs and spheroids, depending on the mass range considered.
Acknowledgements
We thank Nicola Amorisco, Martin Sparre, Julio Navarro, Michael Fall and Adrian Jenkins for useful comments and discussions, as well as Rachel Somerville for carefully reading the manuscript. SG and PT acknowledge support provided by NASA through Hubble Fellowship grants HST-HF2-51341.001-A and HST-HF2-51384.001-A awarded by the STScI, which is operated by the Association of Universities for Research in Astronomy, Inc., for NASA, under contract NAS5-26555. JZ acknowledges support from the Deutsche Forschungsgemeinschaft through Transregio 33, ‘The Dark Universe,’ and from IMPRS for Astronomy and Cosmic Physics at the University of Heidelberg. JZ and VS would like to thank the Klaus Tschira Foundation. VS also acknowledges support through the European Research Council through ERC-StG grant EXAGAL-308037. GS appreciates support from a Giacconi Fellowship at the STScI, which is operated by the Association of Universities for Research in Astronomy, Inc., under NASA contract NAS 5-26555. LH acknowledges support from NSF grant AST-1312095 and NASA grant NNX12AC67G. Simulations were run on the Harvard Odyssey and CfA/ITC clusters, the Ranger and Stampede supercomputers at the Texas Advanced Computing Center as part of XSEDE, the Kraken supercomputer at Oak Ridge National Laboratory as part of XSEDE, the CURIE supercomputer at CEA/France as part of PRACE project RA0844, and the SuperMUC computer at the Leibniz Computing Centre, Germany, as part of project pr85je. The Flatiron Institute is supported by the Simons Foundation.
References
- Abadi et al. (2003) Abadi M. G., Navarro J. F., Steinmetz M., Eke V. R., 2003, ApJ, 597, 21
- Agertz & Kravtsov (2016) Agertz O., Kravtsov A. V., 2016, ApJ, 824, 79
- Agertz, Teyssier & Moore (2011) Agertz O., Teyssier R., Moore B., 2011, MNRAS, 410, 1391
- Aumer et al. (2013) Aumer M., White S. D. M., Naab T., Scannapieco C., 2013, MNRAS, 434, 3142
- Avila et al. (2014) Avila S. et al., 2014, MNRAS, 441, 3488
- Avila-Reese, Zavala & Lacerna (2014) Avila-Reese V., Zavala J., Lacerna I., 2014, MNRAS, 441, 417
- Barnes & Efstathiou (1987) Barnes J., Efstathiou G., 1987, ApJ, 319, 575
- Barnes (1992) Barnes J. E., 1992, ApJ, 393, 484
- Barnes & Hernquist (1996) Barnes J. E., Hernquist L., 1996, ApJ, 471, 115
- Bett et al. (2007) Bett P., Eke V., Frenk C. S., Jenkins A., Helly J., Navarro J., 2007, MNRAS, 376, 215
- Bett & Frenk (2012) Bett P. E., Frenk C. S., 2012, MNRAS, 420, 3324
- Brook et al. (2011) Brook C. B. et al., 2011, MNRAS, 415, 1051
- Brook et al. (2004) Brook C. B., Kawata D., Gibson B. K., Flynn C., 2004, MNRAS, 349, 52
- Bruzual & Charlot (2003) Bruzual G., Charlot S., 2003, MNRAS, 344, 1000
- Bullock et al. (2001) Bullock J. S., Dekel A., Kolatt T. S., Kravtsov A. V., Klypin A. A., Porciani C., Primack J. R., 2001, ApJ, 555, 240
- Ceverino & Klypin (2009) Ceverino D., Klypin A., 2009, ApJ, 695, 292
- Cook et al. (2016) Cook B. A., Conroy C., Pillepich A., Rodriguez-Gomez V., Hernquist L., 2016, ApJ, 833, 158
- Cox et al. (2006) Cox T. J., Dutta S. N., Di Matteo T., Hernquist L., Hopkins P. F., Robertson B., Springel V., 2006, ApJ, 650, 791
- Crain et al. (2009) Crain R. A. et al., 2009, MNRAS, 399, 1773
- Davis et al. (1985) Davis M., Efstathiou G., Frenk C. S., White S. D. M., 1985, ApJ, 292, 371
- De Lucia & Blaizot (2007) De Lucia G., Blaizot J., 2007, MNRAS, 375, 2
- De Lucia et al. (2011) De Lucia G., Fontanot F., Wilman D., Monaco P., 2011, MNRAS, 414, 1439
- Dolag et al. (2009) Dolag K., Borgani S., Murante G., Springel V., 2009, MNRAS, 399, 497
- D’Onghia & Navarro (2007) D’Onghia E., Navarro J. F., 2007, MNRAS, 380, L58
- Doroshkevich (1970) Doroshkevich A. G., 1970, Astrofizika, 6, 581
- Dubois et al. (2016) Dubois Y., Peirani S., Pichon C., Devriendt J., Gavazzi R., Welker C., Volonteri M., 2016, MNRAS, 463, 3948
- Dubois et al. (2014) Dubois Y. et al., 2014, MNRAS, 444, 1453
- Fall (1983) Fall S. M., 1983, in IAU Symp. 100, Internal Kinematics and Dynamics of Galaxies, ed. E. Athanassoula (Cambridge: Cambridge Univ. Press), 391
- Fall & Efstathiou (1980) Fall S. M., Efstathiou G., 1980, MNRAS, 193, 189
- Fall & Romanowsky (2013) Fall S. M., Romanowsky A. J., 2013, ApJ, 769, L26
- Fiacconi, Feldmann & Mayer (2014) Fiacconi D., Feldmann R., Mayer L., 2014, MNRAS, 446, 1957
- Fontanot et al. (2015) Fontanot F., Maccio A. V., Hirschmann M., De Lucia G., Kannan R., Somerville R. S., Wilman D., 2015, MNRAS, 451, 2968
- Genel et al. (2015) Genel S., Fall S. M., Hernquist L., Vogelsberger M., Snyder G. F., Rodriguez-Gomez V., Sijacki D., Springel V., 2015, ApJ, 804, L40
- Genel et al. (2014) Genel S. et al., 2014, MNRAS, 445, 175
- Governato et al. (2007) Governato F., Willman B., Mayer L., Brooks A., Stinson G., Valenzuela O., Wadsley J., Quinn T., 2007, MNRAS, 374, 1479
- Grand et al. (2016) Grand R. J. J. et al., 2016, preprint (arXiv:1610.01159)
- Hernquist (1992) Hernquist L., 1992, ApJ, 400, 460
- Hernquist (1993) Hernquist L., 1993, ApJ, 409, 548
- Hetznecker & Burkert (2006) Hetznecker H., Burkert A., 2006, MNRAS, 370, 1905
- Hinshaw et al. (2013) Hinshaw G. et al., 2013, ApJS, 208, 19
- Hopkins et al. (2010) Hopkins P. F. et al., 2010, ApJ, 715, 202
- Hopkins et al. (2009a) Hopkins P. F., Cox T. J., Younger J. D., Hernquist L., 2009a, ApJ, 691, 1168
- Hopkins et al. (2009b) Hopkins P. F. et al., 2009b, MNRAS, 397, 802
- Hubble (1926) Hubble E. P., 1926, ApJ, 64, 321
- Kannan et al. (2015) Kannan R., Macciò A. V., Fontanot F., Moster B. P., Karman W., Somerville R. S., 2015, MNRAS, 452, 4347
- Kauffmann et al. (2003) Kauffmann G. et al., 2003, MNRAS, 341, 54
- Khochfar & Burkert (2003) Khochfar S., Burkert A., 2003, ApJ, 597, L117
- Khochfar & Silk (2006) Khochfar S., Silk J., 2006, MNRAS, 370, 902
- Lagos et al. (2017a) Lagos C. d. P. et al., 2017a, preprint (arXiv:1701.04407)
- Lagos et al. (2017b) Lagos C. d. P., Theuns T., Stevens A. R. H., Cortese L., Padilla N. D., Davis T. A., Contreras S., Croton D., 2017b, MNRAS, 464, 3850
- Lemson & Springel (2006) Lemson G., Springel V., 2006, Astronomical Data Analysis Software and Systems XV ASP Conference Series, 351, 212
- Lotz et al. (2008) Lotz J. M. et al., 2008, ApJ, 672, 177
- Lupton et al. (2004) Lupton R. H., Blanton M. R., Fekete G., Hogg D. W., O’Mullane W., Szalay A. S., Wherry N., 2004, PASP, 116, 133
- Marinacci, Pakmor & Springel (2014) Marinacci F., Pakmor R., Springel V., 2014, MNRAS, 437, 1750
- Martig et al. (2012) Martig M., Bournaud F., Croton D. J., Dekel A., Teyssier R., 2012, ApJ, 756, 26
- Mistani et al. (2016) Mistani P. A. et al., 2016, MNRAS, 455, 2323
- Mo, Mao & White (1998) Mo H. J., Mao S., White S. D. M., 1998, MNRAS, 295, 319
- Moster, Maccio & Somerville (2014) Moster B. P., Maccio A. V., Somerville R. S., 2014, MNRAS, 437, 1027
- Naab & Burkert (2003) Naab T., Burkert A., 2003, ApJ, 597, 893
- Naab, Jesseit & Burkert (2006) Naab T., Jesseit R., Burkert A., 2006, MNRAS, 372, 839
- Naab, Khochfar & Burkert (2006) Naab T., Khochfar S., Burkert A., 2006, ApJ, 636, L81
- Naab et al. (2014) Naab T. et al., 2014, MNRAS, 444, 3357
- Navarro, Frenk & White (1995) Navarro J. F., Frenk C. S., White S. D. M., 1995, MNRAS, 275, 56
- Nelson et al. (2015a) Nelson D., Genel S., Vogelsberger M., Springel V., Sijacki D., Torrey P., Hernquist L., 2015a, MNRAS, 448, 59
- Nelson et al. (2015b) Nelson D. et al., 2015b, Astronomy and Computing, 13, 12
- Obreschkow & Glazebrook (2014) Obreschkow D., Glazebrook K., 2014, ApJ, 784, 26
- Okamoto et al. (2005) Okamoto T., Eke V. R., Frenk C. S., Jenkins A., 2005, MNRAS, 363, 1299
- Oser et al. (2010) Oser L., Ostriker J. P., Naab T., Johansson P. H., Burkert A., 2010, ApJ, 725, 2312
- Ostriker (1980) Ostriker J. P., 1980, Comments on Astrophysics, 8, 177
- Parry, Eke & Frenk (2009) Parry O. H., Eke V. R., Frenk C. S., 2009, MNRAS, 396, 1972
- Peebles (1969) Peebles P. J. E., 1969, ApJ, 155, 393
- Peirani, Mohayaee & de Freitas Pacheco (2004) Peirani S., Mohayaee R., de Freitas Pacheco J. A., 2004, MNRAS, 348, 921
- Robertson et al. (2006) Robertson B., Bullock J. S., Cox T. J., Di Matteo T., Hernquist L., Springel V., Yoshida N., 2006, ApJ, 645, 986
- Rodriguez-Gomez et al. (2015) Rodriguez-Gomez V. et al., 2015, MNRAS, 449, 49
- Rodriguez-Gomez et al. (2016) Rodriguez-Gomez V. et al., 2016, MNRAS, 458, 2371
- Romanowsky & Fall (2012) Romanowsky A. J., Fall S. M., 2012, ApJS, 203, 17
- Sales et al. (2009) Sales L. V., Navarro J. F., Schaye J., Dalla Vecchia C., Springel V., Haas M. R., Helmi A., 2009, MNRAS, 399, L64
- Sales et al. (2010) Sales L. V., Navarro J. F., Schaye J., Vecchia C. D., Springel V., Booth C. M., 2010, MNRAS, 409, 1541
- Sales et al. (2012) Sales L. V., Navarro J. F., Theuns T., Schaye J., White S. D. M., Frenk C. S., Crain R. A., Dalla Vecchia C., 2012, MNRAS, 423, 1544
- Sales et al. (2015) Sales L. V. et al., 2015, MNRAS, 447, L6
- Scannapieco et al. (2008) Scannapieco C., Tissera P. B., White S. D. M., Springel V., 2008, MNRAS, 389, 1137
- Scannapieco et al. (2012) Scannapieco C. et al., 2012, MNRAS, 423, 1726
- Scannapieco et al. (2009) Scannapieco C., White S. D. M., Springel V., Tissera P. B., 2009, MNRAS, 396, 696
- Schaye et al. (2015) Schaye J. et al., 2015, MNRAS, 446, 521
- Sharma, Steinmetz & Bland-Hawthorn (2012) Sharma S., Steinmetz M., Bland-Hawthorn J., 2012, ApJ, 750, 107
- Sijacki et al. (2015) Sijacki D., Vogelsberger M., Genel S., Springel V., Torrey P., Snyder G. F., Nelson D., Hernquist L., 2015, MNRAS, 452, 575
- Snyder et al. (2015a) Snyder G. F., Lotz J., Moody C., Peth M., Freeman P., Ceverino D., Primack J., Dekel A., 2015a, MNRAS, 451, 4290
- Snyder et al. (2015b) Snyder G. F. et al., 2015b, MNRAS, 454, 1886
- Sokolowska et al. (2016) Sokolowska A., Capelo P. R., Fall S. M., Mayer L., Shen S., Bonoli S., 2016, preprint (arXiv:1612.07362)
- Somerville & Davé (2015) Somerville R. S., Davé R., 2015, ARA&A, 53, 51
- Sparre & Springel (2016) Sparre M., Springel V., 2016, preprint (arXiv:1610.03850)
- Springel (2010) Springel V., 2010, MNRAS, 401, 791
- Springel & Hernquist (2003) Springel V., Hernquist L., 2003, MNRAS, 339, 289
- Springel & Hernquist (2005) Springel V., Hernquist L., 2005, ApJ, 622, L9
- Springel et al. (2001) Springel V., White S. D. M., Tormen G., Kauffmann G., 2001, MNRAS, 328, 726
- Srisawat et al. (2013) Srisawat C. et al., 2013, MNRAS, 436, 150
- Stewart et al. (2009) Stewart K. R., Bullock J. S., Wechsler R. H., Maller A. H., 2009, ApJ, 702, 307
- Stinson et al. (2010) Stinson G. S., Bailin J., Couchman H., Wadsley J., Shen S., Nickerson S., Brook C., Quinn T., 2010, MNRAS, 408, 812
- Teklu et al. (2015) Teklu A. F., Remus R.-S., Dolag K., Beck A. M., Burkert A., Schmidt A. S., Schulze F., Steinborn L. K., 2015, ApJ, 812, 29
- Toomre (1977) Toomre A., 1977, in Tinsley B. M., Larson R. B., eds, Evolution of Galaxies and Stellar Populations, Yale Univ. Obser., 401
- Toomre & Toomre (1972) Toomre A., Toomre J., 1972, ApJ, 178, 623
- Torrey et al. (2015) Torrey P. et al., 2015, MNRAS, 447, 2753
- Torrey et al. (2014) Torrey P., Vogelsberger M., Genel S., Sijacki D., Springel V., Hernquist L., 2014, MNRAS, 438, 1985
- Torrey et al. (2012) Torrey P., Vogelsberger M., Sijacki D., Springel V., Hernquist L., 2012, MNRAS, 427, 2224
- Übler et al. (2014) Übler H., Naab T., Oser L., Aumer M., Sales L. V., White S. D. M., 2014, MNRAS, 443, 2092
- van den Bosch (1998) van den Bosch F. C., 1998, ApJ, 507, 601
- van den Bosch et al. (2002) van den Bosch F. C., Abel T., Croft R. A. C., Hernquist L., White S. D. M., 2002, ApJ, 576, 21
- Vitvitska et al. (2002) Vitvitska M., Klypin A. A., Kravtsov A. V., Wechsler R. H., Primack J. R., Bullock J. S., 2002, ApJ, 581, 799
- Vogelsberger et al. (2013) Vogelsberger M., Genel S., Sijacki D., Torrey P., Springel V., Hernquist L., 2013, MNRAS, 436, 3031
- Vogelsberger et al. (2014a) Vogelsberger M. et al., 2014a, Nature, 509, 177
- Vogelsberger et al. (2014b) Vogelsberger M. et al., 2014b, MNRAS, 444, 1518
- Welker et al. (2014) Welker C., Devriendt J., Dubois Y., Pichon C., Peirani S., 2014, MNRAS, 445, L46
- Wellons et al. (2015) Wellons S. et al., 2015, MNRAS, 449, 361
- White (1978) White S. D. M., 1978, MNRAS, 184, 185
- White & Rees (1978) White S. D. M., Rees M. J., 1978, MNRAS, 183, 341
- York et al. (2000) York D. G. et al., 2000, The Astronomical Journal, 120, 1579
- Zavala et al. (2012) Zavala J., Avila-Reese V., Firmani C., Boylan-Kolchin M., 2012, MNRAS, 427, 1503
- Zavala et al. (2016) Zavala J. et al., 2016, MNRAS, 460, 4466
- Zavala, Okamoto & Frenk (2008) Zavala J., Okamoto T., Frenk C. S., 2008, MNRAS, 387, 364
- Zjupa & Springel (2017) Zjupa J., Springel V., 2017, MNRAS, 466, 1625
Appendix A The kappa morphological parameter
This appendix contains an expanded discussion about the morphological parameter, which was introduced in equation (2). In particular, we calculate values for a few idealized, analytically tractable stellar systems, and then show that can be used as a proxy for rotational support in our simulated galaxies.
Since the -component of a particle’s specific angular momentum is , where is the distance to the -axis and is the azimuthal component of the velocity, can be conveniently expressed as
| (5) |
where and represent mass and total velocity, respectively, and the sum is carried out over all stellar particles. Expression (5) shows that, by construction, is similar to other kinematic morphological parameters such as (e.g. Dubois et al., 2016), except that does not distinguish the direction of rotation about the -axis (i.e. co-rotating or counter-rotating), as discussed later in this appendix.
Furthermore, if we model a stellar system as being composed of infinitely many particles and having a smooth density distribution , where denotes position with respect to the galactic centre, then can also be expressed as
| (6) |
where and are averaged over particles found within a small volume around position . Note that, for a spherically symmetric system, equation (6) becomes
| (7) |
where is the distance to the galactic centre.
For illustrative purposes, below we calculate for some simple dynamical systems, some of which may not exactly correspond to real or simulated galaxies.
-
•
Highly eccentric orbits (): A system with highly eccentric orbits has and , where and are the the radial and polar velocity components, respectively (i.e. , where is the polar angle). In this system, stars in radial orbits dominate the kinetic energy but do not contribute to the angular momentum, so in the limiting case of purely radial orbits we have . In theory, such a system could arise from the collapse of an isolated, non-rotating cloud of gas. However, these singular systems do not exist in Illustris, as demonstrated in Section 3.3.
-
•
Dispersion-supported, isotropic stellar system (): Consider a spherically symmetric system where all three velocity components have the same statistical distribution at any radius . Then, for a randomly chosen -axis, we have . Substituting into equation (7) yields . As shown in Section 3.3, some Illustris galaxies have values in this range, while some of them have even smaller values (), presumably due to a combination of high velocity dispersion and somewhat eccentric orbits.
-
•
Cold rotating disc (): Finally, a stellar system where all particles move in circular orbits about the -axis has everywhere. Therefore, from equation (6), this system has . Note that this is only valid for a thin, dynamically cold disc. In general, stars belonging to a thick, dynamically hot disc oscillate along the -direction, which would lead to . Galactic discs in Illustris are somewhat thick, reaching maximum values around 0.7. Also note that a cold, disc-like system where roughly half of the stars rotate in the direction of the total angular momentum, while the other half counter-rotate, would also have (and yet almost no net rotation). Although mathematically possible, this configuration does not seem common in cosmological simulations, as shown below.
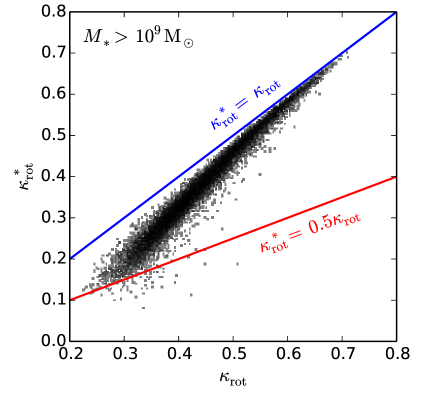
Because of the sign ambiguity illustrated in the last point, does not formally measure ordered rotation along the -axis. In practice, however, for cosmologically simulated galaxies turns out to be an excellent proxy for ordered rotation.888See also figure 1 in Sales et al. (2012). To demonstrate this, we consider an alternative quantity , which is also defined by equation (2) except that the sum is only carried out over stars that circulate in the same direction as the total stellar angular momentum (namely, stars that have ). The denominator is unchanged (i.e. all stars contribute to the total kinetic energy).
Fig. 11 shows the relationship between and for the Illustris galaxy sample, with a greyscale showing the overall galaxy distribution. Encouragingly, what we consider disc-dominated systems in this paper turn out to be truly rotation-supported objects, with (since none or very few stars counter-rotate), while dispersion-supported systems have (since roughly half of the stars counter-rotate).
More importantly, Fig. 11 shows that and are very strongly correlated in our simulated galaxies, with a Pearson correlation coefficient of . In previous work, Sales et al. (2012) showed that is strongly correlated with the fraction of stars in corotating circular orbits (their figure 1). All of this justifies the use of as a proxy for rotational support in a galaxy, as we do throughout this paper.
Appendix B Galaxy morphology and
stellar angular momentum
Since (or, similarly, the disc-to-total fraction D/T) and the specific angular momentum are both associated with the rotation of the galactic stellar component, and yet in the main body of this paper we focused only on the former, it is beneficial to investigate what are exactly the differences between these two quantities, as we briefly do in this appendix.
Fig. 12 shows that the correlation between and is stronger at low masses (left-hand panels), becoming weaker in more massive galaxies (right-hand panels). At very high masses, , the galaxy sample is composed of dispersion-dominated spheroids with low values, but which nevertheless exhibit a wide range of specific angular momenta. This suggests that, in general, galaxy mergers might not decrease the angular momentum of the stellar component, but merely redistribute it to larger radii. This inside-out transport of angular momentum had already been observed for DM (Zavala, Okamoto & Frenk, 2008; Sharma, Steinmetz & Bland-Hawthorn, 2012).
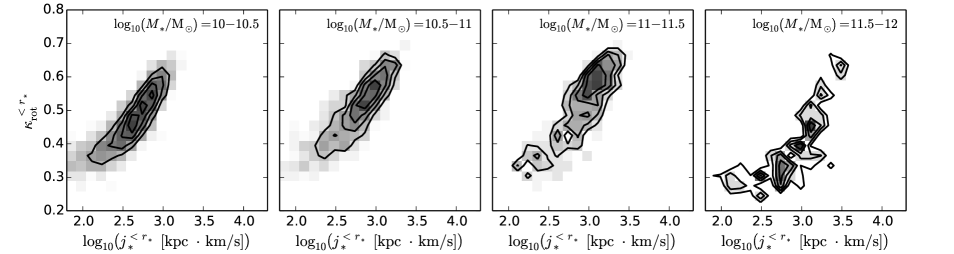
Fig. 13 is similar to Fig. 12, except that and have been calculated by considering only stars within two stellar half-mass radii, a region which, for practical purposes, is often considered to be ‘the galaxy’ in many simulation studies. Within such an inner region, and appear to be well correlated even in the most massive galaxies. Nevertheless, the specific angular momentum of massive, dispersion-dominated (low values) galaxies appears to have decreased by an order of magnitude, suggesting that a large fraction of their angular momentum must be found beyond two stellar half-mass radii.
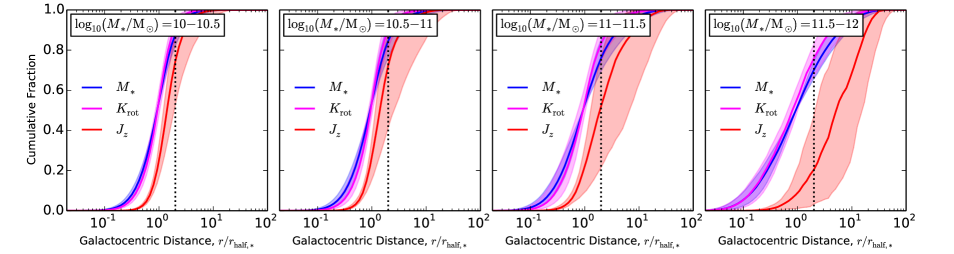
In order to show such radial trends more clearly, Fig. 14 shows cumulative radial profiles of stellar mass (blue), (magenta, as defined in equation 2), and angular momentum along the -axis (red), considering galaxies in the same stellar mass bins as the previous two figures. The solid lines and shaded regions correspond to the median trends and 1 ranges, respectively. In each panel, the vertical dotted line is located at two stellar half-mass radii. This figure illustrates perhaps the most important difference between and : the former quantity is essentially ‘mass-weighted,’ as seen from the fact that the blue and magenta lines follow each other quite closely, whereas angular momentum is to some extent ‘distance-weighted,’ such that a few stars orbiting at large radii can have a substantial impact on the galaxy’s angular momentum.