Linear spectropolarimetry of polarimetric standard stars with VLT/FORS2††thanks: Based on archival calibration data collected at the European Organisation for Astronomical Research in the Southern Hemisphere.
Abstract
We reduced ESO’s archival linear spectropolarimetry data (4000-9000Å) of 6 highly polarized and 8 unpolarized standard stars observed between 2010 and 2016, for a total of 70 epochs, with the FOcal Reducer and low dispersion Spectrograph (FORS2) mounted at the Very Large Telescope. We provide very accurate standard stars polarization measurements as a function of wavelength, and test the performance of the spectropolarimetric mode (PMOS) of FORS2. We used the unpolarized stars to test the time stability of the PMOS mode, and found a small (0.1%), but statistically significant, on-axis instrumental polarization wavelength dependency, possibly caused by the tilted surfaces of the dispersive element. The polarization degree and angle are found to be stable at the level of 0.1% and 0.2 degrees, respectively. We derived the polarization wavelength dependence of the polarized standard stars and found that, in general, the results are consistent with those reported in the literature, e.g. Fossati et al. (2007) who performed a similar analysis using FORS1 data. The re-calibrated data provide a very accurate set of standards that can be very reliably used for technical and scientific purposes. The analysis of the Serkowski parameters revealed a systematic deviation from the width parameter reported by Whittet et al. (1992). This is most likely explained by incorrect effective wavelengths adopted in that study for the R and I bands.
keywords:
stars: general – instrumentation: polarimeters – (ISM:) dust, extinction1 Introduction
Spectropolarimetry is a technique that provides additional information to those given by simple intensity measurements. For instance, linear spectropolarimetry can probe the geometry of Supernova explosions (see Wang & Wheeler (2008) for a comprehensive review), circumstellar and interstellar dust properties (see e.g. Serkowski et al. (1975)), and the magnetic fields of galaxies (see e.g. Scarrott (1996), Scarrott et al. (1996)).
Given the comparatively low levels of polarization that are typical in this kind of studies, it is important the polarimeter being used is properly calibrated. The main aim of this work is to provide a re-calibration of a sub-set of highly polarized standard stars, which are not too bright to be observed with large telescopes, and can be used to verify the performance of other similar instruments in the southern hemisphere. In addition, related to the fact that ESO’s Quality Control Group monitors polarimetric standards since 2009, we test the performance of the FOcal Reducer and low dispersion Spectrograph (FORS2) instrument mounted at the Very Large Telescope (VLT), in terms of stability and accuracy, by means of a thorough analysis of archival calibration data of highly linearly polarized and unpolarized standard stars.
Fossati et al. (2007) presented an analysis of standard stars observations obtained between 1999 and 2005 in PMOS and imaging-polarimetry (IPOL) mode with FORS1. They investigated the FORS1 stability in both, PMOS and IPOL mode, and found a small instrumental offset in the Stokes Q parameter which appears in PMOS mode only. This study is meant to further investigate and characterize that offset using FORS2 data.
2 Instrumental setup and observations
FORS2 is currently mounted at the Cassegrain focus of the ESO’s Antu VLT unit. This focal reducer is equipped with a polarimetric mode, which can be selected by introducing in the light path a Wollaston prism and a rotatable super-achromatic half-wave retarder plate coupled to a grism and/or a filter to perform linear imaging or spectro-polarimetry (Appenzeller, 1967; Appenzeller et al., 1998; ESO, 2015).
For our purposes, we selected eight standard stars with zero polarization, and six highly polarized standard stars extracted from the FORS Standard Fields and Stars list111 (listed in Table 1). All stars from the FORS Standard Fields and Stars list (i.e. our sample), were also analyzed by Fossati et al. (2007). They additionally considered three polarized standard stars (HD 345310, HD 111579 and BD -13 5073), 8 unpolarized stars (WD 2359-434, WD 0310-688, WD 1616-154, WD 1620-391, HD 176425, WD 2007-303, WD 2039-202, WD 2149+021) and HD 64299, which was erroneously suggested as an unpolarized standard star, but is in fact polarized at the 0.1 level (see e.g. Masiero et al. (2007)).
From the archive we selected observations obtained in PMOS mode with grism 300V, without an order separating filter, and with the half-wave retarder plate positioned at angles of 0∘, 22.5∘, 45∘, and 67.5∘. The half-wave retarder plate angle is measured between the acceptance axis of the ordinary beam of the Wollaston prism (which is aligned to the north-south direction) and the fast axis of the retarder plate. In order to allow a time trend analysis, the stars were selected to have observations at multiple epochs (40 epochs in total of unpolarized, and 30 of polarized stars), spanning 5 years. The stars were placed on the central slit of the PMOS focal mask, very close to the optical axis of the instrument. The spectrum produced by the grism is split by the Wollaston prism into an ordinary (o) and extraordinary (e) beam, which are separated by a throw of about 22 arcseconds.
| Name | RA | DEC | V | Spec. | No. of | |
| (J2000) | (J2000) | (mag) | type | Type | Epochs | |
| HD 10038 | 01 37 18.59 | -40 10 38.46 | 8.1 | A2mA5-F0 | unPol. | 8 |
| HD 13588 | 02 11 16.69 | -46 35 06.17 | 7.9 | A1m | unPol. | 4 |
| HD 42078 | 06 06 41.04 | -42 17 55.69 | 6.2 | Am | unPol. | 5 |
| HD 97689 | 11 13 50.75 | -52 51 21.22 | 6.8 | A0m | unPol. | 12 |
| WD 1615-154 | 16 17 55.26 | -15 35 51.93 | 13.4 | DA1.7 | unPol. | 1 |
| WD 1620-391 | 16 23 33.84 | -39 13 46.16 | 11.0 | DA2 | unPol. | 7 |
| WD 2039-202 | 20 42 34.75 | -20 04 35.95 | 12.4 | DA2.5 | unPol. | 2 |
| WD 2149+021 | 21 52 25.38 | +02 23 19.54 | 12.7 | DA2.8 | unPol. | 1 |
| NGC 2024 1 | 05 41 37.85 | -01 54 36.5 | 12.2 | B0.5V | Pol. | 7 |
| Vela1 95a | 09 06 00.01 | -47 18 58.2 | 12.1 | OB+ | Pol. | 11 |
| Hiltner 652b | 17 43 19.59 | -28 40 32.76 | 10.8 | B1II-III | Pol. | 8 |
| HDE 316232 | 17 45 43.70 | -29 13 18.15 | 10.4 | O9IV | Pol. | 1 |
| BD -14 4922 | 18 11 58.10 | -14 56 09.01 | 9.73 | O9.5 | Pol. | 2 |
| BD -12 5133 | 18 40 01.70 | -12 24 06.92 | 10.4 | B1V | Pol. | 1 |
| The coordinates, brightness and spectral type were taken from the SIMBAD Astronomical | ||||||
| Database. Type indicates if the star is polarized (Pol.) or unpolarized (unPol.), and No. of | ||||||
| Epochs is the number of epochs. | ||||||
| a in Fossati et al. (2007) designated as Ve 6-23. | ||||||
| b in Fossati et al. (2007) designated as CD-28 13479. | ||||||
3 Data reduction
After excluding saturated frames, the data were reduced using standard procedures in IRAF. Wavelength calibration was achieved using He-Ne-Ar arc lamp exposure. The typical RMS accuracy is 0.3 Å. Although it is very difficult to achieve a complete flat fielding correction in the presence of polarization optics, the effects of improper correction were minimized by taking advantage of the redundant number of half-wave positions (see Patat & Romaniello (2006)).
Ordinary and extra-ordinary beams were extracted in an unsupervised way using the PyRAF apextract.apall procedure, with a fixed aperture size of 10 pixels. To avoid spectrum tracing problems, the input frames were properly trimmed to exclude the low signal-to-noise at the edges of the spectral range. The final effective wavelength range is 3950-9300 Å. We calculated the total flux in BVRI passbands by integrating the total flux weighted with Bessel’s BVRI passband filters, and computed the synthetic broad-band polarization degree and polarization angle corresponding to each passband. We also binned the spectra in 50 bins, in order to obtain a larger signal-to-noise ratio, and calculated the Stokes parameters Q and U, polarization degree , and polarization angle as a function of wavelength. The signal-to-noise ratio (SNR) is typically between 500 and 2000 per 50 bin, tabulated for each individual epoch at a given wavelength in Table LABEL:tbunpol and Table LABEL:tbpol for unpolarized and polarized standard stars respectively.
The Stokes parameters Q and U were derived via Fourier transformation, as described in the FORS2 User Manual:
| (1) |
where are the normalized flux differences between the ordinary () and extra-ordinary () beams:
| (2) |
at different half-wave retarder plate position angles .
Although FORS2 is equipped with a super-achromatic half wave plate, residual retardance chromatism is present. The wavelength dependent retardance offset () is tabulated in the FORS2 User Manual (ESO, 2015). The chromatism was corrected through the following rotation of the Stokes parameters (Bagnulo et al., 2009; Patat & Taubenberger, 2011):
| (3) |
Hereafter, and are noted as Q and U.
4 Results and Discussion
4.1 Unpolarized stars
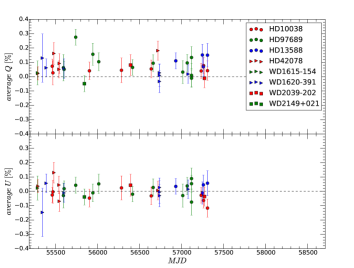
The analysis of FORS2 linear polarization stability and accuracy is based on eight unpolarized standards stars, observed at 40 epochs in total, between 2010 and 2015 (see Table 1). For all stars and each epoch, we calculated the mean value of the Stokes parameters and in the 3950-9300 Å wavelength range (Passband "all" in Table LABEL:tbunpol), which is shown in Figure 1. The values do not show statistically significant variations over the full time range, with very similar standard deviations of and . However, a small but statistically significant instrumental offset is detected in . The weighted mean of the Stokes parameter of all stars and epochs is 0.070.01%, while the corresponding value for is 0.000.01%.
To investigate possible wavelength dependent effects, we calculated the weighted mean of and as a function of wavelength using all observations of unpolarized standard stars. A clear, wavelength dependent offset is detected in (Figure 2). The first-order, best fit laws (red lines in Figure 2) are as follows:
| (7) |
where is expressed in Å. These relations provide a handy correction to be applied to the observed Q and U values. Rigorously speaking, this implicitly assumes that the correction is additive and does not depend on the incoming signal. This approximation probably holds only to first order. The exact prescription can only be obtained with a proper characterization of the Mueller matrices that describe the optical system, which is beyond the scope of this paper.
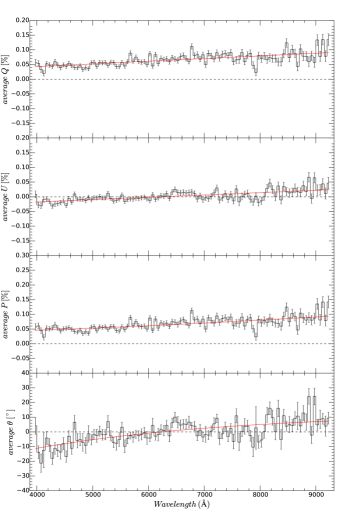
Fossati et al. (2007) performed a similar analysis using observations of standard stars obtained with FORS1 from 1999 to 2005 in both spectropolarimetric (PMOS) and imaging polarimetry (IPOL) mode. For PMOS, they found that the weighted average of all values in PMOS mode are consistent with a null value, but detected an offset of 0.070.01%, and 0.090.01 % in and respectively. They did not detect any offset in IPOL mode, and concluded that the offset may be associated with some, but not all, grism and filter combinations.
Our results, based on observations that were taken through the 300V grism (ID: +10) and no order-sorting filters, confirm the findings of Fossati et al. (2007) and lead us to conclude that the source of the instrumental polarization causing the offset in probably resides in the inclined surface of the prism that is coupled to the transmission grating in the FORS1 and FORS2 grisms.
4.2 Polarized stars
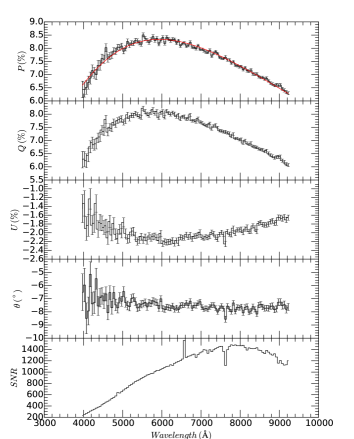
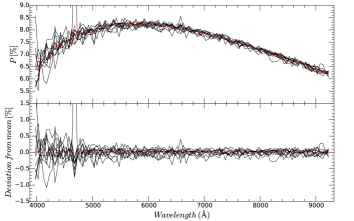
For our analysis we reduced a sample of six highly polarized standard stars (Table 1) observed with FORS2 between 2009 and 2015 on 30 different epochs. The data were corrected for instrumental polarization using the relations derived from the unpolarised stars (Eqs. 7). The results for the individual epochs are given in Table LABEL:tbpol, while weighted means of all epochs are listed in Table 2. An example of polarization wavelength dependence is shown in Figure 3, and a Q/U diagram in Figure 4. As expected for polarization generated by interstellar dust sharing the same alignment angle, the polarization angle is constant, and the points on the Q/U diagram follow a straight line.
| Serkowski law | ||||||||
|---|---|---|---|---|---|---|---|---|
| Name | Passband | |||||||
| Vela1 95 | 5864.5 7.4 | 8.295 0.004 | 1.34 0.01 | |||||
| B | 7.645 0.044 | 7.445 0.044 | -1.739 0.046 | 172.76 0.05 | ||||
| V | 8.163 0.011 | 7.834 0.011 | -2.295 0.012 | 172.41 0.02 | ||||
| R | 7.927 0.003 | 7.56 0.003 | -2.383 0.003 | 172.06 0.01 | ||||
| I | 7.151 0.002 | 6.9 0.002 | -1.881 0.002 | 171.95 0.01 | ||||
| BD -14 4922 | 5452.5 13.9 | 6.137 0.007 | 1.3 0.02 | |||||
| B | 5.801 0.024 | -0.992 0.024 | 5.715 0.024 | 49.7 0.07 | ||||
| V | 6.096 0.012 | -0.955 0.012 | 6.021 0.012 | 49.8 0.05 | ||||
| R | 5.818 0.006 | -0.864 0.005 | 5.753 0.006 | 49.7 0.04 | ||||
| I | 4.99 0.006 | -0.796 0.006 | 4.926 0.006 | 49.24 0.05 | ||||
| HDE 316232 | 5591.1 18.3 | 5.017 0.008 | 1.2 0.03 | |||||
| B | 4.679 0.023 | 4.637 0.023 | 0.619 0.021 | 3.61 0.09 | ||||
| V | 4.931 0.014 | 4.901 0.014 | 0.547 0.012 | 3.51 0.07 | ||||
| R | 4.772 0.007 | 4.745 0.007 | 0.508 0.006 | 3.37 0.06 | ||||
| I | 4.214 0.008 | 4.176 0.008 | 0.562 0.007 | 3.53 0.08 | ||||
| Hiltner 652 | 5776.5 9.0 | 6.467 0.005 | 1.17 0.01 | |||||
| B | 5.948 0.017 | 5.948 0.017 | -0.054 0.017 | 179.52 0.05 | ||||
| V | 6.371 0.009 | 6.367 0.009 | -0.198 0.009 | 179.44 0.03 | ||||
| R | 6.218 0.004 | 6.214 0.004 | -0.218 0.004 | 179.39 0.03 | ||||
| I | 5.613 0.004 | 5.612 0.004 | -0.041 0.004 | 179.46 0.03 | ||||
| NGC 2024 1 | 6340.4 4.7 | 9.855 0.004 | 1.29 0.01 | |||||
| B | 8.602 0.044 | 0.583 0.045 | -8.582 0.044 | 136.43 0.05 | ||||
| V | 9.548 0.013 | 0.122 0.013 | -9.546 0.013 | 135.94 0.02 | ||||
| R | 9.671 0.004 | -0.0 0.004 | -9.67 0.004 | 135.93 0.01 | ||||
| I | 9.009 0.002 | 0.398 0.002 | -8.999 0.002 | 135.9 0.01 | ||||
| BD -12 5133 | 5049.5 35.5 | 4.369 0.01 | 1.2 0.04 | |||||
| B | 4.217 0.027 | 1.688 0.027 | -3.865 0.027 | 146.54 0.12 | ||||
| V | 4.266 0.016 | 1.568 0.016 | -3.968 0.016 | 145.88 0.09 | ||||
| R | 3.996 0.008 | 1.406 0.008 | -3.74 0.008 | 145.62 0.08 | ||||
| I | 3.348 0.009 | 1.222 0.009 | -3.117 0.009 | 145.28 0.11 | ||||

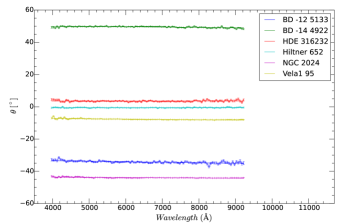
The wavelength dependence of the polarization angle was characterized by fitting a second order polynomial to the calculated weighted mean of the polarization angle (Figure 5). From the values of the best fit coefficients we conclude that there is no significant - dependence. The polarization angles are all constant to within the measurement errors, with slopes d/d between -2.5 and 0.53 degree/m.
We tested the reproducibility of the observations using stars observed at least at two epochs: Vela1 95, Hiltner 652, NGC 2024 1 and BD-144922. An example for Vela1 95 is presented in Fig. 6. The root mean square deviation from the mean polarization values are 0.21 (Vela1 95, 11 epochs), 0.12 (Hiltner 652, 8 epochs), 0.12% (NGC 2024 1, 7 epochs), and 0.05 (BD-144922, 2 epochs).
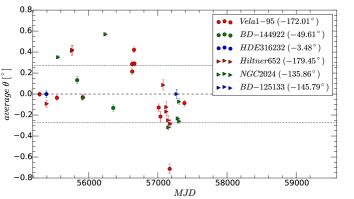
We finally tested the HWP positioning stability, by calculating the residuals of the mean values for all epochs of the polarized stars. No systematic jumps are detected, while erratic fluctuations are present, with a peak-to-peak amplitude of about 1.2∘ and a standard deviation of 0.27∘ (Figure 7). Given the typical statistical errors of the single measurements, the observed fluctuations are statistically very significant and certainly not due to the photon noise. The most likely interpretation is a possible drift in the absolute positioning of the retarder plate and/or of the analyzer. The estimated rms deviation (0.3 degrees) hence represents the typical maximum accuracy one can expect on the polarization angle for very high signal-to-noise ratios.
4.2.1 Comparison with the literature
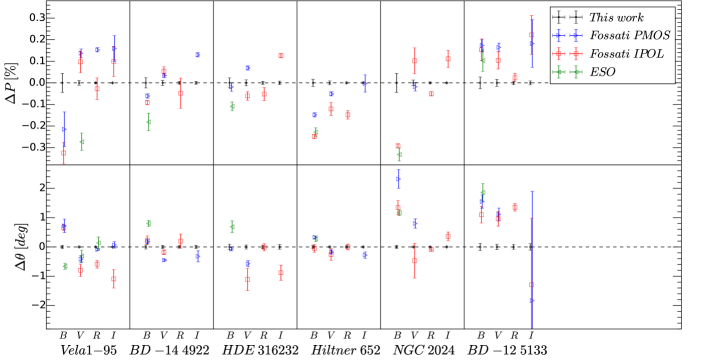
We compared our synthetic broad-band results (Table 2) to those reported by Fossati et al. (2007) (their Table 2) and the values based on data taken with FORS1 during commissioning, given in the FORS webpage222. Figure 8 shows the polarization and polarization angle differences, and , between our measurements and those published in the literature: = - and = - .
The average polarization deviation of all values, , obtained in PMOS mode by Fossati et al. (2007) from values obtained in this work is 0.01, with a root mean square deviation of 0.17. Also the values obtained by Fossati et al. (2007) in IPOL mode are consistent with our results, with an average of -0.02 and an RMS of 0.15. Our results are on average larger than the values given in the FORS webpage, with = -0.15 and an RMS of 0.36.
For the polarization angle, the average deviation from the PMOS values given in Fossati et al. (2007) is =0.17∘, with an RMS of 0.91∘; =-0.03∘, with an RMS of 0.77∘ for IPOL mode values (Fossati et al., 2007); and =0.50∘, with an RMS of 0.76∘ for the values given in the FORS webpage.
Thus, our results are, in general, in good agreement with previous estimates. The discrepancies with results given in Fossati et al. (2007) are consistent with the RMS variation found in the repeatability test (RMS 0.2, see 4.2), and might be due to star variability or instrumental effects (e.g. the HWP positioning uncertainty, see Figure 7), while the discrepancy from the values given in the FORS webpage is probably due to systematic differences between FORS2 and FORS1.
We also compared our Serkowski law fitting results for the 6 polarized standard stars to a data set of 105 objects studied by Whittet et al. (1992). They collected data obtained polarimetric observation in UBVRIJHK passbands using the Hartfield polarimeter (described by Brindle et al. (1986), and Bailey & Hough (1982)) on the 3.9-m AAT at Siding Spring Observatory, and the 3.8-m UKIRT at Mauna Kea Observatory. As shown in Figure 9, our results deviate by 2-3 from the best fit relation found by Whittet et al. (1992).

This deviation, which is statistically significant, cannot be explained by measurement errors, and calls for further investigation. For this reasons, we have looked in more detail the case of Vela1 95, which is included in the Whittet et al. sample. For this object, Whittet et al. (1992) determined a =5500200 Å, =8.080.07 % and =1.100.06. From our data, we determined =58647 Å, =8.2950.004 % and =1.340.01.
In Figure 10 we compare the Whittet et al. (1992) measurements of Vela1 95 to our FORS2 measurements. The figure also includes the Serkowski law best fit to Whittet et al.’s data (=5521111 Å, =8.080.07 % and =1.100.05; which is consistent to the Serkowski fit parameters in Whittet et al. (1992)), compared to a fit to FORS2 data (=58647 Å, = 8.2950.004 % and =1.340.01), and Whittet et al. BVRI data points only (=5606 126 Å, =8.11 0.08 % and =1.250.19). While the FORS2 data perfectly match the B and V measurements by Whittet et al., a significant difference is seen in R and I passbands. This strongly suggests that the problem does not reside in the different wavelength ranges used in the two studies. The explanation for the observed discrepancy is most likely related to the effective wavelengths adopted by Whittet et al. (1992) in their work. The authors list the bandpass properties in their Table 1. They also remark that their measurements are at an effective wavelength of 2.04 m rather than at the usual value of 2.2m. This is justified by an absorption in the Foster prism, which narrows the passband and reduces the effective wavelength. However, the authors do not explain why they do not adopt the usual R and I values given in the instrument description (Brindle et al. (1986); Bailey & Hough (1982)). The central wavelengths reported by Whittet et al. (1992) are: 0.36 m (U), 0.43 m (B), 0.55 m (V), 0.63 m (R), 0.78 m (I), 1.21 m (J), 1.64 m (H) and 2.04 m (K). On the other hand, Brindle et al. (1986) list the following wavelengths: 0.36 m (U), 0.43 m (B), 0.55 m (V), 0.72 m (R), 0.80 m (I), 1.2 m (J), 1.64 m (H) and 2.19 m (K), which are also consistent with wavelengths in Bailey & Hough (1982), except that the latter specify 2.14 m for the effective wavelength of the K passband. The difference in the R and I effective wavelengths is evident.
When using 0.72 m and 0.80 m for R and I respectively, a Serkowski law fit to all polarimetric points gives: =5732160 Å, =8.280.12 % and =1.240.09. When fitting the BVRI data only, the best fit parameters are: =5834168 Å, =8.420.22 % and =1.650.45. The results are summarized in Table 3. Since spectropolarimetric data do not suffer from the additional problem caused by the need of properly characterizing the photometric system, and given the superior quality of the data presented here and its higher signal to noise, we tend to believe our results are very robust and provide a solid reference. On these grounds, we suspect that the , and values reported by Whittet et al. (1992) are systematically smaller than real. We will further investigate this problem and its consequences in a separate study, using observations along the lines of sight to a larger sample of Galactic reddened stars.
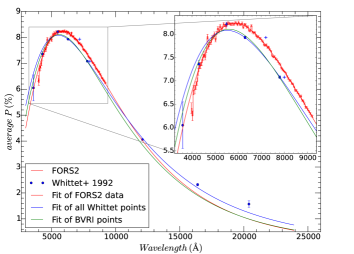
| () | () | ||
| Whittet et al. (1992) | 5500 200 | 8.08 0.07 | 1.10 0.06 |
| Best fit to FORS2 data | 5864 7 | 8.295 0.004 | 1.34 0.01 |
| Best fit to all Whittet et al. data points | 5521 111 | 8.08 0.07 | 1.10 0.05 |
| Best fit to Whittet et al. BVRI data only | 5606 126 | 8.11 0.08 | 1.25 0.19 |
| Best fit to Whittet et al. UBVR’I’JHK data | 5732 160 | 8.28 0.12 | 1.24 0.09 |
| Best fit to Whittet et al. BVR’I’ data only | 5834 168 | 8.42 0.22 | 1.65 0.45 |
| R’ and I’ indicate the modified passband wavelengths, 0.72 m and 0.80 m for R and I respectively. | |||
5 Summary and conclusions
In this study we used archival FORS2 observations of polarimetric standard stars to characterize the performance and stability of FORS2 mounted at the VLT. For this purpose we analyzed 8 unpolarized standard stars observed on 40 epochs, and 6 polarized standard stars (30 epochs). Our main results can be summarized as follows:
-
1.
We confirm the instrumental wavelength dependent polarization detected by Fossati et al. (2007). The spurious signal steadily grows from the blue to the red, ranging from 0.05% (4000Å) to 0.10% (9000Å). The vectorial correction for and (see Equation 7) can be applied to the observed Stokes parameters. The physical cause of this instrumental polarization is still unclear, but it is most likely related to the tilted surfaces of the despersive element.
-
2.
We tested the repeatability of total linear polarization using observations of polarized standard stars spanning 5 years. The RMS variation is 0.2. For comparison, the typical error per 50 bin for a single epoch is 0.1.
-
3.
Using the same sample of polarized stars, we tested the HWP positioning stability, and found a RMS of 0.27∘. For comparison, the typical uncertainty in the weighted mean is 0.05∘, while the typical uncertainty per 50 bin for a single epoch is 0.5∘.
-
4.
Our analysis confirms that FORS2 can achieve a maximum accuracy of 0.1% and 0.3 degrees in polarization degree and angle, respectively. These values, which represent the instrumental limits of this focal reducer, are shown to be stable over timescales of years.
-
5.
As a by-product of our analysis, we studied the wavelength dependence of linear polarization for our set of polarized standard stars. Our polarization results are in good agreement with those reported in the literature (see Figure 8). Peak polarization (), peak wavelength () and width parameter () were determined via least squares fit of the classical Serkowski law to the observed data.
-
6.
Given the larger telescope size and the superb performance of FORS2, the data presented in this paper provide a robust re-calibration of a selected set of linear polarization standard stars that can be reliably used for both checking the performance of other polarimeters and calibrating scientific data obtained with those instruments.
-
7.
A comparison between the - values presented in this paper and those reported by Whittet et al. (1992) reveals a systematic and statistically significant deviation, with our values being larger. While this is partially caused by the shorter wavelength range covered by our FORS2 observations (4000-9000Å to be compared to the UBVRIJHK measurements by Whitthet et al.), it is clear that this cannot fully explain the observed differences. A closer investigation shows that the values reported by Whittet et al. (1992) are most likely offset because of incorrect effective wavelengths for R and I passbands. This is clearly visible when comparing the data for the standard star Vela1 95, which is common to both data sets.
-
8.
We expect that further studies, including larger sets of reddened Galactic stars, will show the same systematic discrepancy.
Acknowledgements
Based on observations made with ESO Telescopes at the Paranal Observatory under programme ID 60.A-9800, 60.A-9203, 084.B-0217, 084.D-0799, 085.D-0391, 089.D-0515, 091.D-0401, 290.D-5009.
References
- Appenzeller (1967) Appenzeller I., 1967, PASP, 79, 136
- Appenzeller et al. (1998) Appenzeller I., et al., 1998, The Messenger, 94, 1
- Bagnulo et al. (2009) Bagnulo S., Landolfi M., Landstreet J. D., Landi Degl’Innocenti E., Fossati L., Sterzik M., 2009, PASP, 121, 993
- Bailey & Hough (1982) Bailey J., Hough J. H., 1982, PASP, 94, 618
- Brindle et al. (1986) Brindle C., Hough J. H., Bailey J. A., Axon D. J., Hyland A. R., 1986, MNRAS, 221, 739
- ESO (2015) ESO 2015, FORS2 User Manual, issue 96.0, VLT-MAN-ESO-13100-1543. European Southern Observatory
- Fossati et al. (2007) Fossati L., Bagnulo S., Mason E., Landi Degl’Innocenti E., 2007, in Sterken C., ed., Astronomical Society of the Pacific Conference Series Vol. 364, The Future of Photometric, Spectrophotometric and Polarimetric Standardization. p. 503
- Masiero et al. (2007) Masiero J., Hodapp K., Harrington D., Lin H., 2007, PASP, 119, 1126
- Patat & Romaniello (2006) Patat F., Romaniello M., 2006, PASP, 118, 146
- Patat & Taubenberger (2011) Patat F., Taubenberger S., 2011, A&A, 529, A57
- Scarrott (1996) Scarrott S. M., 1996, QJRAS, 37, 297
- Scarrott et al. (1996) Scarrott S. M., Foley N. B., Gledhill T. M., Wolstencroft R. D., 1996, MNRAS, 282, 252
- Serkowski et al. (1975) Serkowski K., Mathewson D. S., Ford V. L., 1975, ApJ, 196, 261
- Wang & Wheeler (2008) Wang L., Wheeler J. C., 2008, ARA&A, 46, 433
- Whittet et al. (1992) Whittet D. C. B., Martin P. G., Hough J. H., Rouse M. F., Bailey J. A., Axon D. J., 1992, ApJ, 386, 562
| Name | Epoch | Passband | S/N | ||
|---|---|---|---|---|---|
| HD10038 | 2010-09-24 | all | 0.076 0.05 | -0.025 0.052 | |
| B | 0.065 0.012 | -0.02 0.013 | 1553 | ||
| V | 0.065 0.009 | -0.025 0.01 | 1927 | ||
| R | 0.079 0.005 | -0.034 0.006 | 1726 | ||
| I | 0.077 0.007 | -0.032 0.008 | 1282 | ||
| HD10038 | 2010-10-02 | all | 0.027 0.084 | -0.002 0.08 | |
| B | 0.023 0.022 | 0.027 0.021 | 908 | ||
| V | 0.012 0.016 | 0.011 0.015 | 1174 | ||
| R | 0.023 0.009 | 0.008 0.009 | 1062 | ||
| I | 0.013 0.012 | -0.008 0.011 | 799 | ||
| HD10038 | 2011-12-10 | all | 0.041 0.061 | -0.048 0.062 | |
| B | 0.031 0.014 | -0.055 0.014 | 1317 | ||
| V | 0.035 0.011 | -0.053 0.012 | 1608 | ||
| R | 0.049 0.007 | -0.064 0.007 | 1428 | ||
| I | 0.045 0.009 | -0.042 0.009 | 1050 | ||
| HD10038 | 2012-12-25 | all | 0.043 0.086 | 0.021 0.084 | |
| B | 0.045 0.021 | -0.0 0.02 | 917 | ||
| V | 0.046 0.016 | 0.005 0.016 | 1152 | ||
| R | 0.051 0.009 | 0.023 0.009 | 1032 | ||
| I | 0.044 0.012 | 0.038 0.012 | 768 | ||
| HD10038 | 2013-12-14 | all | 0.052 0.061 | -0.031 0.062 | |
| B | 0.041 0.014 | -0.062 0.014 | 1334 | ||
| V | 0.046 0.011 | -0.033 0.012 | 1608 | ||
| R | 0.055 0.007 | -0.032 0.007 | 1424 | ||
| I | 0.059 0.009 | -0.007 0.009 | 1045 | ||
| HD10038 | 2015-07-31 | all | 0.04 0.053 | -0.029 0.054 | |
| B | 0.037 0.014 | -0.034 0.014 | 1378 | ||
| V | 0.032 0.011 | -0.023 0.011 | 1760 | ||
| R | 0.041 0.006 | -0.028 0.006 | 1600 | ||
| I | 0.032 0.008 | -0.025 0.008 | 1230 | ||
| HD10038 | 2015-08-28 | all | 0.078 0.055 | -0.063 0.053 | |
| B | 0.03 0.013 | -0.07 0.013 | 1459 | ||
| V | 0.065 0.01 | -0.056 0.01 | 1806 | ||
| R | 0.083 0.006 | -0.06 0.006 | 1621 | ||
| I | 0.094 0.008 | -0.046 0.008 | 1214 | ||
| HD10038 | 2015-10-14 | all | 0.041 0.068 | -0.117 0.064 | |
| B | -0.003 0.017 | -0.117 0.016 | 1185 | ||
| V | 0.053 0.013 | -0.09 0.012 | 1478 | ||
| R | 0.063 0.007 | -0.108 0.007 | 1331 | ||
| I | 0.054 0.01 | -0.146 0.009 | 1002 | ||
| HD13588 | 2014-10-02 | all | 0.11 0.056 | 0.034 0.055 | |
| B | 0.154 0.014 | 0.001 0.014 | 1360 | ||
| V | 0.101 0.011 | 0.021 0.011 | 1751 | ||
| R | 0.106 0.006 | 0.05 0.006 | 1586 | ||
| I | 0.113 0.008 | 0.048 0.008 | 1196 | ||
| HD13588 | 2015-08-14 | all | 0.151 0.075 | -0.011 0.078 | |
| B | 0.099 0.017 | -0.058 0.017 | 1054 | ||
| V | 0.147 0.014 | 0.002 0.015 | 1273 | ||
| R | 0.15 0.008 | -0.02 0.009 | 1127 | ||
| I | 0.165 0.011 | -0.01 0.011 | 831 | ||
| HD13588 | 2015-08-26 | all | 0.067 0.068 | 0.047 0.068 | |
| B | 0.049 0.015 | 0.027 0.015 | 1635 | ||
| V | 0.057 0.013 | 0.038 0.013 | 1952 | ||
| R | 0.067 0.007 | 0.042 0.007 | 1713 | ||
| I | 0.074 0.01 | 0.057 0.01 | 1249 | ||
| HD13588 | 2015-10-14 | all | 0.149 0.082 | 0.055 0.087 | |
| B | 0.084 0.018 | 0.029 0.019 | 1303 | ||
| V | 0.134 0.016 | 0.04 0.016 | 1573 | ||
| R | 0.164 0.009 | 0.048 0.01 | 1389 | ||
| I | 0.183 0.012 | 0.081 0.013 | 1023 | ||
| HD97689 | 2011-02-04 | all | 0.063 0.092 | -0.028 0.087 | |
| B | 0.036 0.021 | -0.051 0.02 | 912 | ||
| V | 0.057 0.017 | -0.018 0.016 | 1123 | ||
| R | 0.07 0.01 | -0.006 0.009 | 996 | ||
| I | 0.065 0.013 | -0.014 0.013 | 733 | ||
| HD97689 | 2011-02-12 | all | 0.051 0.057 | 0.017 0.055 | |
| B | 0.047 0.012 | -0.014 0.012 | 1533 | ||
| V | 0.038 0.01 | 0.003 0.01 | 1843 | ||
| R | 0.05 0.006 | 0.007 0.006 | 1613 | ||
| I | 0.044 0.008 | 0.048 0.008 | 1154 | ||
| HD97689 | 2011-06-30 | all | 0.275 0.056 | 0.042 0.056 | |
| B | 0.183 0.013 | 0.014 0.012 | 1470 | ||
| V | 0.235 0.01 | 0.029 0.01 | 1781 | ||
| R | 0.266 0.006 | 0.043 0.006 | 1571 | ||
| I | 0.333 0.008 | 0.066 0.008 | 1147 | ||
| HD97689 | 2012-01-20 | all | 0.159 0.077 | -0.012 0.062 | |
| B | 0.113 0.019 | 0.01 0.015 | 1152 | ||
| V | 0.144 0.015 | -0.006 0.012 | 1442 | ||
| R | 0.138 0.008 | -0.001 0.007 | 1294 | ||
| I | 0.173 0.011 | -0.039 0.009 | 960 | ||
| HD97689 | 2012-03-30 | all | 0.104 0.062 | 0.051 0.068 | |
| B | 0.089 0.014 | 0.019 0.016 | 1232 | ||
| V | 0.085 0.012 | 0.025 0.013 | 1522 | ||
| R | 0.104 0.007 | 0.047 0.007 | 1356 | ||
| I | 0.122 0.009 | 0.084 0.01 | 999 | ||
| HD97689 | 2013-05-06 | all | 0.062 0.055 | -0.022 0.053 | |
| B | 0.071 0.013 | -0.008 0.012 | 1482 | ||
| V | 0.064 0.01 | -0.041 0.01 | 1835 | ||
| R | 0.065 0.006 | -0.02 0.006 | 1631 | ||
| I | 0.063 0.008 | -0.039 0.008 | 1201 | ||
| HD97689 | 2014-01-06 | all | 0.095 0.059 | 0.026 0.06 | |
| B | 0.065 0.014 | -0.015 0.014 | 1343 | ||
| V | 0.075 0.011 | 0.011 0.011 | 1661 | ||
| R | 0.096 0.006 | 0.026 0.006 | 1483 | ||
| I | 0.109 0.008 | 0.058 0.009 | 1094 | ||
| HD97689 | 2014-12-24 | all | 0.033 0.08 | -0.028 0.081 | |
| B | 0.008 0.018 | -0.015 0.018 | 1022 | ||
| V | 0.018 0.015 | -0.018 0.015 | 1229 | ||
| R | 0.033 0.009 | -0.045 0.009 | 1082 | ||
| I | 0.036 0.012 | -0.035 0.012 | 794 | ||
| HD97689 | 2015-02-15 | all | 0.099 0.059 | 0.035 0.06 | |
| B | 0.055 0.013 | 0.017 0.013 | 1387 | ||
| V | 0.043 0.011 | 0.025 0.011 | 1705 | ||
| R | 0.066 0.006 | 0.03 0.006 | 1501 | ||
| I | 0.143 0.009 | 0.016 0.009 | 1092 | ||
| HD97689 | 2015-04-07 | all | -0.01 0.057 | 0.053 0.058 | |
| B | -0.012 0.014 | 0.042 0.014 | 1334 | ||
| V | 0.001 0.011 | 0.054 0.011 | 1691 | ||
| R | -0.004 0.006 | 0.048 0.006 | 1523 | ||
| I | -0.024 0.008 | 0.048 0.008 | 1141 | ||
| HD97689 | 2015-04-07 | all | 0.009 0.084 | -0.078 0.092 | |
| B | -0.041 0.023 | -0.066 0.025 | 829 | ||
| V | -0.018 0.017 | -0.018 0.019 | 1073 | ||
| R | -0.006 0.009 | -0.058 0.01 | 985 | ||
| I | 0.053 0.012 | -0.122 0.013 | 776 | ||
| HD97689 | 2015-04-07 | all | 0.137 0.077 | 0.089 0.074 | |
| B | 0.142 0.021 | 0.002 0.02 | 976 | ||
| V | 0.103 0.016 | 0.045 0.015 | 1246 | ||
| R | 0.135 0.009 | 0.082 0.008 | 1140 | ||
| I | 0.136 0.011 | 0.151 0.01 | 894 | ||
| HD42078 | 2010-04-07 | all | 0.024 0.046 | 0.035 0.045 | |
| B | 0.066 0.01 | 0.035 0.01 | 1854 | ||
| V | 0.041 0.008 | 0.056 0.008 | 2217 | ||
| R | 0.046 0.005 | 0.053 0.005 | 1949 | ||
| I | -0.009 0.007 | 0.011 0.007 | 1419 | ||
| HD42078 | 2010-10-14 | all | 0.161 0.077 | 0.13 0.072 | |
| B | 0.132 0.019 | 0.077 0.018 | 1096 | ||
| V | 0.143 0.015 | 0.056 0.014 | 1367 | ||
| R | 0.162 0.008 | 0.086 0.008 | 1230 | ||
| I | 0.191 0.011 | 0.186 0.01 | 924 | ||
| HD42078 | 2010-12-13 | all | 0.053 0.06 | 0.044 0.061 | |
| B | 0.051 0.013 | 0.034 0.014 | 1379 | ||
| V | 0.046 0.011 | 0.026 0.011 | 1661 | ||
| R | 0.055 0.006 | 0.045 0.007 | 1459 | ||
| I | 0.061 0.009 | 0.055 0.009 | 1065 | ||
| HD42078 | 2010-12-17 | all | 0.092 0.069 | -0.07 0.072 | |
| B | 0.089 0.015 | -0.077 0.016 | 1183 | ||
| V | 0.078 0.013 | -0.067 0.013 | 1415 | ||
| R | 0.101 0.008 | -0.08 0.008 | 1246 | ||
| I | 0.101 0.01 | -0.063 0.011 | 911 | ||
| HD42078 | 2014-03-04 | all | 0.173 0.066 | 0.025 0.065 | |
| B | 0.158 0.009 | -0.059 0.009 | 1604 | ||
| V | 0.17 0.01 | -0.048 0.009 | 1651 | ||
| R | 0.204 0.006 | -0.013 0.006 | 1348 | ||
| I | 0.202 0.011 | 0.087 0.01 | 830 | ||
| WD1615-154 | 2010-04-02 | all | 0.022 0.083 | 0.023 0.084 | |
| B | -0.007 0.011 | -0.006 0.011 | 1440 | ||
| V | -0.028 0.013 | -0.003 0.013 | 1388 | ||
| R | 0.003 0.009 | 0.029 0.009 | 1088 | ||
| I | 0.038 0.013 | 0.014 0.013 | 720 | ||
| WD1620-391 | 2010-05-30 | all | 0.12 0.168 | -0.136 0.168 | |
| B | 0.014 0.019 | -0.059 0.018 | 794 | ||
| V | 0.124 0.024 | -0.01 0.023 | 751 | ||
| R | 0.115 0.017 | 0.01 0.017 | 547 | ||
| I | 0.348 0.028 | -0.34 0.028 | 339 | ||
| WD1620-391 | 2010-07-14 | all | 0.062 0.063 | 0.055 0.065 | |
| B | 0.042 0.01 | 0.01 0.01 | 1743 | ||
| V | 0.038 0.01 | 0.028 0.011 | 1818 | ||
| R | 0.06 0.007 | 0.048 0.007 | 1466 | ||
| I | 0.078 0.01 | 0.089 0.01 | 992 | ||
| WD1620-391 | 2011-02-11 | all | 0.056 0.068 | -0.011 0.065 | |
| B | 0.05 0.01 | -0.002 0.01 | 1596 | ||
| V | 0.053 0.011 | 0.017 0.01 | 1699 | ||
| R | 0.068 0.007 | 0.004 0.007 | 1372 | ||
| I | 0.057 0.01 | -0.049 0.01 | 922 | ||
| WD1620-391 | 2014-03-22 | all | 0.016 0.062 | 0.026 0.066 | |
| B | 0.017 0.009 | 0.004 0.01 | 1746 | ||
| V | 0.036 0.01 | -0.004 0.011 | 1814 | ||
| R | 0.047 0.006 | -0.01 0.007 | 1447 | ||
| I | -0.023 0.01 | 0.045 0.01 | 968 | ||
| WD1620-391 | 2014-03-22 | all | 0.009 0.077 | -0.004 0.079 | |
| B | 0.008 0.011 | -0.011 0.012 | 1396 | ||
| V | -0.004 0.012 | 0.015 0.013 | 1452 | ||
| R | 0.005 0.008 | 0.016 0.008 | 1160 | ||
| I | 0.005 0.012 | -0.04 0.012 | 778 | ||
| WD1620-391 | 2014-03-22 | all | -0.036 0.078 | -0.029 0.078 | |
| B | -0.029 0.011 | -0.008 0.011 | 1399 | ||
| V | -0.033 0.013 | -0.029 0.013 | 1455 | ||
| R | -0.049 0.008 | -0.024 0.008 | 1162 | ||
| I | -0.076 0.012 | -0.054 0.012 | 778 | ||
| WD1620-391 | 2015-02-26 | all | 0.018 0.064 | 0.012 0.065 | |
| B | -0.007 0.009 | -0.017 0.009 | 1714 | ||
| V | 0.001 0.01 | -0.005 0.01 | 1775 | ||
| R | 0.006 0.007 | -0.009 0.007 | 1415 | ||
| I | 0.038 0.01 | 0.029 0.01 | 942 | ||
| WD2039-202 | 2013-04-12 | all | 0.079 0.073 | 0.038 0.076 | |
| B | 0.046 0.012 | -0.068 0.013 | 1308 | ||
| V | 0.072 0.012 | -0.009 0.013 | 1464 | ||
| R | 0.073 0.008 | 0.014 0.008 | 1199 | ||
| I | 0.08 0.011 | 0.05 0.012 | 815 | ||
| WD2039-202 | 2015-09-08 | all | -0.011 0.066 | -0.039 0.066 | |
| B | -0.003 0.01 | -0.038 0.01 | 2143 | ||
| V | -0.008 0.011 | -0.056 0.011 | 2275 | ||
| R | -0.006 0.007 | -0.041 0.007 | 1831 | ||
| I | -0.02 0.01 | -0.039 0.01 | 1234 | ||
| WD2149+021 | 2011-10-11 | all | -0.048 0.056 | -0.038 0.056 | |
| B | -0.087 0.009 | -0.018 0.009 | 1776 | ||
| V | -0.026 0.009 | -0.057 0.009 | 2011 | ||
| R | -0.029 0.006 | -0.041 0.006 | 1625 | ||
| I | -0.055 0.009 | -0.058 0.009 | 1091 |
The signal-to-noise ratio, S/N, in individual bands is the average SNR between two 50 bins, from 4250-4350 (B band), 5450-5550 (V), 6250-6350 (R) and 7650-7850 (I).
| Serkowski law | ||||||||||
|---|---|---|---|---|---|---|---|---|---|---|
| Name | Epoch | Passband | S/N | |||||||
| Vela1-95 | 2010-04-07 | 5848.2 21.9 | 8.36 0.01 | 1.34 0.03 | ||||||
| B | 7.69 0.1 | 7.48 0.1 | -1.79 0.1 | 172.72 0.13 | 405 | |||||
| V | 8.23 0.03 | 7.9 0.03 | -2.3 0.03 | 172.43 0.06 | 965 | |||||
| R | 7.99 0.01 | 7.61 0.01 | -2.42 0.01 | 171.97 0.04 | 1210 | |||||
| I | 7.2 0.01 | 6.95 0.01 | -1.91 0.01 | 171.87 0.03 | 1516 | |||||
| Vela1-95 | 2010-12-14 | 5877.1 22.8 | 8.27 0.01 | 1.34 0.03 | ||||||
| B | 7.58 0.12 | 7.39 0.12 | -1.68 0.14 | 172.7 0.15 | 328 | |||||
| V | 8.14 0.03 | 7.8 0.03 | -2.32 0.04 | 172.27 0.07 | 801 | |||||
| R | 7.91 0.01 | 7.54 0.01 | -2.41 0.01 | 171.91 0.04 | 1013 | |||||
| I | 7.14 0.01 | 6.88 0.01 | -1.89 0.01 | 171.87 0.04 | 1287 | |||||
| Vela1-95 | 2011-12-22 | 5908.3 25.1 | 8.25 0.02 | 1.4 0.04 | ||||||
| B | 7.58 0.14 | 7.37 0.14 | -1.78 0.14 | 172.53 0.18 | 304 | |||||
| V | 8.08 0.04 | 7.75 0.04 | -2.3 0.04 | 172.3 0.08 | 739 | |||||
| R | 7.91 0.01 | 7.55 0.01 | -2.38 0.01 | 172.06 0.05 | 930 | |||||
| I | 7.11 0.01 | 6.85 0.01 | -1.91 0.01 | 171.76 0.05 | 1175 | |||||
| Vela1-95 | 2013-12-03 | 5913.5 17.4 | 8.29 0.01 | 1.38 0.02 | ||||||
| B | 7.59 0.15 | 7.41 0.15 | -1.65 0.17 | 173.13 0.18 | 378 | |||||
| V | 8.13 0.04 | 7.83 0.04 | -2.2 0.04 | 172.78 0.08 | 911 | |||||
| R | 7.94 0.01 | 7.59 0.01 | -2.32 0.01 | 172.32 0.05 | 1157 | |||||
| I | 7.17 0.01 | 6.93 0.01 | -1.85 0.01 | 172.1 0.05 | 1486 | |||||
| Vela1-95 | 2013-12-05 | 5869.6 23.3 | 8.31 0.01 | 1.36 0.03 | ||||||
| B | 7.63 0.14 | 7.43 0.14 | -1.72 0.17 | 172.83 0.17 | 301 | |||||
| V | 8.17 0.04 | 7.85 0.04 | -2.27 0.04 | 172.56 0.08 | 740 | |||||
| R | 7.93 0.01 | 7.58 0.01 | -2.35 0.01 | 172.19 0.05 | 951 | |||||
| I | 7.17 0.01 | 6.92 0.01 | -1.85 0.01 | 172.1 0.04 | 1240 | |||||
| Vela1-95 | 2013-12-31 | 5848.3 21.6 | 8.28 0.01 | 1.34 0.03 | ||||||
| B | 7.68 0.15 | 7.51 0.15 | -1.61 0.15 | 173.19 0.18 | 290 | |||||
| V | 8.15 0.04 | 7.86 0.04 | -2.16 0.04 | 172.89 0.08 | 695 | |||||
| R | 7.91 0.01 | 7.58 0.01 | -2.28 0.01 | 172.42 0.05 | 880 | |||||
| I | 7.14 0.01 | 6.91 0.01 | -1.81 0.01 | 172.22 0.05 | 1127 | |||||
| Vela1-95 | 2014-01-06 | 5881.1 19.3 | 8.32 0.01 | 1.35 0.03 | ||||||
| B | 7.63 0.12 | 7.45 0.12 | -1.67 0.13 | 172.86 0.14 | 352 | |||||
| V | 8.19 0.03 | 7.88 0.03 | -2.25 0.03 | 172.59 0.06 | 874 | |||||
| R | 7.95 0.01 | 7.61 0.01 | -2.32 0.01 | 172.35 0.04 | 1123 | |||||
| I | 7.19 0.01 | 6.95 0.01 | -1.85 0.01 | 172.11 0.04 | 1467 | |||||
| Vela1-95 | 2014-12-22 | 5831.1 31.7 | 8.26 0.02 | 1.34 0.04 | ||||||
| B | 7.57 0.18 | 7.36 0.18 | -1.78 0.18 | 172.5 0.21 | 244 | |||||
| V | 8.18 0.05 | 7.82 0.05 | -2.39 0.05 | 171.97 0.1 | 585 | |||||
| R | 7.87 0.01 | 7.49 0.01 | -2.43 0.01 | 171.77 0.06 | 742 | |||||
| I | 7.12 0.01 | 6.86 0.01 | -1.89 0.01 | 171.87 0.05 | 960 | |||||
| Vela1-95 | 2015-01-17 | 5695.0 83.7 | 8.23 0.04 | 1.21 0.09 | ||||||
| B | 7.72 0.24 | 7.51 0.24 | -1.77 0.26 | 172.63 0.28 | 171 | |||||
| V | 8.11 0.06 | 7.76 0.06 | -2.37 0.07 | 172.02 0.13 | 415 | |||||
| R | 7.81 0.02 | 7.43 0.02 | -2.42 0.02 | 171.8 0.08 | 526 | |||||
| I | 7.03 0.01 | 6.76 0.01 | -1.91 0.01 | 171.69 0.08 | 678 | |||||
| Vela1-95 | 2015-05-30 | 5866.9 40.9 | 8.18 0.02 | 1.3 0.05 | ||||||
| B | 7.52 0.25 | 7.16 0.25 | -2.3 0.25 | 170.57 0.31 | 168 | |||||
| V | 8.05 0.06 | 7.64 0.06 | -2.53 0.06 | 171.38 0.14 | 422 | |||||
| R | 7.84 0.02 | 7.41 0.02 | -2.57 0.02 | 171.21 0.08 | 539 | |||||
| I | 7.09 0.01 | 6.8 0.01 | -2.02 0.01 | 171.3 0.08 | 695 | |||||
| Vela1-95 | 2015-12-29 | 5692.1 30.6 | 8.34 0.02 | 1.22 0.03 | ||||||
| B | 7.9 0.18 | 7.72 0.18 | -1.69 0.18 | 173.17 0.2 | 260 | |||||
| V | 8.21 0.04 | 7.86 0.04 | -2.37 0.04 | 172.23 0.09 | 673 | |||||
| R | 7.91 0.01 | 7.52 0.01 | -2.45 0.01 | 171.82 0.05 | 879 | |||||
| I | 7.11 0.01 | 6.86 0.01 | -1.89 0.01 | 171.86 0.05 | 1184 | |||||
| BD-144922 | 2011-10-02 | 5429.6 21.0 | 6.14 0.01 | 1.33 0.03 | ||||||
| B | 5.82 0.04 | -1.06 0.04 | 5.72 0.04 | 50.01 0.11 | 667 | |||||
| V | 6.09 0.02 | -0.99 0.02 | 6.01 0.02 | 50.0 0.07 | 1133 | |||||
| R | 5.8 0.01 | -0.88 0.01 | 5.73 0.01 | 49.85 0.06 | 1180 | |||||
| I | 4.96 0.01 | -0.8 0.01 | 4.89 0.01 | 49.29 0.07 | 1096 | |||||
| BD-144922 | 2013-03-06 | 5470.4 18.6 | 6.14 0.01 | 1.32 0.03 | ||||||
| B | 5.79 0.03 | -0.95 0.03 | 5.71 0.03 | 49.5 0.09 | 812 | |||||
| V | 6.1 0.02 | -0.93 0.02 | 6.03 0.02 | 49.66 0.06 | 1296 | |||||
| R | 5.83 0.01 | -0.85 0.01 | 5.77 0.01 | 49.58 0.05 | 1302 | |||||
| I | 5.02 0.01 | -0.79 0.01 | 4.96 0.01 | 49.18 0.07 | 1126 | |||||
| HDE316232 | 2010-07-14 | 5591.1 18.3 | 5.02 0.01 | 1.22 0.03 | ||||||
| B | 4.68 0.02 | 4.64 0.02 | 0.62 0.02 | 3.61 0.09 | 1063 | |||||
| V | 4.93 0.01 | 4.9 0.01 | 0.55 0.01 | 3.51 0.07 | 1529 | |||||
| R | 4.77 0.01 | 4.75 0.01 | 0.51 0.01 | 3.37 0.06 | 1499 | |||||
| I | 4.21 0.01 | 4.18 0.01 | 0.56 0.01 | 3.53 0.08 | 1272 | |||||
| Hiltner652 | 2010-07-20 | 5770.2 18.3 | 6.46 0.01 | 1.2 0.03 | ||||||
| B | 5.94 0.04 | 5.94 0.04 | -0.08 0.04 | 179.32 0.11 | 691 | |||||
| V | 6.37 0.02 | 6.37 0.02 | -0.21 0.02 | 179.39 0.07 | 1083 | |||||
| R | 6.21 0.01 | 6.21 0.01 | -0.23 0.01 | 179.3 0.06 | 1106 | |||||
| I | 5.6 0.01 | 5.6 0.01 | -0.05 0.01 | 179.43 0.07 | 978 | |||||
| Hiltner652 | 2011-07-20 | 5807.4 31.3 | 6.48 0.02 | 1.24 0.05 | ||||||
| B | 5.95 0.06 | 5.95 0.06 | 0.03 0.05 | 179.85 0.16 | 477 | |||||
| V | 6.36 0.03 | 6.36 0.03 | -0.09 0.03 | 179.94 0.1 | 772 | |||||
| R | 6.24 0.01 | 6.24 0.01 | -0.12 0.01 | 179.81 0.08 | 797 | |||||
| I | 5.62 0.01 | 5.62 0.01 | 0.05 0.01 | 179.93 0.1 | 714 | |||||
| Hiltner652 | 2011-07-22 | 5816.4 26.7 | 6.51 0.01 | 1.15 0.04 | ||||||
| B | 5.97 0.05 | 5.97 0.05 | 0.04 0.05 | 0.09 0.13 | 529 | |||||
| V | 6.42 0.02 | 6.42 0.02 | -0.13 0.02 | 179.69 0.09 | 831 | |||||
| R | 6.29 0.01 | 6.29 0.01 | -0.13 0.01 | 179.84 0.07 | 839 | |||||
| I | 5.71 0.01 | 5.71 0.01 | 0.08 0.01 | 0.07 0.09 | 723 | |||||
| Hiltner652 | 2015-02-26 | 5788.8 30.8 | 6.49 0.02 | 1.16 0.05 | ||||||
| B | 5.96 0.06 | 5.96 0.06 | 0.02 0.06 | 179.94 0.16 | 436 | |||||
| V | 6.41 0.03 | 6.41 0.03 | -0.17 0.03 | 179.55 0.1 | 715 | |||||
| R | 6.24 0.01 | 6.23 0.01 | -0.2 0.01 | 179.49 0.08 | 740 | |||||
| I | 5.65 0.01 | 5.65 0.01 | -0.05 0.01 | 179.41 0.1 | 675 | |||||
| Hiltner652 | 2015-04-12 | 5795.0 23.8 | 6.46 0.01 | 1.15 0.04 | ||||||
| B | 5.95 0.05 | 5.95 0.05 | -0.11 0.05 | 179.18 0.14 | 516 | |||||
| V | 6.36 0.02 | 6.36 0.02 | -0.23 0.02 | 179.29 0.09 | 865 | |||||
| R | 6.22 0.01 | 6.21 0.01 | -0.26 0.01 | 179.21 0.07 | 900 | |||||
| I | 5.66 0.01 | 5.66 0.01 | -0.06 0.01 | 179.31 0.09 | 794 | |||||
| Hiltner652 | 2015-04-12 | 5759.0 24.8 | 6.51 0.01 | 1.16 0.04 | ||||||
| B | 6.01 0.06 | 6.0 0.06 | -0.09 0.06 | 179.39 0.17 | 569 | |||||
| V | 6.41 0.03 | 6.41 0.03 | -0.24 0.03 | 179.26 0.11 | 939 | |||||
| R | 6.26 0.01 | 6.26 0.01 | -0.22 0.01 | 179.38 0.09 | 968 | |||||
| I | 5.66 0.01 | 5.66 0.01 | -0.06 0.01 | 179.37 0.11 | 843 | |||||
| Hiltner652 | 2015-05-09 | 5763.9 32.9 | 6.4 0.02 | 1.2 0.05 | ||||||
| B | 5.88 0.05 | 5.88 0.05 | -0.07 0.05 | 179.46 0.15 | 479 | |||||
| V | 6.31 0.03 | 6.31 0.03 | -0.24 0.03 | 179.23 0.1 | 756 | |||||
| R | 6.15 0.01 | 6.15 0.01 | -0.26 0.01 | 179.21 0.08 | 773 | |||||
| I | 5.52 0.01 | 5.52 0.01 | -0.11 0.01 | 179.07 0.1 | 709 | |||||
| Hiltner652 | 2015-06-10 | 5726.7 25.8 | 6.42 0.01 | 1.16 0.04 | ||||||
| B | 5.94 0.04 | 5.94 0.04 | -0.11 0.04 | 179.26 0.12 | 600 | |||||
| V | 6.34 0.02 | 6.33 0.02 | -0.25 0.02 | 179.25 0.08 | 933 | |||||
| R | 6.17 0.01 | 6.16 0.01 | -0.27 0.01 | 179.05 0.07 | 949 | |||||
| I | 5.53 0.01 | 5.53 0.01 | -0.1 0.01 | 179.14 0.08 | 831 | |||||
| NGC2024 | 2010-12-31 | 6355.6 10.1 | 9.87 0.01 | 1.31 0.02 | ||||||
| B | 8.53 0.1 | 0.74 0.1 | -8.5 0.1 | 136.8 0.1 | 449 | |||||
| V | 9.55 0.03 | 0.25 0.03 | -9.54 0.03 | 136.33 0.05 | 1008 | |||||
| R | 9.67 0.01 | 0.09 0.01 | -9.67 0.01 | 136.19 0.03 | 1314 | |||||
| I | 9.02 0.0 | 0.49 0.0 | -9.0 0.0 | 136.18 0.02 | 1832 | |||||
| NGC2024 | 2011-12-30 | 6337.7 11.7 | 9.78 0.01 | 1.26 0.02 | ||||||
| B | 8.56 0.12 | 0.63 0.11 | -8.54 0.12 | 136.62 0.12 | 408 | |||||
| V | 9.46 0.03 | 0.13 0.03 | -9.46 0.03 | 136.0 0.05 | 927 | |||||
| R | 9.59 0.01 | -0.02 0.01 | -9.59 0.01 | 135.91 0.03 | 1214 | |||||
| I | 8.95 0.01 | 0.34 0.0 | -8.95 0.01 | 135.73 0.02 | 1692 | |||||
| NGC2024 | 2012-11-14 | 6308.6 12.4 | 9.95 0.01 | 1.26 0.02 | ||||||
| B | 8.7 0.12 | 0.74 0.11 | -8.67 0.12 | 137.0 0.11 | 408 | |||||
| V | 9.64 0.03 | 0.27 0.03 | -9.63 0.03 | 136.39 0.05 | 911 | |||||
| R | 9.75 0.01 | 0.18 0.01 | -9.75 0.01 | 136.47 0.03 | 1193 | |||||
| I | 9.08 0.01 | 0.56 0.01 | -9.06 0.01 | 136.4 0.02 | 1662 | |||||
| NGC2024 | 2015-05-11 | 6366.5 13.0 | 10.0 0.01 | 1.27 0.02 | ||||||
| B | 8.69 0.09 | 0.37 0.11 | -8.68 0.09 | 135.74 0.12 | 364 | |||||
| V | 9.64 0.03 | -0.04 0.04 | -9.64 0.03 | 135.31 0.06 | 735 | |||||
| R | 9.86 0.01 | -0.11 0.01 | -9.85 0.01 | 135.48 0.04 | 845 | |||||
| I | 9.19 0.01 | 0.3 0.01 | -9.18 0.01 | 135.59 0.04 | 1016 | |||||
| NGC2024 | 2015-09-25 | 6310.4 12.9 | 9.81 0.01 | 1.27 0.02 | ||||||
| B | 8.57 0.11 | 0.52 0.11 | -8.55 0.11 | 136.22 0.11 | 427 | |||||
| V | 9.51 0.03 | 0.04 0.03 | -9.51 0.03 | 135.68 0.05 | 944 | |||||
| R | 9.62 0.01 | -0.1 0.01 | -9.62 0.01 | 135.64 0.03 | 1230 | |||||
| I | 8.95 0.0 | 0.3 0.01 | -8.94 0.0 | 135.58 0.02 | 1703 | |||||
| NGC2024 | 2015-10-14 | 6363.9 14.9 | 9.81 0.01 | 1.3 0.02 | ||||||
| B | 8.47 0.15 | 0.41 0.16 | -8.46 0.15 | 135.91 0.15 | 306 | |||||
| V | 9.49 0.04 | -0.0 0.04 | -9.49 0.04 | 135.61 0.07 | 701 | |||||
| R | 9.62 0.01 | -0.14 0.01 | -9.62 0.01 | 135.53 0.04 | 927 | |||||
| I | 8.99 0.01 | 0.31 0.01 | -8.98 0.01 | 135.6 0.03 | 1327 | |||||
| NGC2024 | 2015-10-14 | 6339.6 13.7 | 9.81 0.01 | 1.25 0.02 | ||||||
| B | 8.58 0.21 | 0.57 0.21 | -8.56 0.21 | 136.29 0.2 | 309 | |||||
| V | 9.5 0.06 | 0.05 0.06 | -9.5 0.06 | 135.73 0.09 | 710 | |||||
| R | 9.62 0.01 | -0.09 0.01 | -9.62 0.01 | 135.7 0.05 | 943 | |||||
| I | 8.98 0.01 | 0.37 0.01 | -8.97 0.01 | 135.82 0.04 | 1358 | |||||
| BD-125133 | 2015-09-08 | 5049.5 35.5 | 4.37 0.01 | 1.17 0.04 | ||||||
| B | 4.22 0.03 | 1.69 0.03 | -3.86 0.03 | 146.54 0.12 | 845 | |||||
| V | 4.27 0.02 | 1.57 0.02 | -3.97 0.02 | 145.88 0.09 | 1252 | |||||
| R | 4.0 0.01 | 1.41 0.01 | -3.74 0.01 | 145.62 0.08 | 1213 | |||||
| I | 3.35 0.01 | 1.22 0.01 | -3.12 0.01 | 145.28 0.11 | 1049 | |||||
The polarization angle, , in individual bands is the average polarization angle from 3980-4920 (B band), 5070-5950 (V), 5890-5890 (R) and 7310-8810 (I). The signal-to-noise ratio, S/N, in individual bands is the average SNR between two 50 bins, from 4250-4350 (B), 5450-5550 (V), 6250-6350 (R) and 7650-7850 (I).