Photon Detection Efficiency Measurements of the VERITAS Cherenkov Telescope Photomultipliers after four Years of Operation
Abstract
The photon detection efficiency of two sets of R10560-100-20 superbialkali photomultiplier tubes from Hamamatsu were measured between 200 nm and 750 nm to quantify a possible degradation of the photocathode sensitivity after four years of operation in the cameras of the VERITAS Cherenkov telescopes. A sample of 20 photomultiplier tubes, which was removed from the telescopes was compared with a sample of 20 spare photomultiplier tubes, which had been kept in storage. It is found that the average photocathode sensitivity marginally increased below 300 nm and dropped by 10% to 30% above 500 nm. The average photocathode sensitivity folded with the Cherenkov spectrum emitted by particles in air showers, however, reveals a consistent detection yield of % and % for the sample removed from the telescope and the spare sample, respectively.
keywords:
Photomultiplier Tube, Superbialkali, Cherenkov Telescopes, Photondetector, Degradation1 Introduction
The Very Energetic Radiation Imaging Telescope Array System (VERITAS) [1] is an array of four Cherenkov telescopes that is used to observe astrophysical objects in gamma rays between 100 GeV and several 10 TeV. For an update of the latest results, see [1]. In the imaging atmospheric Cherenkov technique (IACT), pioneered by the Whipple Collaboration [2], large mirror surfaces collect the Cherenkov light that is emitted by the charged particles in an air shower, which can be initiated by a gamma ray or a charged cosmic ray in the atmosphere. The Cherenkov light is projected onto a camera, which images the air shower for an off-line analysis. In the analysis, based on the shape and intensity of the images, the type of the air-shower-initiating particle (gamma ray or charged cosmic ray), the energy, and the arrival direction are reconstructed [3].
The VERITAS reflectors are 12 m in diameter, and the camera of each telescope consists of 499 photomultiplier tubes (PMTs). VERITAS has been in operation with all four telescopes since Fall 2007. In summer 2012 the cameras were upgraded by replacing the Photonis XP2970 photomultiplier tubes with superbialkali R10560-100-20 photomultiplier tubes manufactured by Hamamatsu [4]. The main reason for the upgrade was the higher photon detection efficiency (PDE) of the R10560, which resulted in an increased light detection efficiency of the system and thus better-resolved images, directly impactacting the instrument performance. The angular resolution improved by 15%; the energy resolution and sensitivity both significantly improved, and the lower energy threshold decreased from 100 GeV to 80 GeV [5].
A good knowledge of the PDE is crucial in the event reconstruction because any offset in the detection yield of the Cherenkov light proportionally changes the energy scale of the reconstructed gamma rays. To ensure stable operation, the optical elements of the VERITAS telescopes are, therefore, regularly monitored in situ. This is done, for example, for the mirrors [6]. The efficiency of the light concentrators in combination with the photomultipliers is monitored with Cherenkov light from muons [7]. However, the Cherenkov spectrum from muons peaks at much lower wavelengths than the spectrum from air showers due to the lack of atmospheric scattering and absorption.111The Cherenkov light collected from muons originates closer to the detector. For a better test of the photon detection efficiency, it is necessary to remove the photomultiplier tubes from the telescope and measure them in the laboratory.
In order to check whether any degradation of the sensitivity of the photocathode has occurred after the Hamamatsu PMTs were installed in 2012, we performed wavelength-dependent PDE measurements between 200 nm and 750 nm on a subset of the 1,996 photomultiplier tubes currently installed. For that purpose 5 PMTs were temporarily removed from each of the four VERITAS cameras in summer 2016, and their PDEs were measured in the lab at Georgia Tech. The PMTs were reinstalled before the end of the summer. The results are compared to the PDEs of 20 spare PMTs, which were measured at the same time as the PMTs pulled from the telescopes. The spare PMTs come from the same production batches as the PMTs used in the telescopes and have been stored in a cool, dry, and dark location at the VERITAS site and never been used in a telescope.
2 The R10560 Photomultiplier Tube
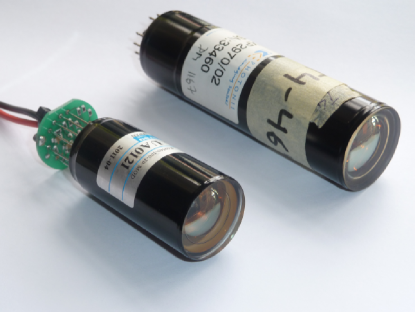
The R10560-100-20 MOD is shown in Figure 1 together with its predecessor used in VERITAS, the Photonis XP 2970. The R10560 is a one-inch PMT with a UV-transparent entrance window and a superbialkali photocathode with a peak efficiency of at 300 nm. The R10560 has a linear focused dynode structure with eight stages that is biased in a 4, 1, 1, 1, 1, 1, 1, 1, 1 configuration. The voltage divider consists of a passive divider chain between the cathode and dynode 5. Between dynode 6 and the anode, the bias is stabilized by an active divider circuit.
Aging of the photomultiplier tubes is a concern in Cherenkov telescope applications with respect to the PMT gain and photocathode sensitivity. VERITAS operates during nights with less than 70% moon illumination. Due primarily to stars, zodiacal light, and anthropogenic light sources, the R10560 typically detects an ambient background photon rate (also called night sky background) of to counts/second. With a multiplication gain of the PMTs of about 200,000, the anode current is typically a few microamperes. In bright moonlight conditions, the bias of the PMTs is reduced to keep the current below 10 A. After four years of operation, the last dynode of a PMT has thus typically collected a charge of 100 C. To compensate for the loss in gain due to the bombardment of the last dynodes with electrons, the PMT bias is continuously readjusted to keep the gain within 5% of its nominal value.
Aging of the photocathode can, for example, occur due to positively ionized residual gas molecules inside the PMT that are accelerated toward the photocathode and damage it upon impact. Another possibility is aging due to high ambient temperatures. During summer months the daytime temperatures at the VERITAS site are regularly above 40∘C and even higher inside the camera.
3 PDE Measurement Procedure
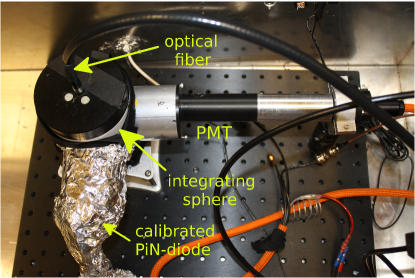
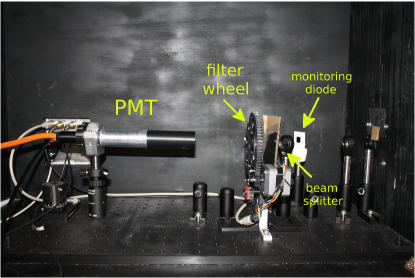
The PDE measurement procedure consists of three steps and is explained in detail in [8]. In the first step the PDE is measured at four different wavelengths (400 nm, 452 nm, 500 nm, and 589 nm). In the second step the relative spectral response is measured between 200 nm and 750 nm, which is the wavelength range where the efficiency of the PMTs is non zero. In the last step the relative spectral response is scaled to the four PDE measurements to arrive at an absolute PDE measurement between 200 nm and 750 nm. Figure 2 shows a picture of a PMT mounted in the PDE setup, and Figure 3 shows a picture of a PMT in the spectral response setup.
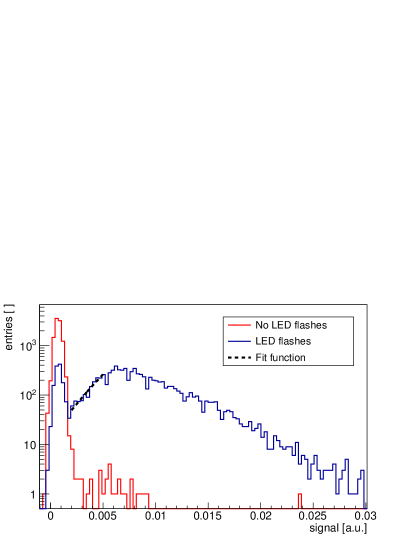
The only difference with respect to the procedure as described in [8] is how the number of detected photoelectrons is extracted from the PMT data. The setup was originally devised to measure the PDE of silicon photomultipliers, which exhibit an excellent separation of single photoelectron signals from noise. In PMTs the single photoelectron signals partially overlap with noise because of the statistical nature of the multiplication process in the dynode structure of the PMT. Figure 4 shows an example of the pulse height distribution recorded with and without illumination by a flashing light source in the PDE setup. While for SiPMs it is sufficient to define a signal level above which all signals can be considered to be from detected photons and below which from noise, the same approach applied to PMT signals would result in considerable systematic uncertainties.
In order to alleviate the problem, we fit the portion of the single photoelectron distribution between the pedestal and the peak of the single photoelectron distribution with a Gaussian (dashed line in Figure 4) and extrapolate the fit into the pedestal. We then subtract the extrapolation from the pedestal distribution, which enables us to extract the number of flashes during which the PMT did not detect a photon. The number of non-detections is then used to calculate the average number of photoelectrons detected during a flash as described by Equation 2 in [8].
The PMTs are biased at 1200 V in the PDE measurements, which is higher than the typical operating bias of most tubes (600 V - 1300 V), to produce a better separation between noise and single photoelectron signals. The PDE does not change when the bias is increased even higher to 1400 V.
The overlap between the pedestal distribution and the single photoelectron distribution, however, remains a major source for systematic uncertainties because the precise shape of the single photoelectron distribution is unknown. We estimate that the total systematic uncertainty of the PDE measurement is 6% based on the uncertainties quoted in [8] and a 5% uncertainty on the previously described method to extract the number of photoelectrons from the pulse height distribution.
In the PDE measurement a random, 1 mm diameter spot approximately in the center of the photocathode is illuminated. In the relative spectral response measurement, the light beam illuminates an area of the photocathode with a diameter of about 10 mm.
4 Results
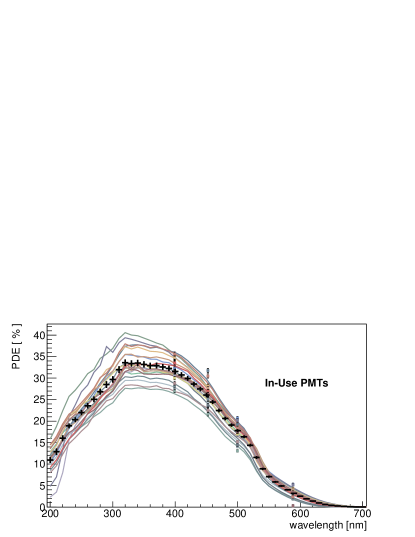
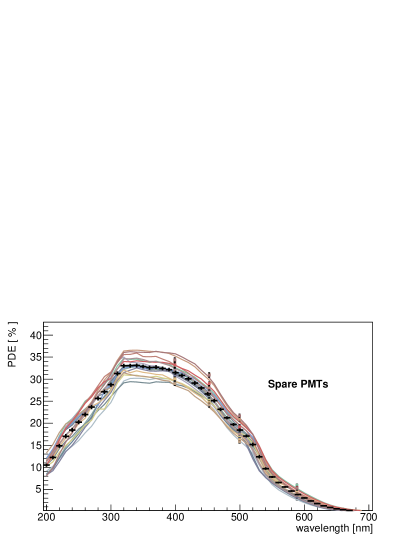
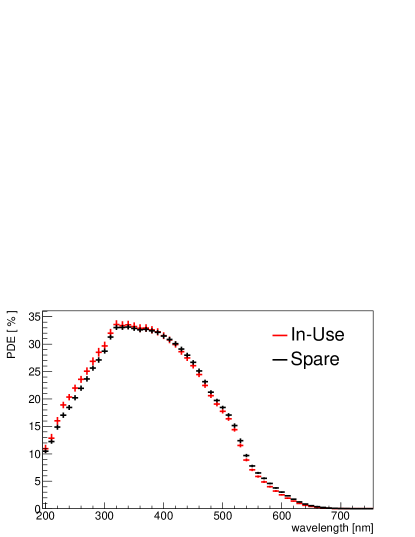
Figures 5a and 5b show the absolute PDE of the two sets of PMTs between 200 nm and 750 nm in steps of 10 nm. Depicted by the thicker data points at 400 nm, 452 nm, 500 nm, and 589 nm are the PDE measurements to which the relative spectral response has been scaled. The black data points are the average values of all twenty PMTs. The vertical error bars show the error on the mean values, and the horizontal error bars represent the 10 nm steps. Figure 6 shows the two average PDE curves. It is evident from these figures that a mismatch exists between the two average curves, and that the scatter in the PDE curves is larger for the PMTs removed from the VERITAS telescopes (hereafter in-use PMTs) than for the spare PMTs.
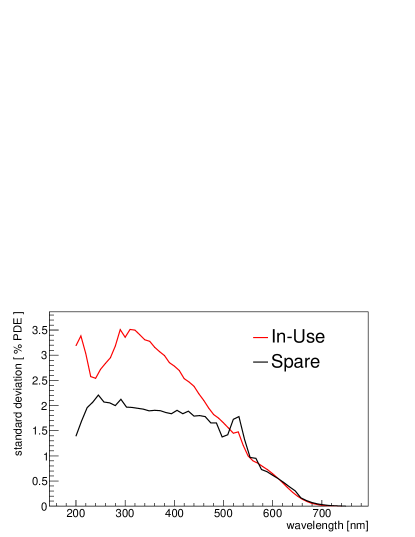
The scatter of the PDE curves is quantified by calculating the root mean square (RMS) of the PDE values for each set in steps of 10 nm. The results are shown in Figure 7. Above 500 nm both sets of PMTs display approximately the same RMS. Below 500 nm, however, the RMS of the in-use PMTs is consistently above that of the spare PMTs and peaks at 300 nm with a 50% higher RMS than the RMS for the spare PMTs. The higher RMS does not impact VERITAS operations because the 3% PDE RMS at 300 nm corresponds to only 10% of the peak PDE at 300 nm.
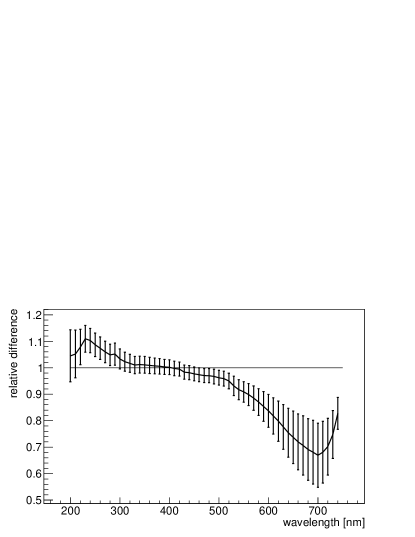
The difference in the average PDE values between the two samples is quantified by calculating the residual values of the average PDE of the in-use PMTs relative to the average PDE of the spare PMTs; see Figure 8. While there is evidence of an increase in the PDE below 300 nm, the PDE of the in-use PMTs is lower than the PDE of the spare PMTs above 500 nm. The difference reaches its maximum at 700 nm where the in-use PMTs show on average a 30% lower efficiency. It should be noted that the absolute PDE drops below 7% at 550 nm and is below 2% at 600 nm and above. Thus, even a relative 30% drop does not significantly affect VERITAS operation as we will discuss next.
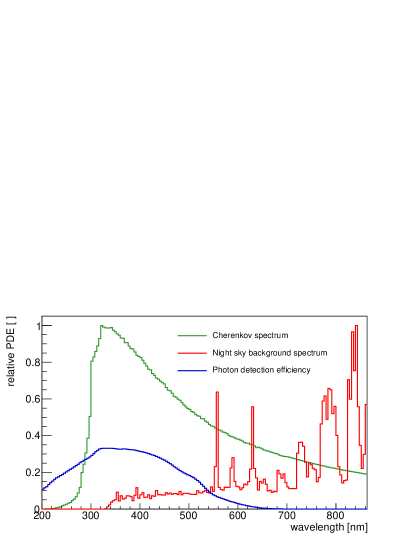
The PMTs detect Cherenkov light from air showers. The Cherenkov intensity is proportional to where is the photon wavelength. Below 340 nm the Cherenkov emission is scattered and absorbed in the atmosphere. Figure 9 shows a simulated Cherenkov spectrum in the focal plane of a VERITAS camera. The full width at half maximum of the spectrum spans the range from 300 nm to 520 nm, which is about the wavelength range over which a photon detector should be sensitive to yield maximal detection efficiency for the Cherenkov light. Above 550 nm the intensity of the night sky background becomes dominant, and it is therefore desirable that the sensitivity of the photon detector drops to zero. Figure 9 shows a measured spectrum of the night sky background [9]. Also shown in the figure is the average PDE of the in-use PMTs measured in this campaign.
The detection yield of Cherenkov light is the figure of merit that can be used to judge if the measured changes in the PMT sensitivity have a significant impact on VERITAS operation. To find out, we multiplied the simulated Cherenkov spectrum in Figure 9 by the average PDE and integrated the product from 200 nm to 750 nm. Normalizing to the integral of the Cherenkov spectrum over the same wavelength range gives the fraction of the light detected by the PMTs. We obtain % for the yield of the in-use PMTs and % for the yield of the spare PMTs. Thus both sets have the same detection yield to air-shower Cherenkov light.
5 Discussion
We evaluated two sets of Hamamatsu R10560 PMTs for the purpose of investigating a possible degradation of the photocathode sensitivity after four years of operation in the VERITAS Cherenkov telescopes. The previously used PMTs, the Photonis XP2970, showed aging of the spectral sensitivity, and it was not clear if a similar effect would be seen in the new PMTs. Some Photonis PMTs even showed a complete loss of their sensitivity. A degradation of the UV sensitivity was also observed in the Hamamatsu R 1398 PMTs that were used by the Whipple Collaboration [10, 11].
For the measurements one set of 20 PMTs was temporarily removed from the VERITAS telescopes and reinstalled after the measurements had been completed. The second batch of 20 PMTs consists of unused spare PMTs, which have never been installed in the telescopes.
In this study, we have found that the spectral sensitivity of the PMTs significantly degraded above 500 nm, and that there is evidence of a slight improvement of the sensitivity below 300 nm. However, both changes do not affect the detection yield of Cherenkov light, which we have shown by calculating the yield for the two sets of PMTs.
In conclusion, the Hamamatsu R10560-100-20 superbialkali PMT did not degrade in performance after four years of operation during which each PMT anode accumulated an estimated charge of approximately 100 C [4] and experienced extreme temperature variations with peak temperatures of more than 40∘C.
Acknowledgments
We are grateful for the work done by the staff at the VERITAS site to send us PMTs for testing. Her research was funded with grants from the Center on Materials and Devices for Information Technology Research (CMDITR), the NSF Science and Technology Center No. DMR 0120967, and the National Science Foundation under grant no. PHYS-1505228. E. G. would like to thank her advisor N. O. and all of the REU organizers at Georgia Tech for their knowledge and support received during this summer project.
References
References
-
[1]
J. Holder, f. t. V. Collaboration,
Latest Results from VERITAS: Gamma
2016arXiv:1609.02881.
URL http://arxiv.org/abs/1609.02881 -
[2]
T. C. Weekes, M. F. Cawley, D. J. Fegan, K. G. Gibbs, A. M. Hillas, P. W. Kowk,
R. C. Lamb, D. A. Lewis, D. Macomb, N. A. Porter, P. T. Reynolds, G. Vacanti,
Observation of TeV gamma
rays from the Crab nebula using the atmospheric Cerenkov imaging technique,
The Astrophysical Journal 342 (1989) 379.
doi:10.1086/167599.
URL http://adsabs.harvard.edu/doi/10.1086/167599 - [3] A. M. Hillas, A. M., Cerenkov light images of EAS produced by primary gamma, In NASA. Goddard Space Flight Center 19th Intern. Cosmic Ray Conf., Vol. 3 p 445-448 (SEE N85-34862 23-93) 3.
-
[4]
A. N. Otte, The Upgrade of VERITAS with
High Efficiency Photomultipliers, in: Proceedings of the 32nd ICRC, 2011.
URL http://arxiv.org/abs/1110.4702 - [5] J. F. Rajotte, Upgrade and performance of the VERITAS telescope array, Nuclear Instruments and Methods in Physics Research, Section A: Accelerators, Spectrometers, Detectors and Associated Equipment 766 (2014) 61–64.
-
[6]
S. Archambault, D. Hanna, S. Griffin,
In-situ measurements of whole-dish
reflectivity for VERITASarXiv:1307.8358.
URL http://arxiv.org/abs/1307.8358 - [7] G. Vacanti, P. Fleury, Y. Jiang, E. Paré, A. Rovero, X. Sarazin, M. Urban, T. Weekes, Muon ring images with an atmospheric Čerenkov telescope, Astroparticle Physics 2 (1) (1994) 1–11. doi:10.1016/0927-6505(94)90012-4.
-
[8]
A. N. Otte, D. Garcia, T. Nguyen, D. Purushotham,
Characterization of Three High
Efficiency and Blue Sensitive Silicon PhotomultipliersarXiv:1606.05186.
URL http://arxiv.org/abs/1606.05186 -
[9]
C. R. C. Benn, S. L. S. Ellison,
La
Palma night-sky brightness, arXiv preprint astro-ph/9909153 (February 2008)
(1999) 1–26.
arXiv:9909153, doi:10.1016/S1387-6473(98)00062-1.
URL http://www.astro.uni-wuerzburg.de/wikineu/images/6/67/LaPalmaNightSkyBrightness.pdf$\$nhttp://arxiv.org/abs/astro-ph/9909153 - [10] M. Daniel, Private Communication (2016).
- [11] J. Kildea, R. W. Atkins, H. M. Badran, G. Blaylock, I. H. Bond, S. M. Bradbury, J. H. Buckley, D. A. Carter-Lewis, O. Celik, Y. C. K. Chow, W. Cui, P. Cogan, M. K. Daniel, I. de la Calle Perez, C. Dowdall, C. Duke, A. D. Falcone, D. J. Fegan, S. J. Fegan, J. P. Finley, L. F. Fortson, D. Gall, G. H. Gillanders, J. Grube, K. J. Gutierrez, J. Hall, T. A. Hall, J. Holder, D. Horan, S. B. Hughes, M. Jordan, I. Jung, G. E. Kenny, M. Kertzman, J. Knapp, A. Konopelko, K. Kosack, H. Krawczynski, F. Krennrich, M. J. Lang, S. LeBohec, J. Lloyd-Evans, J. Millis, P. Moriarty, T. Nagai, P. A. Ogden, R. A. Ong, J. S. Perkins, D. Petry, F. Pizlo, M. Pohl, J. Quinn, M. Quinn, P. F. Rebillot, H. J. Rose, M. Schroedter, G. H. Sembroski, A. W. Smith, A. Syson, J. A. Toner, L. Valcarcel, V. V. Vassiliev, S. P. Wakely, T. C. Weekes, R. J. White, The Whipple Observatory 10 m gamma-ray telescope, 1997 2006, Astroparticle Physics 28 (2007) 182–195. doi:10.1016/j.astropartphys.2007.05.004.