[table]capposition=top \setcopyrightacmcopyright \isbn000-0000-00-000/00/00 \acmPrice$00.00
Attribution of Responsibility and Blame Regarding a Man-made Disaster: #FlintWaterCrisis
Abstract
Attribution of responsibility and blame are important topics in political science especially as individuals tend to think of political issues in terms of questions of responsibility, and as blame carries far more weight in voting behavior than that of credit. However, surprisingly, there is a paucity of studies on the attribution of responsibility and blame in the field of disaster research.
The Flint water crisis is a story of government failure at all levels. By studying microblog posts about it, we understand how citizens assign responsibility and blame regarding such a man-made disaster online. We form hypotheses based on social scientific theories in disaster research and then operationalize them on unobtrusive, observational social media data. In particular, we investigate the following phenomena: the source for blame; the partisan predisposition; the concerned geographies; and the contagion of complaining.
This paper adds to the sociology of disasters research by exploiting a new, rarely used data source (the social web), and by employing new computational methods (such as sentiment analysis and retrospective cohort study design) on this new form of data. In this regard, this work should be seen as the first step toward drawing more challenging inferences on the sociology of disasters from “big social data”.
doi:
00.000/000_01 Introduction
In the last decade of disaster research, there has been a proliferation of studies exploiting information and communication technologies (ICT) and computational methods for advancing emergency response. These same means can be used to address social scientific inquiries of disaster research. In this regard, instead of trying to solve a software engineering or a disaster management problem, here we study the sociology of disasters from a computational social science perspective. By examining microblog posts on the Flint water crisis we try to understand how citizens respond to a man-made disaster and to a governmental failure online. In particular we are interested in responses regarding attribution of blame and responsibility, which usually takes place in the recovery phase of disasters. To study it, we first construct theoretical hypotheses on top of existing social theories, and then operationalize them on unobtrusive, observational social media data via computational methods.
Attribution of responsibility is a key issue in political decision making as blame carries far more weight in voting behavior than that of credit [19]. Moreover, “individuals tend to simplify political issues by reducing them to questions of responsibility and their issue opinions flow from their answers to these questions” [13]. Besides, attributions formed during states of national emergencies are of particular importance, especially because these attributions become shared memories of the entire nation and are long used as concrete examples of severity of consequences of wrong policy decisions. Although about thirty years ago Neal found it surprising that the process of blame was a neglected topic in disaster research [22], tracing over the citations that his paper has received to date and still not seeing any article particularly discussing blame, made us even more worrisome. In this paper, we contribute to this neglected field by testing theories of attribution of blame and responsibility on the Flint water crisis using new forms of data (the social web) and methods. In particular, we add to the disaster research by addressing the issues of: i) sources for blame regarding a disaster, ii) partisan predispositions in the blaming behavior, iii) geographies that shows interest in the crisis the most, and iv) the contagion of complaining (homophily, peer or network effect, and selective exposure).
In the next section we first provide some background information about the Flint water crisis. Following it, we lay out our hypotheses along with the theories behind them. After that we describe the data and discuss how we operationalize our hypotheses. In the fifth section, we report and assess our results. Finally, we conclude our paper.
2 Background
On Saturday, January 16, 2016, President Obama declared a federal state of emergency for an area in Michigan affected by contaminated water and authorized the Department of Homeland Security, Federal Emergency Management Agency (FEMA) to “coordinate all disaster relief efforts” [25]. When he later visited Flint, the most adversely affected city in Genesee County, he described the water crisis as “a man-made disaster” that was “avoidable” and “preventable” [29], while not naming who in particular were responsible.
For decades, Flint, MI used Detroit’s treated sources for tap water. However, Detroit’s double digit price increases every year has eventually made it the most expensive option [26], and on March 25, 2014 Flint city council approved buying water from Karegnondi Water Authority (KWA) when it becomes active. Upon this decision the “water war” started according to Detroit Water and Sewerage Department (DWSD), and DSDW gave a notice that it would terminate its contract with Flint in one year [5, 10]. Flint had to find a temporary primary water source until KWA becomes effective, and by late April 2014, they decided to switch to Flint River temporarily. Reportedly the complaints about the tap water started right after this change [9].
According to Flint Water Advisory Task Force (FWATF) [9], the following seven entities are responsible for the Flint water crisis at various levels: Michigan Department of Environmental Quality (MDEQ), Michigan Department of Health and Human Services (MDHHS), Michigan Governor’s Office, State-appointed emergency managers (EMs), Genesee County Health Department’s (GCHD), and U.S. Environmental Protection Agency (EPA).
3 Hypotheses
In “An Inventory of Sociological Findings”, Drabek [6] discusses “blame assignation processes” at the community-level in the disaster reconstruction phase of his typology, in which he lists hypotheses on three topics: (i) when blame occurs, (ii) purposes of blaming and how they work out, and (iii) who those blamers are. Here, we build our hypotheses on top of this existing sociology of disasters research. Drabek also notes the scarcity of studies on blame assignment behavior in disaster research, by forming and testing hypotheses we hope our research helps reduce this gap of knowledge in the field.
Source for Blame. “Animated by a desire for prevention of future occurrences”, blame occurs especially when (i) conventional explanations failed, (ii) when the responsible agents are perceived to be unwilling to take action to remedy the situation, and (iii) when they violate moral standards [4]. All of the conditions are present in the case of Flint water crisis; (i) there is no conventional explanation for this man-made disaster, (ii) almost all of the agents of responsibility were reluctant to respond in time, and (iii) the public was deprived of a basic human right, the right to safe water. Yet, per condition (ii), every primarily responsible officer in the state “somehow payed the price” by leaving their posts, but Governor Snyder111They either resigned (e.g. EPA officials and emergency managers), were fired (e.g. the head of MDEQ’s drinking water unit), or their effective terms ended (e.g. the mayor). [9]. Moreover, both Democratic presidential candidates demanded the governor to resign. Therefore, our first hypothesis goes:
H1. The amount of blame directed toward Governor Snyder exceeds any other agent.
Partisan Predisposition. Blaming an entire party or an ideology upon a particular crisis predisposes him against that party. In disasters, sometimes blame is not seen as “a function of the immediate crisis, but that reflect pre-existing conflicts and hostilities”, and when biased or irrational factors play a role in the process of blaming, it is called “scapegoating” [31] (cited in [6]). One can relate this to the social identity theory, which suggests that if someone is guilty then (s)he must be among the out-group [30]. Theories on partisan bias project this socio-psychological bias onto the political plane, suggesting that partisanship has an important influence on attitudes toward political elements [2]. So we expect people blaming a particular party or ideology to express more negative sentiments toward representatives of that party. In our case, some of these representatives are Democrat while others are Republican222The city council is made up of Democrats, the state of Michigan is ruled by a Republican governor, the Congress is controlled by Republicans, and the President is a Democrat., and for some, Flint poisoning is primarily a partisan issue (e.g. [15]). Hence, our second hypothesis is:
H2a. Individuals who assign responsibility to the Republican party or ideology show greater negative feeling toward the Governor (R) than those who blame Democratic party or ideology.
H2b. Individuals who assign responsibility to the Republican party or ideology express less negative sentiment toward the Mayor (D) than those who blame Democratic party or ideology.
Concerned Geographies. Tobler’s first law of geography says “everything is related to everything else, but near things are more related than distant things” [34]. In the case of Flint water crisis, this also relates to environmental vulnerability, suggesting that individuals who are at greater risk are more likely to express their concerns. Flint residents are under the highest threat, followed by the Genesee residents, followed by Michiganders. Therefore we expect:
H3. Expression of concern per capita is to be the highest for the city of Flint, followed by other cities in the Genesee county, followed by other cities and counties in Michigan.
Contagion of Complaining. Twitter is not only used as a social network but also as a news media [17]. In the former case, individuals befriend with similar others (homophily) and influence each other [21]. When Twitter serves as a news media, we expect ideological similarity between the user and who he follows as selective exposure suggests [28]. Besides, one who hears a complaint is more likely to start complaining (positive feedback), and Kowalski offers three explanations for this in times of disasters [14]. Accordingly:
H4. Individuals who express negative emotions on the Flint water crisis have friends more negative than that of individuals who talk more positively about the crisis.
4 Data and Methodology
One of the major advantages of social media research is that we are not bounded with a specific space and time for data collection. This helped us overcome a major limitation in disaster research, unobservability, as Wallace puts it [35]: “An anthropologist can watch or participate in a religious ritual; a sociologist can attend a union meeting; the psychiatrist can see his patient a few hours or minutes after a family quarrel. But disasters, generally speaking, are so unpredictable as to place and time, that it is unlikely that any given team of trained observers will be in an impact area, before and during an impact of the appropriate type”. Palen et al. [24] also emphasize the advantages of crisis informatics in quick response research. On the other hand, availability of big data may also obscure the most relevant piece of information needed for an accurate conclusion [32]. To this extent, in order to have most possible amount of data, we do not restrict ourselves to tweets with geocoded information or that contain a particular hashtag only. Furthermore, to not include irrelevant postings, we filter the Twitter stream by keywords Flint and #FlintWaterCrisis.
We used TweetTracker [16] as our data collection tool, and the data collected starts on the day before the President declared a state of emergency for Flint. From Jan. 15 to Jun. 29, 2016 (163 days333Data for the following days are missing due to collection issues: 01:23,24; 02:14,17-19; 04:28-30; 05:1-3,7,13-25), we obtained 664,775 tweets by 281,535 unique users. Fig. 1 illustrates the activity on Twitter by highlighting some of the major events that draw public’s attention444Since there is no major political event taking place after the President’s visit on May 4th, we truncate the figure for the sake of better visualization. It appears that the public interest in the Flint water crisis has been limited, and peaked at times of major political events. In this regard, the only day we hit the 50,000 daily tweet collection limit of TweetTracker was the day of the Democratic presidential debate that was held in Flint on March 6. We calculated sentiments of the tweets in our dataset using NLTK implementation of VADER because it is particularly designed for sentiment analysis for social media text555VADER’s sentiment lexicon includes emoticons, common slang words, and accounts for punctuation and capitalization. [3, 12]. In the rest of this section, we discuss how we operationalize the theoretical hypotheses put forward in Sec. 3.
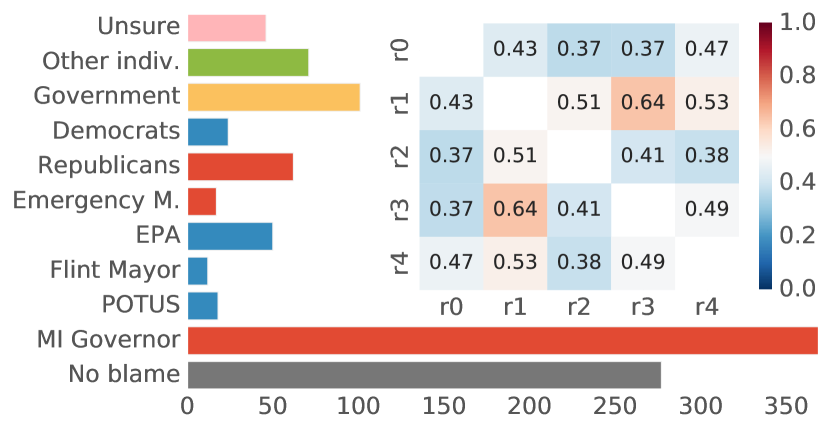
Source for Blame. Our first hypothesis questions whether most of the blames are directed towards Governor Snyder. To learn if a tweet, or a phrase in a tweet, attributes blame or responsibility to any specific person or a group, we employed manual curation. First, based on the roles of government entities in the Flint water crisis listed in Sec. 2 and from our preliminary observation of our dataset we came up with eight candidates that are likely to be blamed. Then, we randomly selected five chunks of 200 tweets from our original dataset and asked voluntary coders666Three of the coders (Lawrence Wang, Varun Talwar, and Elizabeth Hu) are 2016 Summer interns in the Department of Computational and Data Sciences at George Mason University, and the other two (Feyza Galip and Kevser Polater) are graduate students elsewhere. to label every tweet in a chunk with at least one of these predefined labels (candidates). If there is no blame attributed to any specific person or a group in a tweet, then it is labeled no blame. If a person or group is blamed but happens not to be in the candidates list, then those tweets are labeled as other. Multiple labeling was allowed in case a tweet assigns blame to several persons or groups. Curators were instructed not to label a tweet if they are unsure of the person blamed, and to indicate so. Distribution of these eleven cases is captured in Fig. 2. To measure inter-rater reliability, each of the samples is created with approximately 10% overlap with any other sample .777Therefore, instead of 1000 tweets we ended up with 892 unique tweets labeled in total. Then, to operationalize our first hypothesis we simply evaluate the number of tweets coded per category by the curators, for which we calculate a Fleiss’ kappa statistic for every possible coder pair. As visualized in the heatmap in Fig. 2, most of the rater pairs are in the 0.41–0.60 kappa range, which is interpreted as moderate agreement888That is, pairs calculated. A perfect agreement would equate to a kappa of 1, and a chance agreement would equate to 0. [18].
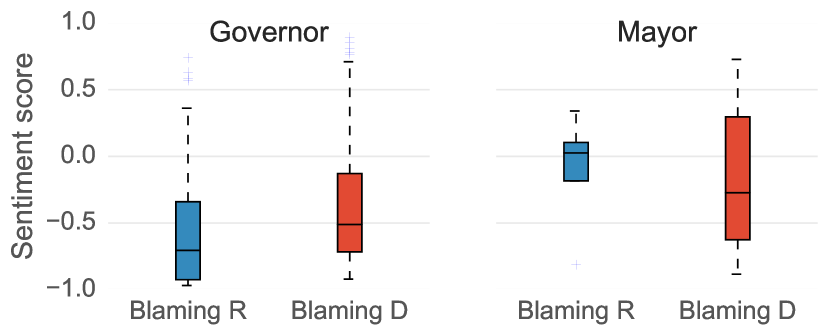
Partisan Predisposition. Our second hypothesis is about the relationship between explicitly blamed parties or ideologies and the sentiments expressed toward their representatives at administrative positions. We expect users who blame the Republican (Democratic) party or ideology to have a more negative sentiment towards the Republican governor (Democratic mayor) than those who blame the Democratic (Republican) party or ideology. In our manually coded tweets sample (Fig. 2) two of the labels indicate tweets explicitly blaming parties or ideologies. A total of 62 (24) of the 892 labeled tweets found to be blaming Republicans (Democrats) for the crisis. After identifying these tweets, we look for the individuals (Twitter accounts) who (re)tweeted at least one of those tweets. In total, 165 such users are identified in our main dataset, 136 of which blamed the Republicans, and 29 blamed the Democrats.
We used keyword filtering to identify the tweets mentioning the governor of Michigan (G), the mayor of Flint (M), and the emergency managers (EM)999Tweets labeled for G (97577), M (11609) and E (6028) using keyword sets “governor, Snyder, onethoughnerd”, “mayor, Dayne, Walling”, and “mgr, manager, Kurtz, Earley, Darnell”, respectively., and then selected tweets exclusively mentioning the mayor or the governor as such: Let represent the set of tweets that has only mayor-related tweets. Similarly, gives the exclusively governor-related tweets. Within each of those sets, we looked at the sentiments of individuals blaming Republicans (R) and Democrats (D) separately. To measure statistical difference between those who blame R and D in their sentiments expressed toward G and M, we performed Kolmogorov-Smirnov test, which is a non-parametric test that does not rely on any probability distribution.
Concerned Geographies. Rather than working with geocoded tweets, which are rarely available for our collection, we make use of the location field in Twitter user profiles, from which we managed to get geographic coordinates using regular expressions. Then to measure cities’ level of interest in the Flint water crisis, we normalize total number of tweets originated at each city by its population. For counties, we normalize total tweet counts originated from cities in a county with the square root of sum of city populations. We do square root transformation to account for larger standard deviations at county level101010This is due to our normalization factor. In normalizing Flint-related tweets per county, instead of using true population of counties we simply use sum of population of cities from which at least three tweets originated and available in our dataset..
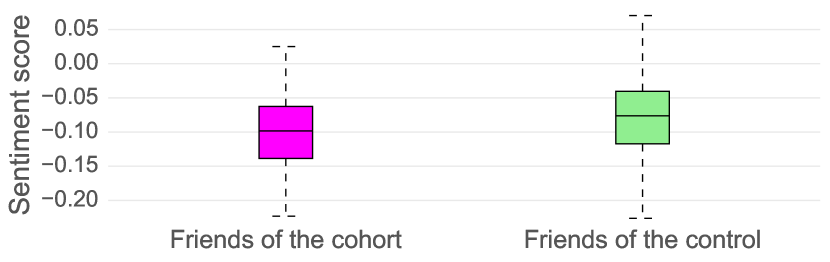
Contagion of Complaining. Some Flinters have posted positive messages about the crisis (cohort), while most others have expressed negative sentiments (control). We expect friends of a user in any of these two groups reflect sentiments similar to the user. To test this hypothesis, we designed a retrospective cohort study in which we compared the sentiments of the friends of the cohort group on the Flint water crisis to that of the control group. To rule out the geographic effect, we form both of the groups only by Flinters, the Flinters that have at least three but no more than 20 tweets in our dataset.111111Location field in the Twitter user profile is used to detect the Flinters. We found 223 such Flinters in our dataset (115 of who had a negative and 101 of who had a positive sentiment on average on the Flint water crisis)121212Following Twitter’s convention, we use the term friends to refer to the users who someone follows. These Flinters in total follow 122,953 unique accounts, and 8,339 of those happen to be in our dataset.. We then performed two-sample Kolmogorov-Smirnov statistical test that rejects the null hypothesis if the two samples (the average sentiments of the friends of each group) were drawn from the same distribution.
5 Results
Source for Blame. As shown in Fig. 2, the Governor of Michigan is blamed 3.5 times more than the second most blamed agent. Our first hypothesis expected him to be the most blamed, and thus it is proved to be true.
Partisan Predisposition. We asked if those who blame the Democratic party or ideology (D) is any different from those who blame the Republican party or ideology (R) in their sentimental expressions toward the governor, and the mayor131313When we examined the expressions toward the mayor and the governor without separating the parties blamed, we found out that average sentiment scores are negative for both officials, though at different levels (-0.12, -0.31). . Fig. 3 shows that individuals blaming R have more negative sentiment toward the governor than those individuals who blame D. The null hypothesis that the two samples (blaming R and blaming D) are from the same distribution is rejected for the governor by the two-sample Kolmogorov-Smirnov test (for , , p- = ). Similarly, Fig. 3 shows that individuals blaming R have less negative sentiment toward the mayor than those individuals who blame D. However, due to small sample size, we cannot statistically claim any effect of partisan predisposition on the sentiments expressed about the mayor. Thus, our statistical tests support H2a but not H2b.
Concerned Geographies. We expected that the cities expressed interest in the Flint water crisis the most to be from the county of Genesee and from the state of Michigan. Four of the ten most concerned cities happen to be from the county of Genesee, and six of the ten counties are from Michigan (Tbl. 1)141414The asterisk in Tbl. 1 denotes that the city is in the county of Genesee..
| Cities | Counties | |
|---|---|---|
| 1 | Flint, MI* | Genesee, MI |
| 2 | Gaylord, MI | Dist Columbia, DC |
| 3 | Grand Blanc, MI* | Otsego, MI |
| 4 | Mount Morris, MI* | Wayne, MI |
| 5 | Bloomfield Hills, MI | Ingham, MI |
| 6 | Lansing, MI | Washtenaw, MI |
| 7 | Sedona, AZ | Multiple, GA |
| 8 | Davison, MI* | Kent, MI |
| 9 | Traverse City, MI | Coconino, AZ |
| 10 | Ann Arbor, MI | Cook, IL |
Contagion of Complaining. The friends of the Flinters who expressed negative sentiments on the Flint water crisis (cohort’s friends) are expected to be more negative than the friends of those Flinters who talk positively (control’s friends). Fig. 4 illustrates that the mean sentiments of the tweets of the cohort’s friends are more negative than that of control’s friends. Furthermore, the Kolmogorov-Smirnov test statistically shows that the distributions of the sentiment scores of tweets of the two groups’ friends are significantly different from each other with 95% confidence level (p- = ). This discrepancy supports our hypothesis.
6 Related Work
Complaint is defined as “an expression of dissatisfaction for the purpose of drawing attention to a perceived misconduct by an organization and for achieving personal or collective goals” [7]. These goals could be personal like “anxiety reduction, vengeance, advice seeking, self-enhancement” or they could be collective such as “helping others and the organization”. While Einwiller and Stein [7] study how large companies (“the blamed”) handle complaints on their social media pages, in this study we are interested in the ways citizens (“the blamers”) raise their voice against the agents in the government as a response to the violation of a basic human right, access to clean city water. Rather than studying marketing or public relations aspects of the blame process, here we are interested in the other side of the coin, how the sociology of disasters work in this process.
By studying different kinds of crises, Oltenau et al. [23] categorize information types shared on social media during these events. Following their topology, Flint water crisis is an instantaneous human-induced accidental hazard diffused over a county. It is a man-made disaster that might have started as an accident but evolved into “a story of government failure, intransigence, unpreparedness, delay, inaction, and environmental injustice” [9]; and it is an instantaneous crisis because no notices were given before it happened. Reviewing the earlier work in the literature, [23] identify six broad categories for information communicated over Twitter during disasters. These information categories are i) affected individuals, ii) infrastructure and utilities, iii) donations and volunteers, iv) caution and advice, v) sympathy and emotional support, and vi) other useful information. Oltenau et al. do not consider attribution of responsibility and blame as a distinct category; “updates about the investigation and suspects” is the most related phenomenon mentioned, which is addressed in the “other useful information” category (expressed vis-à-vis shooting and bombing events).
Lin and Margolin [20] and Wen and Lin [36] examine community-level and individual-level expressions right after terrorist attacks respectively. Both of the studies employed dictionary based tools (SentiSense [1] and LIWC [33]) to measure the emotions in the tweets. Lin and Margolin find that the extent to which residents of a city visit the directly affected-city (Boston in their case) has the most predictive power for the level of fear, solidarity and sympathy expression in that city. Similarly, analysis of Wen and Lin shows that “a greater level of anxiety was associated with locations closer to the attack site”. One of the major differences of our research is the phase of disaster we are studying. Instead of studying emotions right after a terrorist attack (i.e. during the response phase), our study focuses on political responsibility attribution later in the recovery phase.
Regarding the methodology, Lin and Margolin [20] make use of two hashtags (#prayforboston and #bostonstrong) as proxies for “empathic concern” and “solidarity”, to measure social support. They also adapt keyword matching methods to detect fear and joy in the tweets, two of the fourteen sentiments defined in the SentiSense lexicon [1]. Similarly, Wen and Lin [36] measure anxiety, sadness, and anger using LIWC lexicon in French [33]. Here, we measure sentiments of tweets using Vader sentiment analysis tool [12].
Although altruistic behaviors are common in times of disasters [11], in the recovery phase, when the community is pressed by difficult living conditions and when there is a lack of short-term improvement, public increase their criticism of administrators, and attribute blame to whom they perceive as the agents of responsibility. Among other psychological and social reasons discussed in Sec. 3, a political explanation for this act is that in democracies the public acts as a watchdog and actively participates in discussions to control and influence the decision makers. To this end, use of Twitter hashtags in citizen protests has already become a common apparatus the public leverages to grab attention to their concerns [8]. This online activism, sometimes called slacktivism, is defined as “as low-risk, low-cost activity via social media, whose purpose is to raise awareness, produce change, or grant satisfaction to the person engaged in the activity” [27]. In this study, we are not interested in how social media are used in physical protests or how social support is expressed online, rather, we examine theories of attribution of responsibility and blame in the recovery phase of a crisis using observational data from social media.
7 Conclusion
In this study, building on the existing research in sociology of disasters, we first form several theoretical hypotheses on attribution of responsibility and blame. Then we operationalize these hypotheses on unobtrusive, observational social media data via computational methods. The findings support all of our hypotheses. However we should note that we did not form our hypotheses upon conflicting views on the topics in the first place, and they do not challenge the findings in the literature. The nature of our hypotheses also does not require complex or multivariate analysis. Yet, as acknowledged by the researchers in the field, there is a paucity of studies on the attribution of responsibility and blame in disaster research and a need for empirical support. This paper adds to the few number of studies on this topic. It contributes to the sociology of disasters research also by exploiting a new, rarely used data source (the social web), and employing new computational methods (e.g. sentiment analysis and retrospective cohort study design) on this new form of data.151515Source code and data available at github.com/oztalha/Flint. In this regard, this work should be seen as the first step toward drawing more challenging inferences on the sociology of disasters from social media data.
8 References
[1] de Albornoz, J.C., Plaza, L. and Gervás, P. 2012. SentiSense: An easily scalable concept-based affective lexicon for sentiment analysis.
[2] Bartels, L.M. 2002. Beyond the Running Tally: Partisan Bias in Political Perceptions. Political Behavior. 24, 117–150.
[3] Bird, S., Klein, E. and Loper, E. 2009. Natural language processing with Python. O’Reilly Media, Inc.
[4] Bucher, R. 1957. Blame and Hostility in Disaster. American Journal of Sociology. 62, 467–475.
[5] Detroit gives notice: It’s terminating water contract covering Flint, Genesee County in one year: 2013. http://www.mlive.com/news/flint/index.ssf/2013/04/detroit_gives_notice_its_termi.html. Accessed: 2016-06-14.
[6] Drabek, T.E. 1986. Human System Responses to Disaster: An Inventory of Sociological Findings. Springer New York.
[7] Einwiller, S.A. and Steilen, S. 2015. Handling complaints on social network sites – An analysis of complaints and complaint responses on Facebook and Twitter pages of large US companies. Public Relations Review. 41, 195–204.
[8] Feenstra, R.A. and Casero-Ripollés, A. 2014. Democracy in the Digital Communication Environment: A Typology Proposal of Political Monitoring Processes. International Journal of Communication. 8, 21.
[9] Flint Water Advisory Task Force Final Report: 2016. https://www.michigan.gov/documents/snyder/FWATF_FINAL_REPORT_21March2016_517805_7.pdf. Accessed: 2016-06-16.
[10] Genesee County News Release: 2013. http://media.mlive.com/newsnow_impact/other/Genesee%20County%20news%20release.pdf. Accessed: 2016-06-14.
[11] Glasgow, K., Vitak, J., Tausczik, Y. and Fink, C. 2016. “With Your Help. We Begin to Heal”: Social Media Expressions of Gratitude in the Aftermath of Disaster. Social, Cultural, and Behavioral Modeling: 9th International Conference, SBP-BRiMS 2016, Washington, DC, USA, June 28-July 1, 2016, Proceedings.
[12] Hutto, C.J. and Gilbert, E. 2014. VADER: A Parsimonious Rule-Based Model for Sentiment Analysis of Social Media Text. Eighth International AAAI Conference on Weblogs and Social Media.
[13] Iyengar, S. 1994. Is anyone responsible?: How television frames political issues. University of Chicago Press.
[14] Kowalski, R.M. and Western Carolina U 1996. Complaints and complaining: Functions, antecedents, and consequences. Psychological Bulletin. 119, 179–196.
[15] Krugman, P. 2016. Michigan’s Great Stink. The New York Times.
[16] Kumar, S., Barbier, G., Abbasi, M.A. and Liu, H. 2011. TweetTracker: An Analysis Tool for Humanitarian and Disaster Relief. ICWSM.
[17] Kwak, H., Lee, C., Park, H. and Moon, S. 2010. What is Twitter, a Social Network or a News Media? Proceedings of the 19th International Conference on World Wide Web, New York, NY, USA.
[18] Landis, J.R. and Koch, G.G. 1977. The Measurement of Observer Agreement for Categorical Data. Biometrics. 33, 159–174.
[19] Lau, R.R. 1985. Two Explanations for Negativity Effects in Political Behavior. American Journal of Political Science. 29, 119–138.
[20] Lin, Y.-R. and Margolin, D. 2014. The ripple of fear, sympathy and solidarity during the Boston bombings. EPJ Data Science. 3.
[21] McPherson, M., Smith-Lovin, L. and Cook, J.M. 2001. Birds of a Feather: Homophily in Social Networks. Annual Review of Sociology. 27, 415–444.
[22] Neal, D.M. 1984. Blame Assignment in a Diffuse Disaster Situation: A Case Example of the Role of an Emergent Citizen Group. International journal of mass emergencies and disasters. 2, 251–266.
[23] Olteanu, A., Vieweg, S. and Castillo, C. 2015. What to Expect When the Unexpected Happens: Social Media Communications Across Crises. Proceedings of the 18th ACM Conference on Computer Supported Cooperative Work & Social Computing, New York, NY, USA.
[24] Palen, L., Vieweg, S., Sutton, J., Liu, S.B. and Hughes, A.L. 2007. Crisis informatics: Studying crisis in a networked world. Proceedings of the Third International Conference on E-Social Science.
[25] President Obama Signs Michigan Emergency Declaration: 2016. https://www.whitehouse.gov/the-press-office/2016/01/16/president-obama-signs-michigan-emergency-declaration. Accessed: 2016-06-02.
[26] Report: Buying in to new water pipeline from Lake Huron cheaper for Flint drinking water than treating river water: 2011. http://www.mlive.com/news/flint/index.ssf/2011/09/water_treatment.html. Accessed: 2016-06-14.
[27] Rotman, D., Vieweg, S., Yardi, S., Chi, E., Preece, J., Shneiderman, B., Pirolli, P. and Glaisyer, T. 2011. From Slacktivism to Activism: Participatory Culture in the Age of Social Media. CHI ’11 Extended Abstracts on Human Factors in Computing Systems, New York, NY, USA.
[28] Sears, D.O. and Freedman, J.L. 1967. Selective Exposure to Information: A Critical Review. The Public Opinion Quarterly. 31, 194–213.
[29] Shear, M.D. and Bosman, J. 2016. “I’ve Got Your Back,” Obama Tells Flint Residents. The New York Times.
[30] Simon, B. and Klandermans, B. 2001. Politicized collective identity: A social psychological analysis. American Psychologist. 56, 319–331.
[31] Singer, T.J. 1982. An introduction to disaster: Some considerations of a psychological nature. Aviation, space, and environmental medicine.
[32] Spence, P.R., Lachlan, K.A. and Rainear, A.M. 2016. Social media and crisis research: Data collection and directions. Computers in Human Behavior. 54, 667–672.
[33] Tausczik, Y.R. and Pennebaker, J.W. 2010. The Psychological Meaning of Words: LIWC and Computerized Text Analysis Methods. Journal of Language and Social Psychology. 29, 24–54.
[34] Tobler, W.R. 1970. A Computer Movie Simulating Urban Growth in the Detroit Region. Economic Geography. 46, 234–240.
[35] Wallace, A.F.C. 1956. Human behavior in extreme situations; a study of the literature and suggestions for further research. Washington, National Academy of Sciences, National Research Council.
[36] Wen, X. and Lin, Y.-R. 2016. Sensing Distress Following a Terrorist Event. Social, Cultural, and Behavioral Modeling. K.S. Xu, D. Reitter, D. Lee, and N. Osgood, eds. Springer International Publishing. 377–388.