HIghMass - High HI Mass, HI-rich Galaxies at z:
Combined HI and H2 Observations
Abstract
We present resolved Hi and CO observations of three galaxies from the HIghMass sample, a sample of Hi-massive (), gas-rich ( in top 5% for their ) galaxies identified in the ALFALFA survey. Despite their high gas fractions, these are not low surface brightness galaxies, and have typical specific star formation rates (SFR) for their stellar masses. The three galaxies have normal star formation rates for their H2 masses, but unusually short star formation efficiency scale lengths, indicating that the star formation bottleneck in these galaxies is in the conversion of Hi to H2, not in converting H2 to stars. In addition, their dark matter spin parameters () are above average, but not exceptionally high, suggesting that their star formation has been suppressed over cosmic time but are now becoming active, in agreement with prior H observations.
1 Introduction
Star-forming galaxies in the local universe follow a tight correlation between specific star formation rate () and stellar mass known as the star-forming main sequence: as stellar mass increases, SSFR slowly decreases (e.g. Brinchmann et al. 2004, Salim et al. 2007, Schiminovich et al. 2007). This main sequence has been observed out to high stellar masses () in the optically selected GASS survey (the GALEX Arecibo SDSS survey; Catinella et al. 2010, Schiminovich et al. 2010). However, optically-selected samples are inherently biased towards galaxies with higher surface brightnesses. In comparison to optical samples, samples selected by Hi are bluer, have higher gas fractions (), lower star formation efficiencies (), and lower surface brightness than optically-selected samples (e.g. Huang et al. 2012a). Given the strong differences between optically and Hi-selected samples, it not immediately clear whether galaxies with high Hi masses also follow the star formation main sequence.
Consider the “Hi Monsters” sample of Lee et al. (2014) and the Bluedisks sample of Wang et al. (2013), which were selected on the basis of Hi mass, either directly from the ALFALFA survey (in the case of the Hi Monsters), or as inferred from optical colors (Bluedisks), with each sample yielding Hi masses of and , respectively. The Hi Monsters have high Hi masses, and correspondingly high and . They also have quite high star formation rates, and their SSFRs lie on the star forming main sequence. The Bluedisks galaxies’ Hi radii follow scaling relations derived for lower galaxies. Additionally, their Hi disks do not appear disturbed, suggesting that they had not recently acquired gas from a merger. It appears that selecting on the basis of Hi mass alone yields samples which are similar to lower mass spiral galaxies, but “scaled up” to higher total mass. As gas fraction decreases with increasing stellar mass, these samples consist of Hi-massive, but not particularly gas-rich galaxies. Instead, the typical gas fractions of both samples are in the range .
Many galaxies which are both Hi-massive () and gas-rich () deviate from the star-forming main sequence. Some are giant, low-surface brightness galaxies (GLSBs) like Malin 1 (, ; Bothun et al. 1987; Lelli et al. 2010). GLSBs are also seen to also exhibit low surface densities of Hi. Lemonias et al. (2014) examined an optically selected-sample of GASS galaxies with and high gas fractions. As a whole, the sample has suppressed star formation, lying in the same region of space as GLSBs. Karl G. Jansky Very Large Array (VLA) observations of the sample show that these galaxies have extended, low average deprojected Hi surface density (), as well as low deprojected SFR surface density ().
From the 40% sky area data release of the ALFALFA survey (; Haynes et al. 2011), we have identified the HIghMass sample, first presented in Huang et al. (2012a). Like the sample of Lemonias et al. (2014), the HIghMass galaxies are selected to have both a high Hi mass () and unusually high gas fractions for their stellar masses (GF is 1 above average). This yields a sample with ; half have . Despite these high gas fractions, unlike the optically-selected sample of Lemonias et al. (2014), the HIghMass galaxies do not have suppressed star formation: they fall along the star forming main sequence.
The only sample with properties similar to HIghMass is HiGHz (Catinella & Cortese, 2015). The HiGHz galaxies are similarly massive () and gas-rich (), while also lying on or above the star-forming main sequence. The galaxies of the HiGHz sample lie at , and are massive galaxies which are still assembling their disks. The HIghMass galaxies are at a redshift of , suggesting that the HIghMass galaxies are the low redshift analogs of the HiGHz sample. But how can massive gaseous reservoirs like those observed in the HIghMass galaxies survive to in galaxies whose star formation isn’t suppressed? Our hypotheses broadly fall into two categories. First, the galaxies have unusually high dark matter halo spin parameters, suppressing time-averaged star formation. Second, their cold gas has been recently acquired.
The dark matter spin parameter is a dimensionless way to quantify the angular momentum of a dark matter halo, . Theoretically, high spin parameters are associated with bluer colors, lower optical surface brightness, and higher gas fractions (e.g., Jimenez et al. 1998; Mo et al. 1998; Boissier & Prantzos 2000; Macciò et al. 2007). Unfortunately, is ultimately a parameter which is not directly observable. Despite this, several works have attempted to infer it for populations of galaxies based on optical (Hernandez et al. 2007; Cervantes-Sodi & Hernández 2009) and a combination of optical and Hi properties (Huang et al., 2012a), with results agreeing with theory. Huang et al. (2012a) found that the ALFALFA population as a whole have elevated values of compared with an SDSS-selected sample Hernandez et al. (2007). Huang et al. (2014) further suggest that the HIghMass galaxies have, on average, even higher values of than the overall ALFALFA sample.
Recent gas can come from a “galactic fountain” effect, where supernovae have ionized and ejected gas (Fraternali & Binney 2006, 2008; Oppenheimer et al. 2010). While outside of the galactic disk, the gas is unable to form stars. Over time, the gas can cool, recombine and return to the disk. Studies of NGC 891 and NGC 2403 (Fraternali & Binney, 2008) at a distance of Mpc have inferred reaccretion rates as high as yr-1, similar to their star formation rates. Simulations by Marinacci et al. (2010) find that in most cases, this extraplanar gas is unlikely to be of high enough column density to be observed directly, but can contribute to a galaxy’s global profile—that is, there can exist gas which is unable to contribute to star formation but will contribute to the Hi mass observed by ALFALFA. Such gas shares a common specific angular momentum with the existing gaseous disk, but can cause inflows (Fraternali et al., 2001). Alternatively, recently acquired gas may originate in the intergalactic medium, having been unassociated with any galaxy until now. Such gas has angular momentum which is uncorrelated with the galaxy’s disk, leading to warps as well as flows (Fraternali & Binney, 2008).
Previous work by Hallenbeck et al. (2014) examined in detail two of the HIghMass galaxies using kpc resolution VLA observations. The two galaxies have quite similar optical photometric and unresolved Hi spectral properties: , , specifically with . However, upon resolving the Hi, we see that the two galaxies are drastically different. One (UGC 12506) is a low surface brightness (LSB) galaxy with a very high dark matter halo spin parameter (), low surface density, extended Hi (typically at radii from kpc), and low star formation surface densities. The other (UGC 9037) has an elevated high spin parameter (), but has both high central Hi surface density ( at radii less than 10 kpc) and centrally peaked star formation. In addition, UGC 9037 has what appear to be high-velocity inflows at all radii, with a peak non-circular , suggesting that the galaxy is undergoing transition to a more intense star-forming phase.
This paper is the second in a series, building on the results of Hallenbeck et al. (2014). We present observations of the 12CO(1-0) line (as a proxy for H2), observed using CARMA (the Combined Array for Research in Millimeter-wavelength Astronomy) for three galaxies, UGC 6168, UGC 7899, and NGC 5230 (which is also UGC 8573). These three galaxies were specifically selected for study because they had the highest predicted CO column density using the scaling relations derived by Saintonge et al. (2011). These new observations are combined with the H studies of Huang et al. (2014) to examine disk stability and the star formation efficiency of the Hi and H2 phases and determine whether the star formation bottleneck is in the conversion of Hi to H2, or H2to stars. In addition, in order to test the recent accretion hypothesis, we are studying the resolved gas velocity fields to search for gas inflows and warps. Finally, we directly derive values of for each galaxy.
Much of our data reduction mirrors that in the previous work of Hallenbeck et al. (2014). We summarize and discuss differences from that previous work in §2. Results for each individual galaxy are presented in §3. We discuss possible evolutionary histories for each galaxy as well as the HIghMass sample in general in §4. Our conclusions are summarized in §5.
2 Observations and Data Reduction
In Table 1 we present the global gas, stellar, and star formation properties of the three HIghMass galaxies studied in this work, as well as the two galaxies studied by Hallenbeck et al. (2014). Except as described in the following sections, data reduction and analysis methods for gas are identical to those in Hallenbeck et al. (2014); methods for deriving stellar and star formation properties follow the methods of Huang et al. (2014). A brief summary of those methods are as follows:
-
•
Total Hi masses, recessional velocities, and distances are taken from the catalog (Haynes et al., 2011), which assumes km s-1 Mpc-1.
-
•
Hi observations were performed at the VLA and GMRT; data reduction uses a combination of standard CASA and GIPSY packages. These methods recover the total Hi flux of our galaxies, and produce line profiles which agree with the single dish catalog.
-
•
Rotation curves are derived by fitting tilted rings to the observed moment 1 velocity fields using the GIPSY task rotcur, with radii spaced every half beam width. Non-circular velocities are then re-examined and confirmed using the DiskFit package (Spekkens & Sellwood 2007; Sellwood & Sánchez 2010; Kuzio de Naray et al. 2012).
-
•
Star formation rates and surface densities are calculated from H imaging taken at Kitt Peak National Observatory (KPNO). We take the resulting profiles directly from Huang et al. (2014).
-
•
Dark matter properties are determined by fitting to the observed rotation curves using the GIPSY task rotmas. We model each galaxy as having thin gas (Hi, H2, and He) and stellar components along with dark matter.
-
•
A modified dark matter halo spin parameter is calculated directly from the resolved gas properties and the dark matter halo fit (Equations 4, 5, and 6 from Hallenbeck et al. 2014):
(1) Where , , and are the Hi mass, velocity, and galactocentric radius of each tilted ring, is the maximum circular velocity of a fit pseudo-isothermal halo, and is the mass of the dark matter halo. is obtained via abundance matching both the combined stellar and Hi masses (Papastergis et al., 2012).
| Galaxy | d | (SED) | (IRAC) | log SFR | |||
|---|---|---|---|---|---|---|---|
| Mpc | kpc | yr-1 | |||||
| (1) | (2) | (3) | (4) | (5) | (6) | (7) | (8) |
| UGC 6168 | 120 | 10.35 | 8.96 | 23.8 | 10.37 | 10.59 | 0.57 |
| UGC 7899 | 128 | 10.42 | 9.68 | 36.8 | 10.49 | 10.93 | 1.20 |
| NGC 5230 | 101 | 10.53 | 10.02 | 36.3 | 10.89 | 11.22 | 0.96 |
| UGC 9037 | 88 | 10.33 | — | 23.0 | 10.09 | — | 0.56 |
| UGC 12506 | 98 | 10.53 | — | 40.0 | 10.46 | — | 0.40∗ |
Note. — Optical and radio properties of the HIghMass galaxies in this work and in Hallenbeck et al. (2014). Column 1: galaxy identifier; Column 2: Hubble flow distance of galaxy, from Haynes et al. (2011); Column 3: Hi mass, from Haynes et al. (2011); Column 4: Inferred H2 mass from CARMA observations of 12CO() line; Column 5: Radius of the 25 mag arcsec-2 isophote in -band; Column 6: stellar mass, derived from fitting SEDs to SDSS magnitudes, from Huang et al. (2012a); Column 7: stellar mass, derived from Spitzer observations, and the mass-to-light ratios of Querejeta et al. (2014); Column 8: H-derived star formation rates, from Huang et al. (2014) (∗the SFR of UGC 12506 is an exception and is derived from SED fitting its SDSS magnitudes).
2.1 CO Observations & Inferred H2 Properties
The three HIghMass galaxies were observed using CARMA in its compact E configuration. The CARMA visibilities for the three galaxies are exported from the native MIRIAD format into CASA before following the same data reduction techniques as were performed for the Hi observations. The VLA has a primary beam full width half haximum of when observing the 21 cm Hi line. However, at 115 GHz, the CARMA primary beam scale is , similar to the sizes of our galaxies (major axes ). We image out to the 20% response contour, and correct the fluxes accordingly.
Single-dish 12CO(1-0) observations of 18 HIghMass galaxies were performed with the 30m IRAM telescope, including UGC 6168, UGC 7899, and NGC 5230. For all three galaxies, we produced spectra from the CARMA data cubes corresponding to the the 22′′ field of view of the 30m IRAM dish. The fluxes derived from these spectra agree with the fluxes derived from the single-dish observations (Huang et al 2017 in preparation).
We must assume a conversion factor between the observed CO luminosity (in units of K km s-1 pc2) and the total H2 mass, known as . The conversion factor is known to vary with metallicity (e.g. Wilson 1995, Arimoto et al. 1996, Bolatto et al. 2013, Sandstrom et al. 2013). However, even though the HIghMass galaxies are gas-dominated, they all have M⊙, and thus we expect them to have metallicities similar to the Milky Way. We follow Saintonge et al. (2011) and use a Milky Way value for averaged over several recent measurements (Strong & Mattox 1996; Dame et al. 2001; Blitz et al. 2007; Draine et al. 2007; Heyer et al. 2009; Abdo et al. 2010), MK km s-1 pc. Given the conversion factor, we then compute the total H2 mass following Solomon et al. (1997):
| (2) |
where is the total integrated CO flux in Jy km s-1 (which are our intensity map units) and is the rest frequency of the line in GHz, which for 12CO(1-0) is 115.271 GHz, and is the Hubble flow distance of the galaxy in Mpc.
Production of H2 moment maps, fitting of rotation curves, and deriving deprojected surface densities then follows the same method as for Hi. However, in most cases, the CO is only partially resolved by CARMA, and so we must assume inclinations and position angles as derived by the Hi rotation curves.
2.2 Stellar Masses
Hallenbeck et al. (2014) used a combination of two methods to calculate stellar masses. Global stellar masses were calculated based on fitting model spectral energy distributions to SDSS magnitudes (Salim et al. 2007; Huang et al. 2012b; Huang et al. 2012a). These were then used to constrain the less precise surface density profiles following the method of Bell et al. (2003).
Here, instead of relying on optical photometry, we use infrared 3.6µm and 4.5µm photometry taken with Spitzer IRAC (Werner et al. 2004; Fazio et al. 2004), which should trace the old stellar population. We then convert to stellar masses following Equation (4) of Querejeta et al. (2014):
| (3) |
where is the mass to light ratio of the 3.6µm band, and is the color from the 3.6µm and 4.5µm bands. For UGC 6168, UGC 7899, and NGC 5230, the IRAC stellar masses are larger by a factor of compared with the SED fit masses. It is possible that this method is overestimating our stellar masses because the IRAC bands may have hot dust contamination as a result of dust heating by active star formation.
2.3 Stability Criteria
When calculating the stability of the disk via the Toomre parameter, the work of Hallenbeck et al. (2014) neglected the contribution from stars. For both galaxies, the stellar mass was quite centrally concentrated by comparison with the Hi. In addition, . As a consequence, simple two-phase models of the galaxy disk, such as those by Wang & Silk (1994) and Rafikov (2001) predicted essentially no change in at all radii.
However, the inclusion of H2 requires serious consideration. As H2 is much cooler and has a higher per-particle mass than Hi, its turbulent velocity is lower. As a consequence, for the same gas surface density, H2 is less stable. Therefore, in this paper we also consider the method of Romeo & Wiegert (2011) and Romeo & Falstad (2013). Their accounts for an arbitrary number of phases. It is defined as (see Equation 19 of Romeo & Falstad 2013):
| (4) |
The first factor is the Toomre parameter for each particular phase, consisting of Newton’s gravitational constant , the surface density of the phase , the velocity dispersion of the phase and the epicyclic frequency calculated from the rotation curve. and are dimensionless parameters of order unity; these account for the overall stability being dominated by the most stable phase and the effect of the finite thickness of the disk, respectively (see Eqns. 16 and 18 from Romeo & Falstad 2013). Following Romeo & Falstad 2013, we use km s-1 (Wilson et al., 2011) and km s-1 (Leroy et al., 2008).
In the rest of this work, when we refer to “Toomre ”, we mean that we are treating all of the gas (Hi, H2, and He) as a single phase with km s-1, with He included as a factor of 1.33 correction to the mass. This will accurately model the Hi, but will overestimate the stability of the H2 from an artificially high . “” refers to the multi-phase stability criteria of Romeo & Falstad (2013), which properly accounts for the cold H2.
3 Results
3.1 Overview of UGC 6168
In Figure 1 (top), we present the integrated flux maps for our Hi and CO synthesis observations of UGC 6168. The contours begin at and are spaced every 5 of Hi or inferred H2 mass, as projected onto the sky. These contours are then overlaid on SDSS -band images. The top left panel shows the Hi integrated flux map. Like the other two galaxies in this work, UGC 6168 is a spiral galaxy. Huang et al. (2014) note that the color gradient in UGC 6168 reverses, that is, as radius increases, the average color of the galaxy first becomes bluer, then redder in the outer disk. Color inversions may be related to declining star formation, dust-obscured central star formation, and outward migration of stars. This color gradient reversal is also a feature of UGC 7899 and NGC 5230.
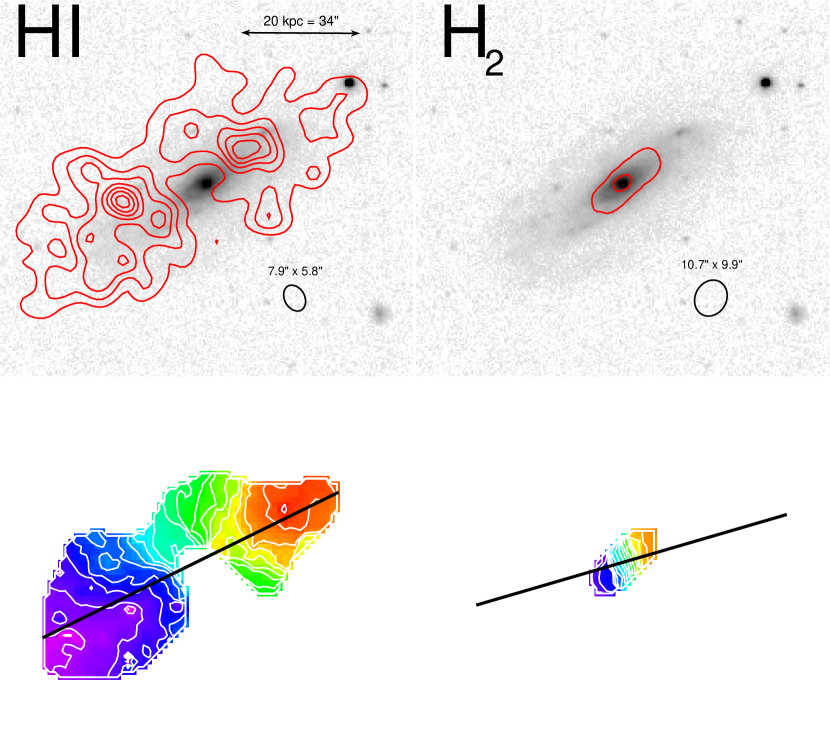
The Hi is extended beyond the optical radius, as is typical for a gas-rich galaxy. In addition, the Hi within 5 kpc of the galaxy’s center is clearly depleted, leaving a hole. This is unsurprising: the galaxies discussed in this work were specifically observed because they had the highest expected H2 masses out of the HIghMass sample. They are thus likely to be some of the most efficient at transforming gas into new stars. The top right panel shows the H2 distribution, as inferred from the CO emission. It very neatly fills in the hole left by the Hi.
The bottom panels of Figure 1 show the velocity fields of the Hi (left) and CO (right). Isovelocity contours are spaced every 20 km s-1. The CO emission is not sufficiently resolved by our 10″ clean beam, and so no rotation curve can be fit. We nonetheless fit an average position angle, and the best-fit for each phase is overlaid. We note that the rotational axis of each phase is clearly different, which is indicative of noncircular flows.

Figure 2 presents the rotation curve of UGC 6168 derived from a tilted ring fit. The top left panel shows the rotation velocity as a function of radius. This rotation curve is derived with constant PA north of west and . UGC 6168’s rotation increases slowly to km s-1 over the 35 kpc which we can trace the gas, and appears to still be rising. Our rotcur model of the galaxy includes strong non-circular motions (top right panel) within 25 kpc of the galaxy’s center. These non-circular velocities reach 40% of the galaxy’s rotation speed, significantly higher than the 9% observed in the “marginally unstable” UGC 9037 by Hallenbeck et al. (2014). It must be noted, however, that the sign of the non-circular velocities are degenerate with galaxy geometry, and these could be associated with either inward or outward flows. rotcur underestimates the uncertainties of the non-circular velocities. Fitting the galaxy’s rotation curve with DiskFit—which more accurately estimates the uncertainties—indicate that models of radial or bar-like flows are of significance.
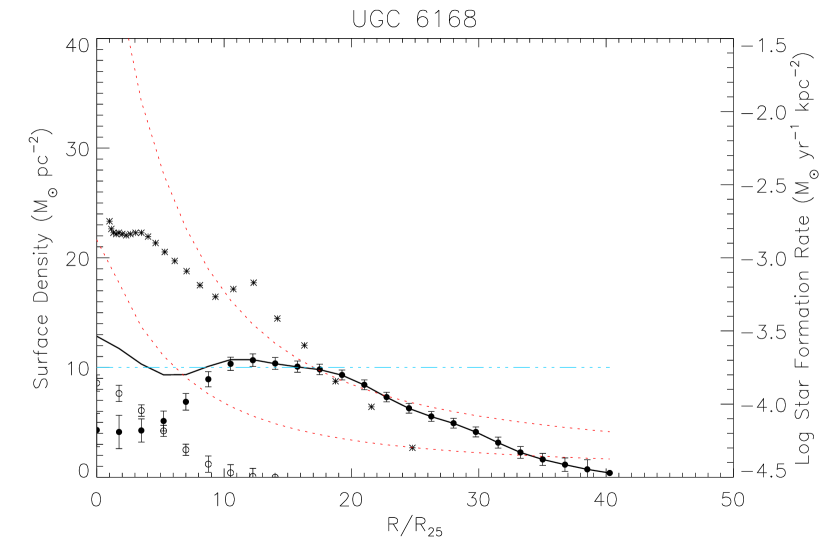
Figure 3 shows the deprojected surface density profiles of both the Hi (closed circles) and H2 (open circles). The solid black line is the total gas density. The stars depict the star formation surface density (from Huang et al. 2014, Figure 15). In the inner disk, the total gas density remains relatively constant at (dashed-dotted cyan line), a surface density beyond which there is rarely Hi at solar metallicities (e.g., Bigiel et al. 2008); at solar abundance, gas above this threshold tends to be entirely molecular. This is the “saturation line” referred to in this and subsequent figures. The upper red dotted line indicates a gas surface density corresponding to an unstable (; upper line) thin gas disk. Generally, widespread disk instability is not observed in the local universe; any time gas surface densities exceed this value, it is likely a failure of the single phase thin gas disk model (for discussion of a more realistic model for all three galaxies, see §3.4). However, at surface densities corresponding to (lower red dotted line), star formation is observed to be enhanced (Kennicutt 1989; Martin & Kennicutt 2001; Leroy et al. 2008). We refer to as the “marginally unstable” regime. For UGC 6168, the gas disk is predicted to be stable in the interior 7 kpc and at kpc, and is marginally unstable at intermediate radii. This marginal instability coincides with a SFR enhancement near 12-15 kpc. However, overall star formation is peaked at the center of the galaxy, where we predict the gas to be stable.
3.2 Overview of UGC 7899
Images, surface density contours, and velocity fields of UGC 7899 appear in Figure 4; the panels are identical to Figure 1. Like UGC 6168, UGC 7899 is an inclined spiral galaxy, with . It also exhibits a color reversal, where the galaxy exhibits redder colors at larger radii than at intermediate radii (Huang et al., 2014). A close inspection also reveals that the optical galaxy is not perfectly symmetric: it tapers, with the optical emission at the northern edge of the galaxy more extended than at the southern edge.
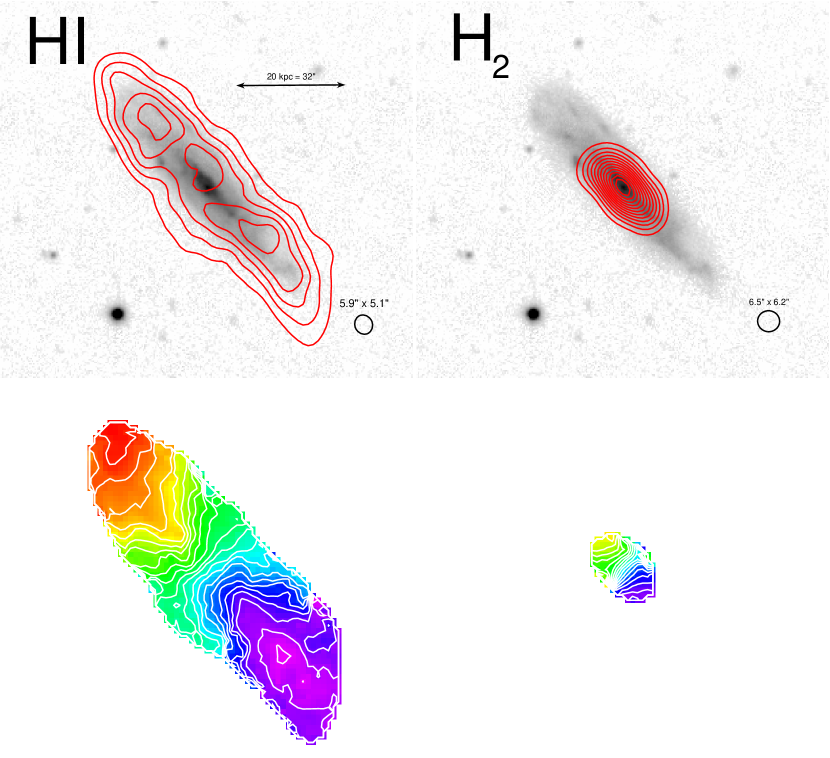
The Hi and inferred H2 contours begin at projected 5 and increase by 5 at each additional contour. The Hi in the center of UGC 7899 is not depleted: there is no Hi ring. Instead, its surface density becomes approximately constant. There are, however, high H2 surface densities—much higher densities that are observed in either UGC 6168 or UGC 7899, reaching a projected column density of (corresponding to roughly 25 when deprojected). The contours on the southern side of the galaxy suggest a slight warp in the Hi disk at large radii.
The bottom panels show the velocity fields of the Hi (left) and CO (right). The Hi velocity field appears slightly asymmetric, suggesting a warp in the outermost part of the disk. Like UGC 6168, the CO is only marginally resolved at the scale of the CARMA beam, and no rotation curve can be fit.
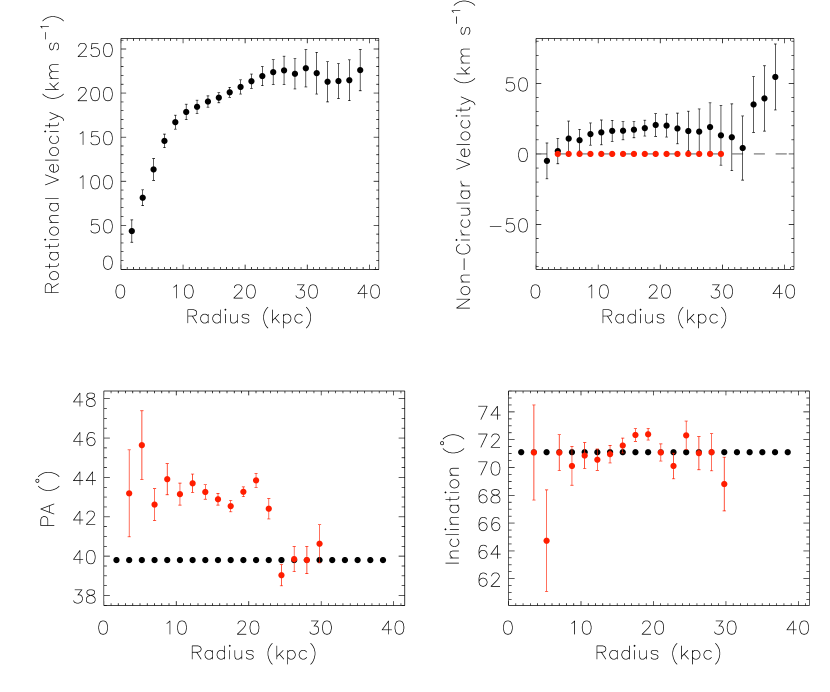
Figure 5 presents the results of tilted ring fits to the UGC 7899’s Hi velocity field (black circles). The best fit constant PA and are PA north of west and . The rotation curve rises linearly to km s-1 then changes to a shallower slope, reaching a maximum of km s-1. The fit becomes uncertain at large radii because of the north-south mismatch mentioned above: we find a declining rotation curve in the southern approaching half of the galaxy, but not in the northern receding half. DiskFit suggests that these observed non-circular flows are of marginal () significance, and only in the outer regions. Because geometry and non-circular velocities are degenerate, we fit a second model to the map to capture the effect of the galaxy’s warp (red circles). This model holds fixed both the rotation curve and a radial flow of 0 km s-1. Here we observe a relatively constant position angle, which changes abruptly by at a galactocentric radius of 25 kpc.
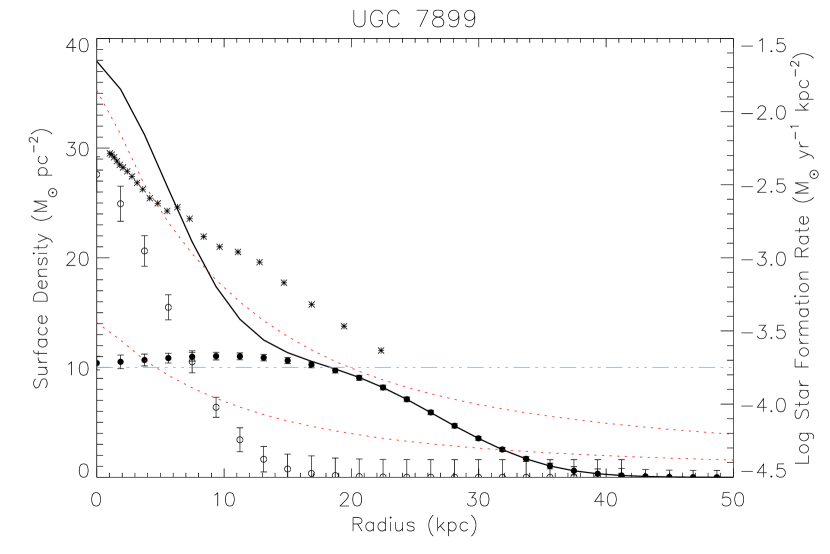
Figure 6 presents de-projected surface densities of Hi and H2 as a function of radius. Also included are our and stability curves and a saturation line. Unlike UGC 6168, there is no Hi hole in the center of the galaxy. Instead, the Hi saturates at 10 , while reaches nearly 30 , 50% higher than either of the other two galaxies in this work. We predict that the disk is marginally unstable for kpc, with the disk at or near instability for kpc. This is in agreement with the observation that the most active star formation in UGC 7899 is centrally located.
3.3 Overview of NGC 5230 (UGC 8573)
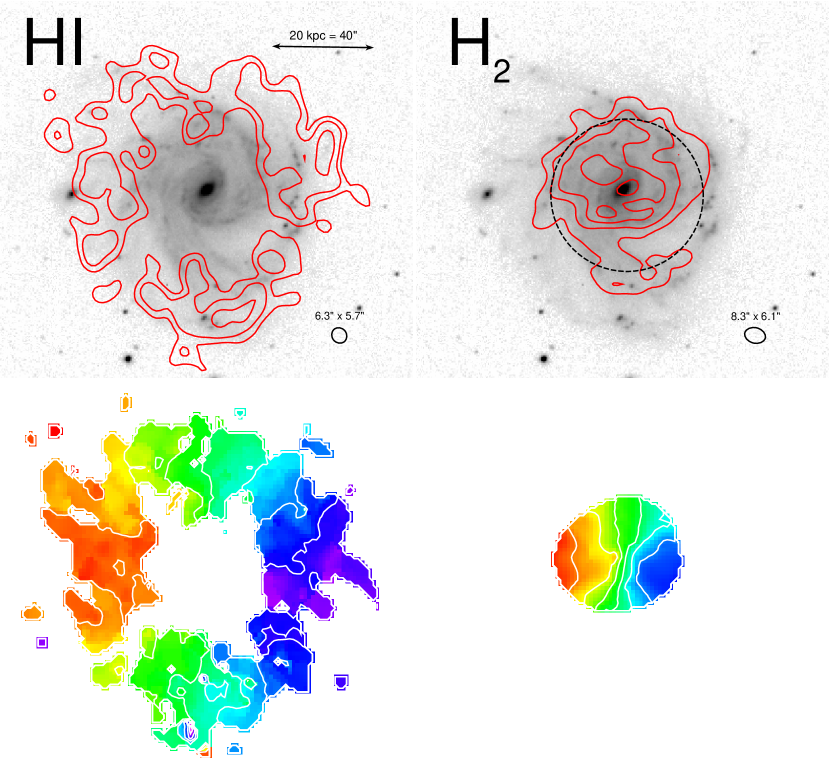
Figure 7 presents the Hi and CO moment maps of NGC 5230. NGC 5230 is a large spiral galaxy with a low inclination (). Its southern arm appears less tightly wound than the other two in the north. Like UGC 6168, there is a large central hole where the Hi has essentially all been converted into H2. However, the Hi hole in NGC 5230 is larger, with a radius of 10-15 kpc and has no Hi down to our detection limits of 1.63 . All three spiral arms show enhanced densities of H2, out to CARMA’s half power response radius (dashed line). We thus cannot know if all of the CO has been mapped. Regardless, we have adequately mapped the CO emission of the inner 30” ( kpc).
Because of the low inclination of NGC 5230 (), fitting a rotation curve and deriving surface densities from Hi velocity fields via tilted ring fits (Begeman, 1989) is highly unreliable. We thus remove it from our later surface density, rotation curve, and dark matter fitting except as noted.
3.4 Multi-Phase Stability Parameter
Figure 8 presents the multi-phase of Romeo & Falstad (2013) for both UGC 6168 (red triangles) and UGC 7899 (green boxes). The radii have been normalized by -band , the radius at which the isophotes reach 25 mag.arcsec.-2. The dashed line indicates a value of . For values of , the disk is unstable to perturbations, while for , the disk is stable.
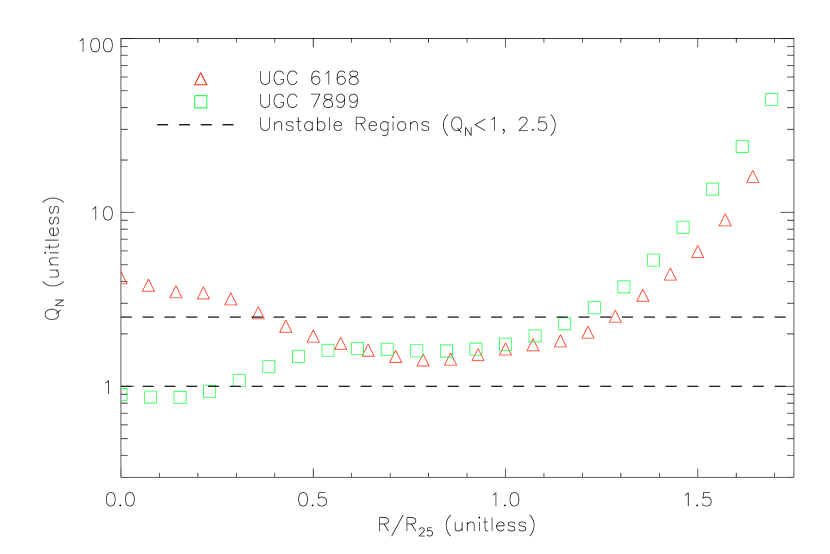
Both galaxies show similar trends: they are predicted to be stable beyond the optical disk (), and are marginally unstable () in the region . In the inner disk (), UGC 6168 becomes stable again, but the high surface densities of H2 cause UGC 7899 to become unstable. Neither disk is predicted to be unstable to ring-like perturbations.
These results are not greatly different from the one-phase Toomre Q results discussed in the previous sections. The only significant change is that for UGC 6168, the multi-phase model predicts a marginally unstable () disk at intermediate radii, while the single-phase predicts a fully unstable disk.
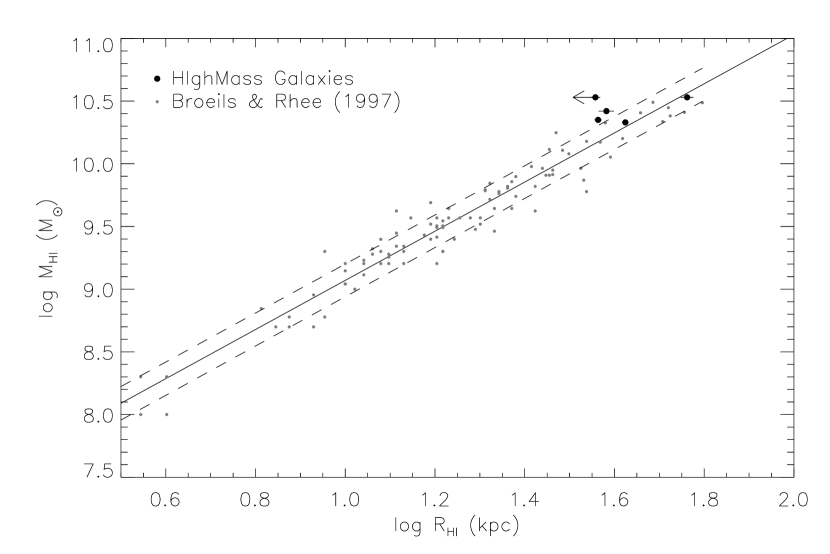
3.5 HI Radii
For both typical spiral galaxies as well as more massive spiral galaxies, there exists a tight linear correlation between the total Hi gas mass and the radius at which the deprojected surface density reaches 1 (Broeils & Rhee 1997; Wang et al. 2013; Wang et al. 2016). This relationship can be expressed as (from Equation 13 in Broeils & Rhee 1997):
| (5) |
Figure 9 presents this line, along with the Broeils & Rhee 1997 sample (gray dots). The HIghMass galaxies are plotted in black. This relationship also holds true for the galaxies discussed by Hallenbeck et al. (2014)—UGC 9037 and UGC 12506. The Hi disks of UGC 6168, UGC 7899, and NGC 5230 lie to the left of the line, and so are more compact than expected. For NGC 5230, we have plotted assuming that , which yields the largest value of . For the three galaxies this difference is near the edge of significance (), but taken together, the difference is reasonably significant (). Theoretically, the baryonic disk scale radius should increase with and the rotational velocity of the disk (e.g. Mo et al. 1998, Hernandez et al. 2007, Berta et al. 2008). This could indicate that these galaxies have somehow had their Hi compressed, or that instabilities in the disk are allowing the normally extended, low surface density gas to flow inward. Table 2 presents the Hi radii of all five galaxies, along with their expected Hi radii.
| Galaxy | ||
|---|---|---|
| (kpc) | (kpc) | |
| (1) | (2) | |
| UGC 6168 | 36.6 () | 45.0 () |
| UGC 7899 | 38.2 () | 48.9 () |
| NGC 5230 | 36.1 ()∗ | 55.6 () |
| UGC 9037 | 42.1 () | 43.9 () |
| UGC 12506 | 57.8 () | 55.6 () |
Note. — Observed and expected Hi radii of the three galaxies in this work and in Hallenbeck et al. (2014). Column 1: observed radius where the Hi reaches a deprojected surface density of 1 , based on fitting the surface density profiles; Column 2: predicted Hi radius, based on Equation 5 and Broeils & Rhee (1997).
∗This is an upper limit assuming the inclination of NGC 5230 is face-on ()
3.6 Star Formation Efficiencies
It has already been observed that the HIghMass galaxies have moderate to high values of SFE(Hi) relative to the ALFALFA sample as a whole (Huang et al., 2012a). In addition, our CARMA observations show that their star formation rates are also typical for their H2 masses: the H2 depletion timescales timescales () are , , and yrs for UGC 6168, UGC 7899, and NGC 5230, respectively. These values are below the timescale observed by the THINGS survey of yrs (Leroy et al., 2008), as well as the yrs found by Bigiel et al. (2011). But, they overlap the predicted range found by the COLD GASS survey for galaxies of similar stellar masses (Saintonge et al. 2011; Saintonge et al. 2011; yrs).
However, the globally averaged SFE of Hi and H2 are just part of the story: the resolved SFE of our sample is likely to shed more light. The THINGS survey found several ways to parametrize the efficiency of the total gas (Hi, H2, and He) as a function of galactic radius, normalized by (see Equation 21 of Leroy et al. 2008). If we just consider the spiral galaxies in THINGS:
| (6) |
This form represents a constant value of , and thus a constant in the region of the interstellar medium which is H2 dominated (; ). Outside of this region, the disk is Hi dominated and the conversion of gas to stars becomes inefficient, declining exponentially with radius.
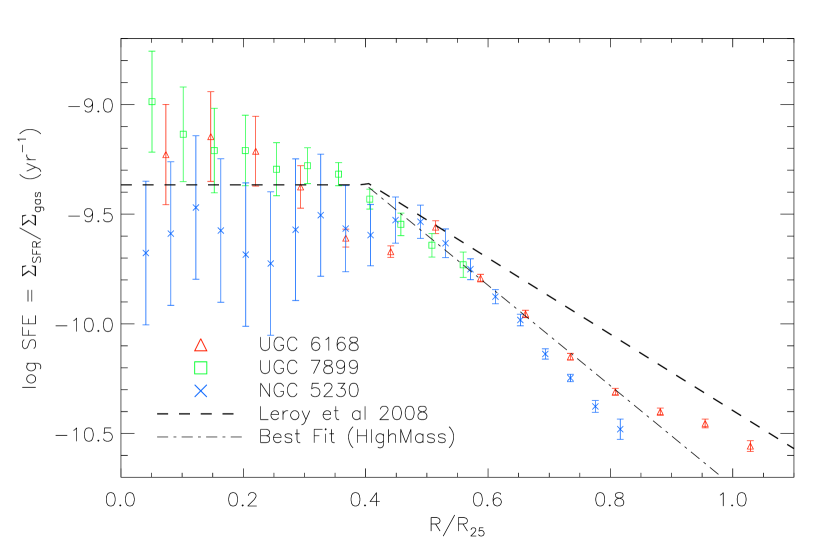
Figure 10 presents this fit, along with SFE(gas) for the three HIghMass galaxies in this work. Red triangles, green boxes, and blue crosses represent data for UGC 6168, UGCC 7899, and NGC 5230, respectively. Here, we include NGC 5230 because SFE(gas) depends on the ratio of two surface densities, and so is independent of the assumed inclination. The dashed line is the parameterization in Equation 6. The HIghMass galaxies in this work all exhibit the same overall trend of the THINGS parameterization: there is a core with nearly constant SFE(gas), and then at some radius, SFE begins to drop. At small radii, where the H2 dominates the ISM, we see essentially no difference between the galaxies in our sample and the average spiral galaxy in the THINGS survey. In the outer disk, where the Hi dominates the ISM, the SFE of our sample is significantly lower than for THINGS. The dashed-dotted line is a best-fit to the HIghMass data, assuming an exponential decrease in SFE(gas) beyond . This has a significantly shorter scale length of .
Given that the global SFE(Hi) for these galaxies is typical, it is somewhat surprising to find that the resolved SFE(gas) is low where the ISM is primarily Hi. This may be a consequence of the gas being unusually compact in these galaxies. The H emission has been traced to only approximately . Of the total Hi mass, 30% resides beyond this radius for UGC 6168 but only 3% for NGC 5230. For UGC 7899, this explanation is less conclusive: the star formation is only traced to with 70% of the total Hi mass residing beyond that radius.
A related possibility is that the relatively lower mass spiral sample of THINGS is a poor comparison sample. for the THINGS galaxies varies between 10 and 20 kpc while the three galaxies in this work have radii of kpc (the HIghMass sample as a whole has an average of 20 kpc). The THINGS-derived SFE(gas) relationship has a factor of 2-3 scatter, and in general the galaxies with larger in the THINGS sample tend to fall below the relationship (Leroy et al., 2008). This may hint at a possible decrease in SFE scale radius at large galaxy radii.
3.7 Dark Matter Properties
We model each galaxy with four components: an Hi disk, an H2 disk, a stellar disk, and dark matter. We use the Hi and H2 surface densities derived in §2 and §2.1 and treat each as a thin disk. The stellar component is also modeled as a thin disk, using the stellar masses described in §2.2. The contribution of the dark matter can be determined via:
| (7) |
where is the rotation curve, and the other velocities are the contributions from each phase. Both a Navarro-Frenk-White (NFW) and pseudo-isothermal profile (ISO) are separately fit to the remaining component.
Using the methods of Querejeta et al. (2014) predict mass to light ratios () which are too high: the resulting stellar mass surface densities yield or unphysical parameters for dark matter fits (, for example). The distribution has a spread of roughly 0.1 dex, which is insufficient to explain the difference. Instead, this is likely because we have not accounted for the effect of dust or stars of intermediate age contaminating the Spitzer and bands, which together can account for 20-60% of the total infrared emission (Meidt et al., 2012). If we allow to vary from its nominal value, best fits for both galaxies yield similarly inappropriate . Instead, we set the average value of such that the Spitzer-derived mass equals the mass from SED-fitting. In such cases, we get good fits for both UGC 6168 and UGC 7899. This requires values of a factor of 2-3 lower than the nominal values derived by Querejeta et al. (2014).
| Galaxy | NFW Fit | ISO Fit | Halo Spin | ||||||
|---|---|---|---|---|---|---|---|---|---|
| () | () | (kpc) | ( pc-2) | (kpc) | |||||
| (1) | (2) | (3) | (4) | (5) | (6) | (7) | (8) | (9) | |
| UGC 6168 | 0.45 | 0.27 | |||||||
| UGC 7899 | 0.43 | 0.16 |
Note. — Best fit results of dark matter halo models to UGC 6168 and UGC 7899, using either a Navarro Frenk White (NFW) or pseudo-isothermal (ISO) dark matter halo model. Column 1: Nominal average mass-to-light ratio of each galaxy in the 3.6µm band; Column 1: adopted mass-to-light ratio from setting total stellar mass from Spitzer observations equal to that calculated via SED fitting; Columns 3 and 4: concentration index and characteristic halo length scale; Column 5: reduced of NFW fit; Column 6-7: halo core density and length-scale; Column 8: reduced of ISO fit; Column 9: modified halo spin parameter, based on ISO fit.

In Figure 11, we present both the dark matter fits to each galaxy’s rotation curve, using the NFW (left) and pseudoisothermal (right) halo profiles. Black dots with uncertainties are the observed rotation curve. The thin solid black line is the total gas (HiH2He) contribution, the short dashed line is the stellar mass contribution, and the long dashed line is the halo fit. The thick solid line is the summed contribution from each of the mass terms. For each galaxy, the dark matter is the dominant contribution to the rotation curve in the best fit model at all radii. For UGC 6168 and UGC 7899, both the ISO and NFW profiles fit well (). Numerical results of the dark matter fits can be found in Table 3.

Figure 12 plots a histogram of dark matter halo spin parameters of three different samples. The solid histogram is the THINGS sample calculated as described in Hallenbeck et al. (2014), and is normalized to unit area. For comparison is the volume-limited sample from the SDSS taken by Hernandez et al. (2007) and calculated from the global optical properties alone. The two distributions (and thus calculation methods) are roughly the same, especially accounting for the differences in sample size (19 THINGS galaxies versus 11597 SDSS-selected galaxies). The remaining filled dotted bars are non-normalized counts of the galaxies from this work combined with Hallenbeck et al. (2014). UGC 12506 clearly has a high spin (). UGC 6168, 7899, and 9037 all have values which are somewhat high, but not far into the tail ().
4 Discussion
UGC 9037 and 12506—the two HIghMass galaxies previously studied in detail by Hallenbeck et al. (2014)—were found to have very different properties. UGC 12506 has low surface densities of Hi (typically at radii from kpc), and is an LSB. These properties can all be explained by its very high dark matter halo spin parameter (). UGC 9037, on the other hand, has an above-average but unexceptional spin parameter (). Its Hi has high () surface densities at kpc, and correspondingly the Toomre Q at most radii was moderately unstable, especially in comparison with the stable Hi disk of UGC 12506. UGC 9037 also has high-velocity gas inflows at all radii. UGC 9037’s above average spin parameter may have suppressed star formation over much of cosmic history. However, the high surface densities of Hi and inflowing gas suggest a recent enhancement in star formation in comparison with its time-averaged rate. We thus see two very different states for these two galaxies: UGC 12506 remains in a low surface density, suppressed star formation state, while UGC 9037 is beginning a phase of enhanced star formation—possibly triggered by recently acquired gas.
Overall, the three galaxies discussed in this work (UGC 6168, UGC 7899, and NGC 5230) appear more like UGC 9037 than UGC 12506. First, none of the three are LSB galaxies. They all have typical star formation rates for their H2 masses, and have short star formation efficiency scale lengths—that is, their star formation quickly becomes extremely inefficient where the interstellar medium is Hi-dominated in comparison with the THINGS sample. These properties strongly suggest that any possible star formation bottleneck is in the Hi to H2 conversion, and not in the conversion of H2 to Hi. In addition, for the two galaxies which a spin parameter can be measured (UGC 6168 and UGC 7899), is found to be above average, but not exceptionally so, and gas surface densities are found to reach typical values () over a range of radii. This is in contrast with the theoretical prediction that higher spin parameters are theoretically associated with lower gas and star formation surface densities (e.g. Boissier & Prantzos 2000). We thus claim that the galaxies in this work are transitioning from a long history of suppressed star formation to a more active phase. These findings are in agreement with Huang et al. (2014), who came to the same conclusion based on studying the H emission of the HIghMass galaxies.
UGC 6168, like UGC 9037 is observed to have a moderately unstable gas disk across a wide range of radii. It is also possible that UGC 6168 has inflowing gas, but the observed noncircular flows in the galaxy are of only marginal () significance. The strongest indication of noncircular flows is the misalignment between the average position angle of the Hi and CO gas phases. It does not have the high Hi surface densities observed in UGC 9037, instead saturating at the typical . Finally, we have calculated its spin parameter to be , an above average, but not extremely large value.
UGC 7899 shares many properties with UGC 6168 and UGC 9037: it is not an LSB, it has a moderately unstable disk, and above-average . Like the previously studied UGC 9037, the Hi in the center of the galaxy is not depleted, but saturates at ; we also see high surface densities of H2. Unlike UGC 6168 and UGC 7899, there is no evidence of noncircular motion in the gas disk of the galaxy. It is unique among the HIghMass galaxies so far presented in that its disk shows some warping, which could be indicative of recent cold accretion from the intergalactic medium. However, warps in Hi disks at large radii have long been observed to be common, even in relatively isolated galaxies (Sancisi 1976; Bosma 1981; Briggs 1990; van der Kruit & Freeman 2011).
Because we are unable to make a clear case for the inclination—and thus the surface densities or dark matter profile—the case for NGC 5230 is more difficult. It is easiest to compare it with the other galaxies in this work: despite high Hi gas masses and GFs, all three show typical values of SFE(Hi) and SFE(gas) in comparison with other Hi-selected galaxies and the optically-selected GASS sample, respectively. All three show a shorter SFE length scale than for the local spirals of THINGS. In addition, all three show evidence for a much smaller than is expected for their Hi masses, regardless of what inclination is assumed for NGC 5230.
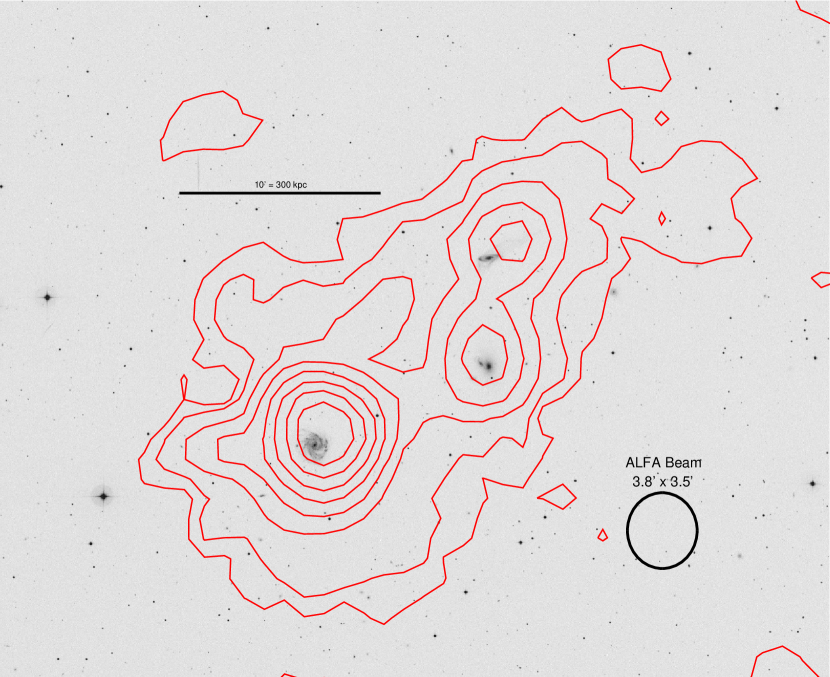
NGC 5230’s neighbors may be the most important clues to understanding the galaxy. There are two galaxies of similar size within 1 Mpc of NGC 5230: NGC 5222, at a projected distance of 300 kpc to the west, and NGC 5221, 400 kpc to the northwest. NGC 5222 is an elliptical galaxy hosting an AGN, and has an optically much smaller blue companion. More interesting is NGC 5221, an irregular spiral with a long tail pointing to the northwest. An optical image of NGC 5230 and its neighbors can be found in Figure 13, with contours from ALFALFA overlaid. These three galaxies are embedded in a common Hi envelope with a significant amount of gas: both NGC 5222’s blue companion and NGC 5221 are detected in ALFALFA with and , respectively. A number of tidal tails and otherwise extragalactic gas can be observed in the ALFALFA data cubes. A bridge or between NGC 5230 and NGC 5221 is visible, and tails between NGC 5222 and its neighbors are possible, but unresolved due to the large ( kpc at 88 Mpc) ALFALFA beam. It is thus a strong possibility that NGC 5230’s current state is due to its clear interaction with its neighbors. Its gas is likely compressed due to tidal torques, yet its star formation efficiency can remain low because much of the gas nominally associated with it is extended and at low column density.
5 Conclusions
The HIghMass sample is a selection of 34 galaxies from the ALFALFA 40% data release which all have high Hi masses and are all gas rich for their stellar masses. We have presented resolved Hi and H2 studies of three HIghMass galaxies, UGC 6168, UGC 7899, and NGC 5230. Along with UGC 9037 and UGC 12506, this brings the total number of resolved gas studies of the HIghMass galaxies to five. None of the galaxies in this work appear to host extremely high dark matter spin parameters like UGC 12506. Instead, most of the galaxies so far appear more like the previously-studied UGC 9037: galaxies in transition from a gas-rich but inactive phase to a phase of active star formation. The galaxies in this work display the following properties:
-
•
High HI masses and high gas fractions compared with an optically selected sample, like all HIghMass galaxies.
-
•
More concentrated HI disks are observed than are expected for their Hi masses. This was not observed in either of the HIghMass galaxies previously studied.
-
•
Moderately unstable disks, with values of both Toomre and the of Romeo & Falstad (2013) over a wide range of radii, are observed in UGC 6168 and UGC 7899.
-
•
Typical H2 star formation efficiencies compared with two optically selected samples: the local spiral galaxies of THINGS and COLD-GASS galaxies of similar stellar mass. This comparison holds for both global (both samples) or resolved SFEs (THINGS).
-
•
Mixed HI star formation efficiencies. Globally, their SFE(Hi) is typical for an Hi-selected sample, but in the Hi-dominated region of each galaxy, SFE as a function of radius declines with a shorter scale length () than the spirals of the THINGS sample ().
-
•
Above average spin parameters compared with an optically selected sample are observed for UGC 6168 and UGC 7899 ( and ); we cannot directly measure for NGC 5230.
Individually, there are a few unique features in each galaxy, which hint at their past, and why their Hi content is so large for their stellar masses:
-
•
For UGC 6168, the average position angles in the Hi and H2 phases do not match, which indicates non-circular motions in its gas disk.
-
•
UGC 7899 is the only HIghMass galaxy thus far for which a warp has been observed in the outer Hi disk, which may be indicative of accretion of cold gas from the intergalactic medium.
-
•
NGC 5230 has two lower-mass neighbors, all sharing a common Hi envelope. Its high Hi mass but typical star formation rate may be partially explained by gas taken from its neighbors which has not yet settled into the galactic disk.
Acknowledgements
This work has been supported by NSF-AST-0606007 and AST-1107390, NASA/JPL Spitzer RSA/73350, grants from the Brinson Foundation, and a Student Observing Support award from NRAO.
This work is based in part on observations made with the Combined Array for Research in Millimeter-wavelength Astronomy (CARMA). Support for CARMA construction was derived from the Gordon and Betty Moore Foundation, the Kenneth T. and Eileen L. Norris Foundation, the James S. McDonnell Foundation, the Associates of the California Institute of Technology, the University of Chicago, the states of California, Illinois, and Maryland, and the National Science Foundation. CARMA development and operations was supported by the National Science Foundation under a cooperative agreement, and by the CARMA partner universities.
This work is based in part on observations made with the Karl G. Jansky Very Large Array, a facility of the National Radio Astronomy Observatory (NRAO). The NRAO is a facility of the National Science Foundation operated under cooperative agreement by Associated Universities, Inc.
This work is based in part on observations made with the Arecibo Observatory. The Arecibo Observatory is operated by SRI International under a cooperative agreement with the National Science Foundation (AST-1100968), and in alliance with Ana G. Méndez-Universidad Metropolitana, and the Universities Space Research Association.
This work is based in part on observations made with the Spitzer Space Telescope, which is operated by the Jet Propulsion Laboratory, California Institute of Technology under a contract with NASA.
This work has made use of THINGS, ‘The Hi Nearby Galaxy Survey’ Walter et al. 2008.
References
- Abdo et al. (2010) Abdo, A. A., Ackermann, M., Ajello, M., et al. 2010, ApJ, 710, 133
- Arimoto et al. (1996) Arimoto, N., Sofue, Y., & Tsujimoto, T. 1996, PASJ, 48, 275
- Baugh (2006) Baugh, C. M. 2006, Reports on Progress in Physics, 69, 3101
- Begeman (1989) Begeman, K. G. 1989, A&A, 223, 47
- Bell et al. (2003) Bell, E. F., McIntosh, D. H., Katz, N., & Weinberg, M. D. 2003, ApJS, 149, 289
- Benson (2010) Benson, A. J. 2010, Phys. Rep., 495, 33
- Berta et al. (2008) Berta, Z. K., Jimenez, R., Heavens, A. F., & Panter, B. 2008, MNRAS, 391, 197
- Bigiel et al. (2008) Bigiel, F., Leroy, A., Walter, F., et al. 2008, AJ, 136, 2846
- Bigiel et al. (2011) Bigiel, F., Leroy, A. K., Walter, F., et al. 2011, ApJ, 730, L13
- Blitz et al. (2007) Blitz, L., Fukui, Y., Kawamura, A., et al. 2007, Protostars and Planets V, 81
- Boissier & Prantzos (2000) Boissier, S., & Prantzos, N. 2000, MNRAS, 312, 398
- Bolatto et al. (2013) Bolatto, A. D., Wolfire, M., & Leroy, A. K. 2013, ARA&A, 51, 207
- Bosma (1981) Bosma, A. 1981, AJ, 86, 1791
- Bothun et al. (1987) Bothun, G. D., Impey, C. D., Malin, D. F., & Mould, J. R. 1987, AJ, 94, 23
- Briggs (1990) Briggs, F. H. 1990, ApJ, 352, 15
- Brinchmann et al. (2004) Brinchmann, J., Charlot, S., White, S. D. M., et al. 2004, MNRAS, 351, 1151
- Broeils & Rhee (1997) Broeils, A. H., & Rhee, M.-H. 1997, A&A, 324, 877
- Brown et al. (2015) Brown, T., Catinella, B., Cortese, L., et al. 2015, MNRAS, 452, 2479
- Catinella et al. (2010) Catinella, B., Schiminovich, D., Kauffmann, G., et al. 2010, MNRAS, 403, 683
- Catinella & Cortese (2015) Catinella, B., & Cortese, L. 2015, MNRAS, 446, 3526
- Cervantes-Sodi & Hernández (2009) Cervantes-Sodi, B., & Hernández, X. 2009, Rev. Mexicana Astron. Astrofis., 45, 75
- Chemin et al. (2009) Chemin, L., Carignan, C., & Foster, T. 2009, ApJ, 705, 1395
- Corbelli et al. (2010) Corbelli, E., Lorenzoni, S., Walterbos, R., Braun, R., & Thilker, D. 2010, A&A, 511, A89
- Cornwell (2008) Cornwell, T. J. 2008, IEEE Journal of Selected Topics in Signal Processing, 2, 793
- Cortese et al. (2011) Cortese, L., Catinella, B., Boissier, S., Boselli, A., & Heinis, S. 2011, MNRAS, 415, 1797
- Cowie et al. (1996) Cowie, L. L., Songaila, A., Hu, E. M., & Cohen, J. G. 1996, AJ, 112, 839
- Dame et al. (2001) Dame, T. M., Hartmann, D., & Thaddeus, P. 2001, ApJ, 547, 792
- de Blok et al. (2008) de Blok, W. J. G., Walter, F., Brinks, E., et al. 2008, AJ, 136, 2648
- de Blok (2010) de Blok, W. J. G. 2010, Advances in Astronomy, 2010, Article ID 789293
- de Vaucouleurs et al. (1991) de Vaucouleurs, G., de Vaucouleurs, A., Corwin, H. G., Jr., et al. 1991, Third Reference Catalogue of Bright Galaxies. Volume I: Explanations and references. Volume II: Data for galaxies between 0h and 12h. Volume III: Data for galaxies between 12h and 24h., by de Vaucouleurs, G.; de Vaucouleurs, A.; Corwin, H. G., Jr.; Buta, R. J.; Paturel, G.; Fouqué, P.. Springer, New York, NY (USA), 1991, 2091 p., ISBN 0-387-97552-7, Price US$ 198.00. ISBN 3-540-97552-7, Price DM 448.00. ISBN 0-387-97549-7 (Vol. I), ISBN 0-387-97550-0 (Vol. II), ISBN 0-387-97551-9 (Vol. III).,
- Draine et al. (2007) Draine, B. T., Dale, D. A., Bendo, G., et al. 2007, ApJ, 663, 866
- Fazio et al. (2004) Fazio, G. G., Hora, J. L., Allen, L. E., et al. 2004, ApJS, 154, 10
- Fraternali et al. (2001) Fraternali, F., Oosterloo, T., Sancisi, R., & van Moorsel, G. 2001, ApJ, 562, L47
- Fraternali & Binney (2006) Fraternali, F., & Binney, J. J. 2006, MNRAS, 366, 449
- Fraternali & Binney (2008) Fraternali, F., & Binney, J. J. 2008, MNRAS, 386, 935
- Giovanelli et al. (2005) Giovanelli, R., Haynes, M. P., Kent, B. R., et al. 2005, AJ, 130, 2598
- Hallenbeck et al. (2014) Hallenbeck, G., Huang, S., Spekkens, K., et al. 2014, AJ, 148, 69
- Haynes et al. (2011) Haynes, M. P., Giovanelli, R., Martin, A. M., et al. 2011, AJ, 142, 170
- Hernandez et al. (2007) Hernandez, X., Park, C., Cervantes-Sodi, B., & Choi, Y.-Y. 2007, MNRAS, 375, 163
- Heyer et al. (2009) Heyer, M., Krawczyk, C., Duval, J., & Jackson, J. M. 2009, ApJ, 699, 1092
- Hopkins et al. (2013) Hopkins, P. F., Kereš, D., & Murray, N. 2013, MNRAS, 432, 2639
- Huang et al. (2012a) Huang, S., Haynes, M. P., Giovanelli, R., & Brinchmann, J. 2012, ApJ, 756, 113
- Huang et al. (2012b) Huang, S., Haynes, M. P., Giovanelli, R., et al. 2012, AJ, 143, 133
- Huang et al. (2014) Huang, S., Haynes, M. P., Giovanelli, R., et al. 2014, ApJ, 793, 40
- Hunter et al. (1998) Hunter, D. A., Elmegreen, B. G., & Baker, A. L. 1998, ApJ, 493, 595
- Jimenez et al. (1998) Jimenez, R., Padoan, P., Matteucci, F., & Heavens, A. F. 1998, MNRAS, 299, 123
- Jog & Solomon (1984) Jog, C. J., & Solomon, P. M. 1984, ApJ, 276, 127
- Jog & Solomon (1992) Jog, C. J., & Solomon, P. M. 1992, ApJ, 387, 152
- Kennicutt (1989) Kennicutt, R. C., Jr. 1989, ApJ, 344, 685
- Kereš et al. (2005) Kereš, D., Katz, N., Weinberg, D. H., & Davé, R. 2005, MNRAS, 363, 2
- Krumholz et al. (2012) Krumholz, M. R., Dekel, A., & McKee, C. F. 2012, ApJ, 745, 69
- Kuzio de Naray et al. (2012) Kuzio de Naray, R., Arsenault, C. A., Spekkens, K., et al. 2012, MNRAS, 427, 2523
- Lee et al. (2014) Lee, C., Chung, A., Yun, M. S., et al. 2014, MNRAS, 441, 1363
- Lelli et al. (2010) Lelli, F., Fraternali, F., & Sancisi, R. 2010, A&A, 516, A11
- Lemonias et al. (2014) Lemonias, J. J., Schiminovich, D., Catinella, B., Heckman, T. M., & Moran, S. M. 2014, ApJ, 790, 27
- Leroy et al. (2008) Leroy, A. K., Walter, F., Brinks, E., et al. 2008, AJ, 136, 2782
- Lucy (1974) Lucy, L. B. 1974, AJ, 79, 745
- Macciò et al. (2007) Macciò, A. V., Dutton, A. A., van den Bosch, F. C., et al. 2007, MNRAS, 378, 55
- Marinacci et al. (2010) Marinacci, F., Binney, J., Fraternali, F., et al. 2010, MNRAS, 404, 1464
- Martin & Kennicutt (2001) Martin, C. L., & Kennicutt, R. C., Jr. 2001, ApJ, 555, 301
- Martin et al. (2010) Martin, A. M., Papastergis, E., Giovanelli, R., et al. 2010, ApJ, 723, 1359
- McGaugh & de Blok (1998) McGaugh, S. S., & de Blok, W. J. G. 1998, ApJ, 499, 41
- Meidt et al. (2012) Meidt, S. E., Schinnerer, E., Knapen, J. H., et al. 2012, ApJ, 744, 17
- Mo et al. (1998) Mo, H. J., Mao, S., & White, S. D. M. 1998, MNRAS, 295, 319
- Moore (1994) Moore, B. 1994, Nature, 370, 629
- Navarro et al. (1997) Navarro, J. F., Frenk, C. S., & White, S. D. M. 1997, ApJ, 490, 493
- Neto et al. (2007) Neto, A. F., Gao, L., Bett, P., et al. 2007, MNRAS, 381, 1450
- Nilson (1973) Nilson, P. 1973, Acta Universitatis Upsaliensis. Nova Acta Regiae Societatis Scientiarum Upsaliensis - Uppsala Astronomiska Observatoriums Annaler, Uppsala: Astronomiska Observatorium, 1973,
- Oppenheimer et al. (2010) Oppenheimer, B. D., Davé, R., Kereš, D., et al. 2010, MNRAS, 406, 2325
- Papastergis et al. (2012) Papastergis, E., Cattaneo, A., Huang, S., Giovanelli, R., & Haynes, M. P. 2012, ApJ, 759, 138
- Peebles (1971) Peebles, P. J. E. 1971, A&A, 11, 377
- Querejeta et al. (2014) Querejeta, M., Meidt, S. E., Schinnerer, E., et al. 2014, arXiv:1410.0009
- Rafikov (2001) Rafikov, R. R. 2001, MNRAS, 323, 445
- Rich et al. (2008) Rich, J. W., de Blok, W. J. G., Cornwell, T. J., et al. 2008, AJ, 136, 2897
- Romeo & Falstad (2013) Romeo, A. B., & Falstad, N. 2013, MNRAS, 1482
- Romeo & Wiegert (2011) Romeo, A. B., & Wiegert, J. 2011, MNRAS, 416, 1191
- Saintonge et al. (2011) Saintonge, A., Kauffmann, G., Kramer, C., et al. 2011, MNRAS, 415, 32
- Saintonge et al. (2011) Saintonge, A., Kauffmann, G., Wang, J., et al. 2011, MNRAS, 415, 61
- Salim et al. (2007) Salim, S., Rich, R. M., Charlot, S., et al. 2007, ApJS, 173, 267
- Sancisi (1976) Sancisi, R. 1976, A&A, 53, 159
- Sancisi & Allen (1979) Sancisi, R., & Allen, R. J. 1979, A&A, 74, 73
- Sancisi et al. (2008) Sancisi, R., Fraternali, F., Oosterloo, T., & van der Hulst, T. 2008, A&A Rev., 15, 189
- Sandstrom et al. (2013) Sandstrom, K. M., Leroy, A. K., Walter, F., et al. 2013, ApJ, 777, 5
- Schaye (2004) Schaye, J. 2004, ApJ, 609, 667
- Schiminovich et al. (2007) Schiminovich, D., Wyder, T. K., Martin, D. C., et al. 2007, ApJS, 173, 315
- Schiminovich et al. (2010) Schiminovich, D., Catinella, B., Kauffmann, G., et al. 2010, MNRAS, 408, 919
- Schoenmakers et al. (1997) Schoenmakers, R. H. M., Franx, M., & de Zeeuw, P. T. 1997, MNRAS, 292, 349
- Sellwood & Sánchez (2010) Sellwood, J. A., & Sánchez, R. Z. 2010, MNRAS, 404, 1733
- Shaw et al. (2006) Shaw, L. D., Weller, J., Ostriker, J. P., & Bode, P. 2006, ApJ, 646, 815
- Shen & Sellwood (2006) Shen, J., & Sellwood, J. A. 2006, MNRAS, 370, 2
- Sheth et al. (2010) Sheth, K., Regan, M., Hinz, J. L., et al. 2010, PASP, 122, 1397
- Sofue & Rubin (2001) Sofue, Y., & Rubin, V. 2001, ARA&A, 39, 137
- Solomon et al. (1997) Solomon, P. M., Downes, D., Radford, S. J. E., & Barrett, J. W. 1997, ApJ, 478, 144
- Spekkens & Sellwood (2007) Spekkens, K., & Sellwood, J. A. 2007, ApJ, 664, 204
- Springob et al. (2005) Springob, C. M., Haynes, M. P., Giovanelli, R., & Kent, B. R. 2005, ApJS, 160, 149
- Strong & Mattox (1996) Strong, A. W., & Mattox, J. R. 1996, A&A, 308, L21
- Toomre (1964) Toomre, A. 1964, ApJ, 139, 1217
- Trachternach et al. (2008) Trachternach, C., de Blok, W. J. G., Walter, F., Brinks, E., & Kennicutt, R. C., Jr. 2008, AJ, 136, 2720
- van der Kruit & Freeman (2011) van der Kruit, P. C., & Freeman, K. C. 2011, ARA&A, 49, 301
- Walter et al. (2008) Walter, F., Brinks, E., de Blok, W. J. G., et al. 2008, AJ, 136, 2563
- Wang & Silk (1994) Wang, B., & Silk, J. 1994, ApJ, 427, 759
- Wang et al. (2013) Wang, J., Kauffmann, G., Józsa, G. I. G., et al. 2013, arXiv:1303.3538
- Wang et al. (2016) Wang, J., Koribalski, B. S., Serra, P., et al. 2016, MNRAS, 460, 2143
- Warmels (1988) Warmels, R. H. 1988, A&AS, 72, 19
- Werner et al. (2004) Werner, M. W., Roellig, T. L., Low, F. J., et al. 2004, ApJS, 154, 1
- White & Frenk (1991) White, S. D. M., & Frenk, C. S. 1991, ApJ, 379, 52
- Wilson (1995) Wilson, C. D. 1995, ApJ, 448, L97
- Wilson et al. (2011) Wilson, C. D., Warren, B. E., Irwin, J., et al. 2011, MNRAS, 410, 1409
- Zhang et al. (2009) Zhang, W., Li, C., Kauffmann, G., et al. 2009, MNRAS, 397, 1243
- Zwaan et al. (2005) Zwaan, M. A., Meyer, M. J., Staveley-Smith, L., & Webster, R. L. 2005, MNRAS, 359, L30