WIYN Open Cluster Study. LXXII. A H CCD Analysis of the Metal-Deficient Open Cluster, NGC 2506
Abstract
Precision H photometry of the metal-deficient, old open cluster, NGC 2506, is presented. The survey covers an area and extends to for and H and to for and . For brighter than 16.0, photometric scatter among the indices leads to the recovery of 6 known variables within the cluster core and 5 new variables in the outer of the survey field. Proper motions, radial velocities, and precise multicolor indices are used to isolate a highly probable sample of cluster members from the very rich color-magnitude diagram (CMD). From 257 highly probable members at the cluster turnoff, we derive a reddening estimate of (), where the errors refer to the internal standard errors of the mean. [Fe/H] is derived from the A/F dwarf members using both and , leading to [Fe/H] (sem) and (sem), respectively. The weighted average, heavily dominated by , is [Fe/H] . Based upon red giant members, we place an upper limit of on the variation in the reddening across the face of the cluster. We also identify two dozen potential red giant cluster members outside the cluster core. Victoria-Regina isochrones on the Strömgren system produce an excellent match to the cluster for an apparent modulus of and an age of Gyr.
1 Introduction
NGC 2506 is an older open cluster which has long been grouped within the iconic class of metal-deficient clusters populating the galactic anticenter just beyond the solar circle, as exemplified by NGC 2204, NGC 2243, NGC 2420, and Mel 66. A review of the literature on these objects reveals an ongoing debate on just how old and how metal-deficient the individual members of the class are, with clusters like NGC 2243 retaining consistently low metallicity ([Fe/H] ) as determined by photometry (Twarog, Ashman, & Anthony-Twarog, 1997; Anthony-Twarog, Atwell, & Twarog, 2005), medium-resolution spectroscopy (Friel et al., 2002), and high-resolution spectroscopy (Jacobson, Friel, & Pilachowski, 2011; Francois et al., 2013), while others like NGC 2420 generate [Fe/H] from to nearly solar, depending upon the technique adopted (Twarog, Ashman, & Anthony-Twarog, 1997; Friel et al., 2002; Anthony-Twarog et al., 2006; Pancino et al., 2010; Jacobson, Pilachowski, & Friel, 2011). The latter example is particularly relevant because, since the first comprehensive, complementary photometric (McClure, Twarog, & Forrester, 1981) and astrometric (Chiu & van Altena, 1981) studies of NGC 2506, the color-magnitude diagram (CMD) of NGC 2506 has exhibited features similar, though not identical, to those of NGC 2420. Equally important, most recent moderate and high-dispersion spectroscopic work on a handful of giants has consistently shown that the cluster is more metal-poor than NGC 2420, with [Fe/H] or less (Carretta et al,, 2004; Mikolaitis et al., 2011; Reddy, Giridhar, & Lambert, 2012), in agreement with earlier analyses (Twarog, Ashman, & Anthony-Twarog, 1997; Friel et al., 2002). As stellar isochrones and their calibration to standard photometric systems have improved over the last 30 years, the estimated age of NGC 2506 has declined steadily from greater than 3 Gyr, similar to M67, to less than 2 Gyr (McClure, Twarog, & Forrester, 1981; Janes & Phelps, 1994; Carraro & Chiosi, 1994; Marconi et al., 1997; Twarog, Anthony-Twarog, & Bricker, 1999; Salaris, Weiss, & Percival, 2004; Netopil et al., 2016), making it comparable instead to NGC 3680, IC 4651, (Anthony-Twarog et al., 2009) and NGC 752 (Twarog et al., 2015).
The lower metallicity compared to NGC 752, NGC 3680, and especially IC 4651, in conjunction with the reduced age, makes NGC 2506 a key data point in delineating the roles of both parameters on the evolution of mixing/convection among stars from the main sequence through the giant branch, as well as the collateral impact on the atmospheric Li abundance. With astrometric membership (Chiu & van Altena, 1981) extending at least three magnitudes below the level of a turnoff located only 0.5 mag fainter than that of NGC 2420, NGC 2506 became an obvious choice for inclusion in an analysis of Li in stars from the tip of the giant branch to the level of the main sequence Li-dip in clusters covering a range in age and metallicity. Details on the scope of the project can be found in a number of papers discussing earlier results on the clusters NGC 3680 (Anthony-Twarog et al., 2009), NGC 6253 (Anthony-Twarog et al., 2010; Cummings et al., 2012), NGC 752 (Maderak et al., 2013; Twarog et al., 2015), and NGC 6819 (Anthony-Twarog et al., 2014; Deliyannis et al., 2016) and will not be repeated. Suffice it to say that in any spectroscopic analysis, the validity of both star-to-star and cluster-to-cluster comparisons is ultimately tied to the consistency of the stellar parameters adopted in analyzing the spectra. This makes precise knowledge of the cluster reddening, stellar mass as defined by the cluster age and distance modulus, and an estimate of the cluster metallicity through photometry and spectroscopy critical to any evaluation of Li from the main sequence through the giant branch.
The purposes of this paper are to present estimates of the reddening and metallicity of NGC 2506 using precision CCD photometry on the extended Strömgren (H) system, to identify probable members from a region beyond the original astrometric survey of Chiu & van Altena (1981), and to derive an age and distance for the cluster through comparison with state-of-the-art isochrones on the Strömgren system. These data will serve as the basis for our spectroscopic analysis of the cluster from Hydra spectroscopy extending from the giant branch to almost two magnitudes below the level of the turnoff.
The outline of the paper is as follows: Sec. 2 discusses the CCD observations and their reduction to the standard system for intermediate-band photometry; Sec. 3 uses the photometry, in conjunction with proper-motion membership, to identify and isolate probable cluster members which become the core data set for selecting single, main sequence stars for reddening, metallicity, age, and distance estimates in Sec. 4. Sec. 5 contains a summary of our conclusions.
2 Observations and Data Reduction
2.1 Observations
NGC 2506 was observed using the 1.0 meter telescope operated by the SMARTS111http://www.astro.yale.edu/smarts consortium at Cerro Tololo InterAmerican Observatory over the UT dates 16 - 22 December, 2011. The telescope was equipped with a STA CCD camera222http://www.astronomy.ohio-state.edu/Y4KCam/detector yielding a field of view 20′ on a side at the Cassegrain focus of the 1.0m telescope. Filters owned by the University of Kansas were used to obtain images in each of the extended Strömgren system bandpasses ( as well as the two H bandpasses). With the exception of 20/21 December, 2011, all of the nights were photometric.
Images of NGC 2506 were obtained every night with a subset of the seven filters. On three nights, frames to construct , , and H were obtained; two nights were devoted to obtaining frames from which standard Strömgren indices could be constructed, with an additional two nights used to obtain and frames. In all, over 90 images of NGC 2506 were obtained in the course of the run, with total exposure times in minutes as follows: (19) (25) (57) (193) wide (26) narrow (97) (116). Field stars and clusters were observed at differing airmass to obtain extinction coefficients for all but the first night of the run.
Field star standards were observed on every photometric night, drawing from the catalogs of Olsen (1983, 1993, 1994) for Strömgren and H standards, using Hauck & Mermilliod (1998) for additional H standard values. The catalog of Twarog & Anthony-Twarog (1995) was the principal source for standards. Additional observations were obtained in several open clusters used as secondary standards, including M67 (Nissen et al., 1987), NGC 2516 (Snowden, 1975) and NGC 2287 (Schmidt, 1984). In general, the secondary standard cluster fields would be used to delineate the slopes and color terms for the calibration equations, relying on the field star standards to set calibration equation zero-points for each photometric night.
| Index | aaNumber of photometric nights on which standards were observed for this index. | bbRange of number of field star standards observed for this index each photometric night. | |||
|---|---|---|---|---|---|
| 1.000 | 0.06 | 6 | 7-12 | 0.021 | |
| 1.013 | 6 | 5-10 | 0.009 | ||
| 0.93 | 4 | 1-4 | 0.018 | ||
| 1.06 | 4 | 7-8 | 0.019 | ||
| 1.09 | 3 | 2-3 | 0.023 | ||
| 0.923 | -0.046 | 3 | 2-4 | 0.071 | |
| 0.854 | 0.056 | 3 | 2-4 | 0.063 | |
| 1.010 | 0.04 | 3 | 3-7 | 0.082 | |
| 1.060 | 0.12 | 3 | 3-7 | 0.070 | |
Note. — For each index , the calibrated value is
Bias frames were obtained before every night’s observations. Flat field correction was accomplished using a master set of sky flats assembled over the course of the entire run. Basic processing steps (bias subtraction and flat-field correction) were completed in IRAF, using the y4k scripts developed and described by Phil Massey333http://www2.lowell.edu/users/massey/obins/y4kcamred.html. DAOPHOT routines within the IRAF suite were used to obtain psf-based indices for every star on every NGC 2506 frame; our procedures for measuring and merging high-precision psf-based magnitudes and indices are fully described in Anthony-Twarog & Twarog (2000).
If internal standards are not available, final calibration of this precise set of magnitudes and indices must be anchored to airmass-corrected flux-based magnitudes of field star and cluster standards. To accommodate seeing variations, every aperture measurement used for calibration purposes is determined within an aperture radius set to five times the full width half maximum of the stars on that frame. Similar measurements were obtained for a subset of the less crowded stars in NGC 2506 for each night, to facilitate the determination of aperture corrections.
Using common slopes for each index, separate calibration equation zero-points may be determined for each relevant index for each photometric night. Slope and color terms used for the calibration equations are summarized in Table 1. Figure 1 illustrates the internal precision obtained in each index as a function of magnitude.

Table 1 includes distinct calibration equations for some indices and stellar classes. It was possible to determine a separate calibration equation for the colors of cooler dwarfs, distinguishable from the calibration equation used for dwarfs bluer than and red giants, even though our photometry in NGC 2506 doesn’t really go deep enough for stars in this calibration class to be likely cluster members. More critical is the separation of calibration equations for and for bluer, unevolved stars as opposed to cool giants and subgiants. Aside from the challenge of determining these separate calibration equation segments, it is necessary to have some means of determining from uncalibrated photometry, to which class a star belongs. Color alone adequately distinguishes blue dwarfs from red stars; separating redder evolved and unevolved stars is possible in the plane as illustrated in Twarog et al. (2015) for the case of NGC 752.
Table 2 describes calibrated photometry for 2229 stars; the typeset version of the table includes enough lines to show the form and content of the larger table. Stars with index values set to 9.999 fail to meet a criterion requiring at least two observations in every relevant filter. Because of the rapid increase in errors at fainter magnitudes, the Table has been restricted to stars with 18.0. The Table includes X,Y pixel coordinates on the WEBDA system, RA(2000) and DEC(2000), followed by WEBDA ID and membership probability from Chiu & van Altena (1981), if available. The photometry sequence is , , , , , and H, followed by the calibration classification B for blue dwarf, G for cool giant and D for cool dwarf. Finally, the standard errors of the mean are presented for each index using the same sequence as the photometry, followed by the number of measures of the star in each filter.
| WEBDA | Membership | H | Class | ||||||||||||||||||||||
|---|---|---|---|---|---|---|---|---|---|---|---|---|---|---|---|---|---|---|---|---|---|---|---|---|---|
| 434.07 | -98.74 | 120.124924 | -10.799914 | 10.761 | 1.221 | 0.544 | 0.162 | 1.581 | 2.686 | 0.005 | 0.007 | 0.010 | 0.010 | 0.009 | 0.009 | G | 20 | 14 | 9 | 14 | 14 | 8 | 7 | ||
| 48.67 | 522.25 | 120.021011 | -10.630401 | 10.883 | 1.041 | 0.806 | -0.139 | 1.712 | 2.573 | 0.002 | 0.004 | 0.008 | 0.012 | 0.006 | 0.005 | G | 22 | 14 | 9 | 14 | 14 | 8 | 7 | ||
| -68.00 | -242.94 | 119.988548 | -10.836110 | 3316 | 0.30 | 10.914 | 0.855 | 0.744 | 0.174 | 1.666 | 2.568 | 0.001 | 0.001 | 0.003 | 0.004 | 0.002 | 0.002 | G | 22 | 14 | 9 | 14 | 14 | 8 | 7 |
| -78.55 | -25.95 | 119.985916 | -10.777542 | 3147 | 10.931 | 0.164 | 0.206 | 0.809 | 0.433 | 2.799 | 0.002 | 0.003 | 0.003 | 0.003 | 0.004 | 0.004 | B | 22 | 14 | 9 | 14 | 14 | 8 | 7 | |
| 249.39 | -190.99 | 120.074715 | -10.823801 | 11.075 | 1.012 | 0.867 | -0.034 | 1.937 | 2.571 | 0.001 | 0.002 | 0.004 | 0.007 | 0.005 | 0.004 | G | 22 | 14 | 9 | 14 | 14 | 8 | 7 | ||
| -104.31 | -51.21 | 119.978897 | -10.784216 | 3254 | 0.20 | 11.109 | 0.886 | 0.700 | 0.080 | 1.599 | 2.569 | 0.001 | 0.002 | 0.003 | 0.004 | 0.004 | 0.003 | G | 22 | 14 | 9 | 14 | 14 | 8 | 7 |
| 242.51 | 112.14 | 120.073174 | -10.742024 | 1375 | 0.00 | 11.252 | 0.168 | 0.148 | 0.831 | 0.293 | 2.779 | 0.001 | 0.002 | 0.003 | 0.002 | 0.003 | 0.004 | B | 23 | 14 | 9 | 14 | 14 | 8 | 7 |
| -148.05 | 437.80 | 119.967545 | -10.652119 | 11.373 | 0.294 | 0.133 | 0.572 | 0.403 | 2.675 | 0.001 | 0.002 | 0.003 | 0.004 | 0.003 | 0.004 | B | 23 | 14 | 9 | 14 | 14 | 8 | 7 | ||
| -359.63 | 77.53 | 119.909760 | -10.748134 | 11.596 | 0.571 | 0.387 | 0.340 | 1.015 | 2.574 | 0.000 | 0.002 | 0.004 | 0.005 | 0.004 | 0.004 | D | 23 | 14 | 9 | 14 | 14 | 8 | 8 | ||
| 59.61 | -29.52 | 120.023399 | -10.779244 | 2111 | 0.00 | 11.589 | 0.366 | 0.190 | 0.380 | 0.610 | 2.647 | 0.002 | 0.003 | 0.005 | 0.004 | 0.004 | 0.005 | B | 22 | 14 | 9 | 14 | 14 | 8 | 7 |
| -381.50 | -154.26 | 119.903580 | -10.810519 | 11.604 | 0.563 | 0.312 | 0.432 | 0.953 | 2.578 | 0.002 | 0.002 | 0.003 | 0.002 | 0.004 | 0.003 | G | 23 | 13 | 9 | 14 | 14 | 6 | 6 | ||
| 61.83 | -60.66 | 120.023964 | -10.787653 | 2122 | 0.92 | 11.726 | 0.693 | 0.409 | 0.461 | 1.211 | 2.571 | 0.001 | 0.002 | 0.004 | 0.005 | 0.004 | 0.002 | G | 23 | 14 | 9 | 14 | 14 | 8 | 8 |
| -462.34 | -448.46 | 119.881340 | -10.889418 | 11.745 | 0.600 | 0.333 | 0.432 | 1.003 | 2.574 | 0.002 | 0.002 | 0.002 | 0.004 | 0.004 | 0.006 | G | 23 | 14 | 9 | 14 | 14 | 7 | 8 | ||
| 637.47 | 359.90 | 120.180595 | -10.677331 | 11.837 | 0.753 | 0.480 | 0.480 | 1.301 | 2.588 | 0.003 | 0.004 | 0.006 | 0.006 | 0.008 | 0.006 | G | 19 | 11 | 9 | 14 | 10 | 5 | 5 | ||
| -148.96 | -453.43 | 119.966362 | -10.892436 | 11.818 | 0.361 | 0.114 | 0.364 | 0.455 | 2.628 | 0.002 | 0.003 | 0.005 | 0.006 | 0.005 | 0.005 | B | 23 | 14 | 9 | 14 | 14 | 8 | 8 | ||
| -91.78 | 317.66 | 119.982689 | -10.684816 | 4401 | 11.840 | 0.405 | 0.197 | 0.376 | 0.670 | 2.620 | 0.001 | 0.001 | 0.003 | 0.005 | 0.003 | 0.004 | B | 23 | 14 | 9 | 14 | 14 | 8 | 8 | |
| -307.53 | 637.53 | 119.924484 | -10.597408 | 11.870 | 0.235 | 0.085 | 1.210 | 9.999 | 9.509 | 0.004 | 0.005 | 0.009 | 0.010 | 9.999 | 9.999 | B | 3 | 2 | 3 | 5 | 0 | 0 | 0 | ||
| 216.58 | 79.61 | 120.066101 | -10.750658 | 1380 | 0.00 | 11.900 | 0.358 | 0.174 | 0.450 | 0.589 | 2.639 | 0.001 | 0.002 | 0.003 | 0.004 | 0.003 | 0.003 | B | 23 | 14 | 9 | 14 | 14 | 8 | 8 |
| 74.87 | 6.81 | 120.027573 | -10.769529 | 2101 | 0.00 | 11.957 | 0.563 | 0.236 | 0.433 | 0.863 | 2.573 | 0.002 | 0.003 | 0.004 | 0.004 | 0.004 | 0.002 | G | 23 | 14 | 9 | 14 | 14 | 8 | 8 |
| 155.81 | 172.77 | 120.049713 | -10.725212 | 1349 | 0.00 | 11.942 | 0.307 | 0.150 | 0.419 | 0.464 | 2.665 | 0.002 | 0.003 | 0.003 | 0.003 | 0.004 | 0.005 | B | 23 | 14 | 9 | 14 | 14 | 8 | 8 |
With a final calibration in hand, it is possible to compare our data with published photometry in the cluster. For , we have matched our survey with the CCD photometry of Marconi et al. (1997); Kim et al. (2001). Lee, Kang, & Ann (2012) have done a large-area survey of NGC 2506 down to 23.5 which encompasses our entire sample. While the data have been used to map the structure and luminosity function of the cluster (Lee, Kang, & Ann, 2013), it has never been published.
Using the WEBDA X,Y positions, we were able to cross-identify 576 stars in common with Marconi et al. (1997) to = 18.0. The distribution in residuals, in the sense (Table 2 - MA97), showed no trends with or , with virtually all the stars having residual differences less than 0.10 mag. If we exclude the 11 stars with absolute residuals greater than 0.10 mag, the average residual for the remaining 565 stars is 0.016 0.028. Of the 11 deviants, three (5193, 5014, 2221) show larger than average scatter in their indices for their magnitude and are likely suffering from PSF distortions due to contamination by a nearby image. Star 5070 also has a very discrepant color compared to that expected from the published and is a probable mismatch to the original survey. The remaining 7 discrepant stars are: 5233, 2121, 5312, 3147, 4238, 5176, and 2302.
The comparison with the photometry of Kim et al. (2001) also revealed no statistically significant trends with magnitude or color, but clearly suffered from larger photometric scatter than that of Marconi et al. (1997). The initial match of 536 stars brighter than = 18 produced absolute residuals which were predominantly less than 0.20 mag. If all stars with differences greater than this value are excluded, the remaining 515 stars show a mean offset of 0.017 0.059, placing the Kim et al. (2001) on the same system as Marconi et al. (1997). Because of the significantly larger scatter in the comparison with Kim et al. (2001), we will not list the discrepant stars.
Only one source of published photometry is available for comparison. Arentoft et al. (2007) make use of an unpublished CCD survey covering an area approximately to study and analyze variable stars within NGC 2506, mostly Scuti and Doradus variables, as well as a few eclipsing binaries. While their survey is contained within the area of the current investigation and extends to , indices are only published for the 28 variable candidates in the NGC 2506 field. Keeping in mind that all the stars under discussion are variables, comparison of their Strömgren indices for 25 stars brighter than to ours leads to average differences, in the sense (Table 2 - AR07), and standard deviations for a single measurement for , , and are as follows: and . For two stars in Table 1, and values are absent, so information is based on only 23 stars for those indices. The agreement in zero-point and the small scatter among the residuals are very encouraging and indicates that a more extensive comparison would show that the color indices of both samples are on the same system to within 0.01 mag.
2.2 Variable Stars
The hunt for variable stars in NGC 2506 using modern detectors begins with Kaluzny & Shara (1988), who searched for long-period eclipsing binaries within 6 overlapping fields covering a region of , down to . Not surprisingly, with only a few hours of observations, no eclipses were detected. As the field size and observing length have expanded with each subsequent study, the number and types of variables have grown accordingly. Kim et al. (2001) surveyed a single field , discovering four variables - one eclipsing binary and three Scuti variables. The latter variables were of particular interest because the blue straggler population and the top of the CMD turnoff of NGC 2506 sit within the predicted instability strip for this class of stars. Unexpectedly, comparable observations of NGC 2420 led to no variables, despite the similarity of the two clusters and a high estimated incidence of binaries, higher than in NGC 2506.
The most comprehensive survey to date is that of Arentoft et al. (2007), covering a field with high precision and 160 hours of observations each in and . The study identified 28 variables in the cluster field, doubling the number of oscillating blue stragglers from 3 to 6 and the number of eclipsing variables from 1 to 2. More important, the analysis identified 15 Dor variables within the red hook of the turnoff of the CMD, in excellent agreement with the predicted location from field stars of the same class (Handler & Shobbrook, 2002). The value of the detected variables lies in the fundamental stellar parameters they can supply through light curve analysis of the eclipsing variables and structural insights from asteroseismology of the single-star variables.
While our CCD cluster frames have not been collected with a variable star search in mind, the relatively high precision of the final photometry leaves open the possibility of identifying larger amplitude and/or longer period systems through excessive dispersions among the indices or discrepant residuals in comparison with previous photometry. Building upon the first approach, all stars with and a standard error of the mean in which implied larger than typical scatter at a given (see Fig. 1) were identified. Stars with a reduced number of frames contributing to the index were eliminated since this indicated that the star was near the edge of the CCD field or suffered severe contamination from a nearby object. Stars which showed significant scatter in only one filter but not both were removed, as were stars which showed normal errors in filters other than and , particularly H. This left a sample of 25 potential variables. Each star was then checked visually on a high quality frame, after which 14 stars were excluded due to asymmetric PSF’s, implying contamination by an optical companion. Of the 11 remaining stars, 6 lie within the area surveyed by Arentoft et al. (2007) and all 6 are known variables: V2, V3, V4, V9, V16, and V26. The list includes two oscillating blue stragglers, 3 eclipsing binaries, and 1 Dor variable. Given the success of the approach in identifying true variables within the well-studied cluster core, it is likely that the variables in the outer regions, members or not, are eclipsing binaries or stars within the main sequence instability strips. These stars are tagged within Table 2 by a V designation after the calibration class, i.e. GV or BV.
3 The Color-Magnitude Diagram
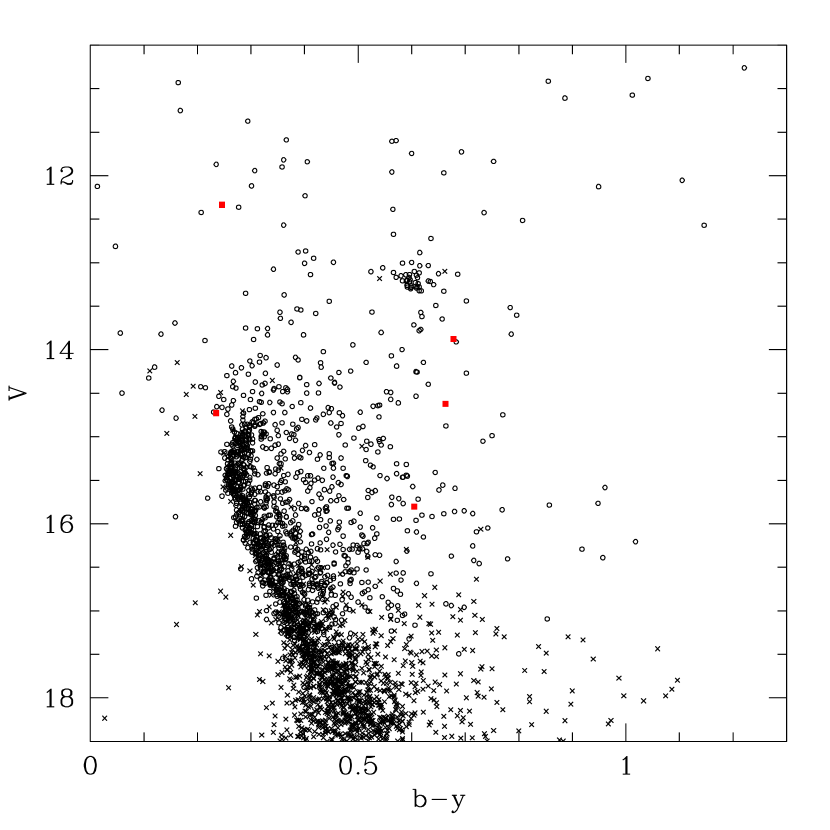
The CMD based upon () for all stars in Table 2 is shown in Fig. 2. Stars for which the internal errors in are below 0.015 mag are plotted as open circles. The five potential new variables are shown only in this figure as filled red squares because they lie outside the cluster core and will not be discussed in later analyses. The blue edge of the main sequence CMD is well defined to 17.5, where increasing photometric scatter and the field star population with begin to dominate. The lack of scatter blueward of the main sequence is expected despite a distance of 3 kpc for the cluster due to a galactic latitude near °, coupled with a low line-of-sight reddening. The majority of contamination will come from foreground stars with only slightly smaller reddening than the cluster. On the giant branch, with the exception of the obvious red clump, the separation of cluster members from the field is a challenge, particularly within the scatter of redder stars brighter than the clump.
As a first step toward isolating the cluster from the field, we restrict the sample to the cluster core. Using wide-field photometry (Lee, Kang, & Ann, 2012) on the system, Lee, Kang, & Ann (2013) mapped the radial distribution of stars in NGC 2506, finding that the core radius varied as a function of the luminosity of the sample studied, ranging from 2.0′ for the brighter stars to 6′ for the lowest mass sample. For the entire dataset brighter than , they found a core radius of 4′, which we will adopt for our core selection, shown in Fig. 3, where symbols have the same meaning as in Fig. 2. The improvement is striking. While the unevolved main sequence is again obvious, the rich sample of stars above the turnoff between and 14.7 is almost certainly populated by binaries and a small sample of single stars evolving from the red hook to the subgiant branch. The scatter of stars redward of the main sequence is severely reduced and most of the scatter lies within 0.75 mag of the main sequence, implying a pattern defined by binaries. The subgiant branch is sparsely populated, but the path of the first-ascent red giants starting at the base near is discernible. Equally important, the majority of the red giants above the clump are gone, an indication that most are likely non-members.

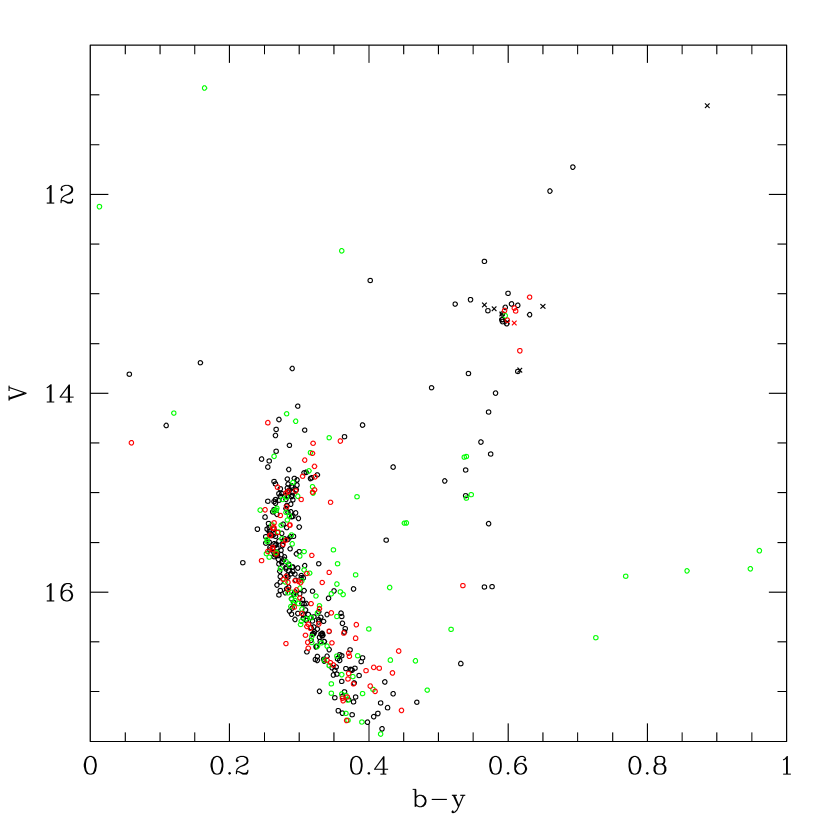
The dataset of Fig. 3 would be a solid starting point for analysis of the cluster parameters if no additional information were available. However, NGC 2506 has been the subject of a proper-motion analysis (Chiu & van Altena, 1981) and 34 red giants in the cluster field have been surveyed for radial-velocity variations (Mermilliod & Mayor, 2007; Mermilliod, Mayor, & Udry, 2008). We can therefore expand the probable cluster sample beyond the core, eliminate likely non-members throughout the CCD field, and cross-check the proper-motion membership for the giants against the radial-velocity predictions. The result of this more complicated approach is shown in Fig. 4 where only stars with errors in 0.015 have been retained. Note the reduction in the and range for the figure. Black symbols denote stars within the cluster core with membership probabilities above 50%, while red symbols show stars that meet the same criterion but which fall outside the core. Green symbols are stars within the core for which no proper-motion data are available, and crosses, red or black, are red giants with radial velocities consistent with the very high cluster value but non-zero proper-motion probabilities below 50%. As expected, the green points are responsible for the majority of the deviant points fainter than the subgiant branch, but the cluster members fall consistently within the band defined by the main sequence and the brighter limit of the binary sequence.
4 Reddening and Metallicity
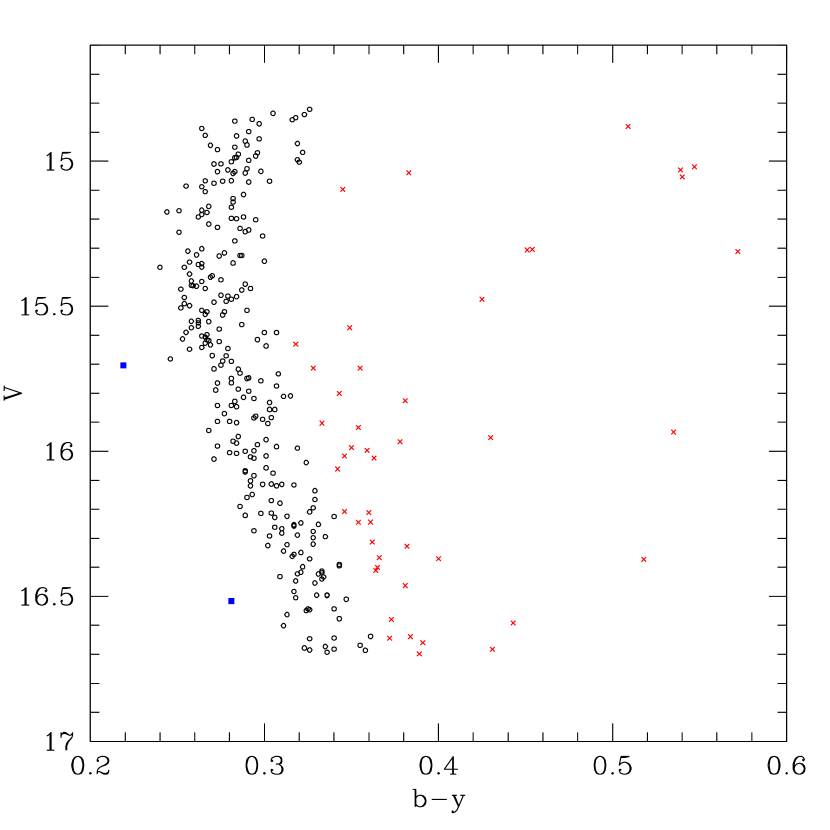
With a base of probable cluster members with high-precision photometry in hand, we shift our focus to the stars at the cluster turnoff where the color range is optimally suited for analysis on the extended Strömgren system. To reduce any potential distortions caused by evolution well off of the main sequence and contamination by highly probable binaries which populate the vertical band of stars above the turnoff between = 13.75 and 14.75, we eliminate any stars brighter than = 14.8. We then eliminate all stars which have photometric errors in , , , and H greater than 0.020, 0.030, 0.020, and 0.015 mag, respectively. This imposes an effective cutoff on the sample near = 16.70. Finally, we narrow the color range to stars with between 0.20 and 0.60, leaving a sample of 332 stars, plotted in Fig. 5. While some stars scatter well to the red of the main sequence because they are either field stars or giants near the base of the giant branch, the dominant scatter appears to be caused by the cluster binary sequence extending parallel to but brighter than the normal turnoff. Given the relatively high precision of the indices, we can eliminate a large fraction of these stars by tagging any stars which lie off the mean relation by more than 0.035 mag. Stars plotted as red crosses in Fig. 5 have been tagged as meeting this criterion. A pair of stars which lie blueward of the mean relation are plotted as blue squares. Note that the number of red points effectively disappears near the turnoff above = 15.6; the binary sequence should merge with the single-star sequence near this region of the CMD, making identification of the binaries impossible using this simple technique.
We now turn to the CMD as a test of our sample selection and as a means to eliminate additional non-members. The use of is valuable for three reasons. First, for a fixed metallicity, is much more sensitive to temperature changes than for mid-F stars and cooler. Stars which are truly cooler at a given compared to the mean cluster relation, either because they are binaries shifted vertically relative to single stars in the CMD or field stars, will exhibit a measurable shift in . Second, is one-sixth as sensitive to reddening as and shifts the star to bluer/smaller values. Stars which are unusually reddened in the CMD will remain virtually unchanged or appear bluer in the diagram. Third, of special importance to NGC 2506 where the turnoff stars are late A/early F spectral types with very similar indices over a range in , is extremely sensitive to small changes in metallicity. NGC 2506 is predicted to be metal-deficient by 0.2 to 0.3 dex relative to the sun. If the foreground field stars along the line of sight are typical of the solar neighborhood, they should easily separate from the cluster sample by an amount which is three to five times larger than the photometric errors.
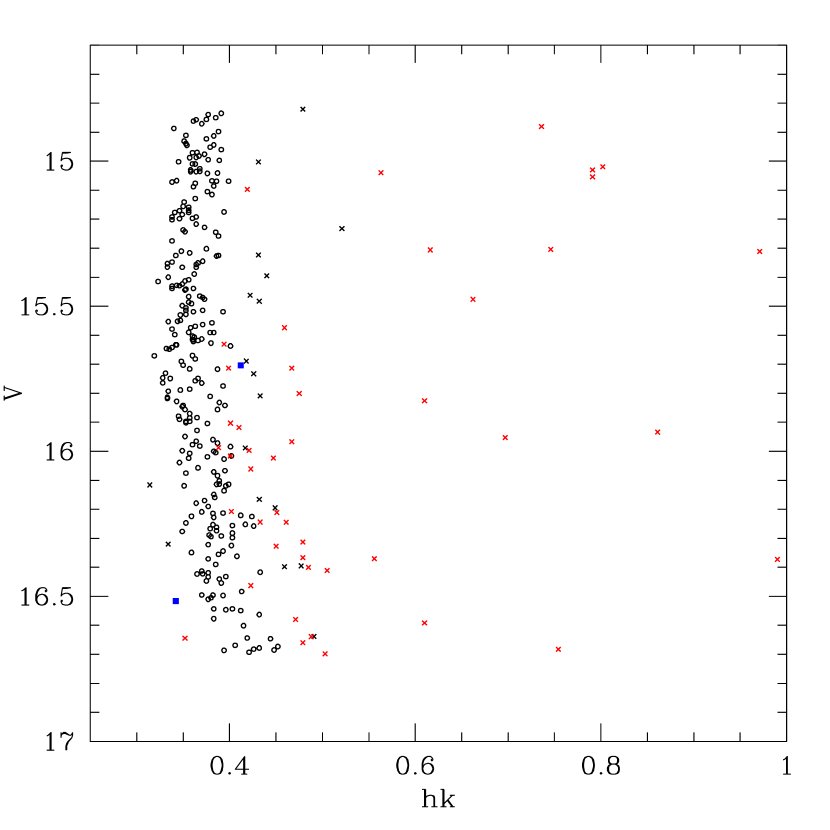
Fig. 6 shows the CMD with the same symbols as Fig. 5, plus one additional class. Black crosses are stars which deviate significantly from the cluster sequence in at a given magnitude which were not tagged in Fig. 5. The almost vertical band defined by the hot stars at the turnoff of NGC 2506 is readily apparent, with a scatter at a fixed consistent with the restricted photometric error limits attached to the sample selection. As hoped, the general pattern is that the stars which lie redward of the cluster sequence in Fig. 5 (red crosses) reproduce a similar trend in Fig. 6. There are, however, 18 stars which were not identified as being deviant in Fig. 5 which appear to be so in Fig. 6; the majority of these are possible binaries or, more likely, field stars which have significantly higher [Fe/H] than the cluster but happen to superpose on the cluster CMD due to a difference in absolute magnitude. It should be noted that for a metal-deficient cluster, a similar selection criterion could be built upon the index, with metal-rich field stars having a larger value at a given . For comparable photometric precision, however, the expected change in would be 3-4 times smaller, making it difficult to distinguish between the impact of metallicity and photometric errors.
With all stars plotted as crosses in Fig. 6 eliminated, the photometric reddening and metallicity can be derived. For details on the approach, the reader is referred to a subset of the several past investigations where it has been applied (Anthony-Twarog et al., 2014; Twarog et al., 2015; Sales Silva et al., 2016). The simultaneous solution for [Fe/H] and based upon and H for 257 stars is (sem) and (sem) (, respectively, independent of the standard relation adopted for the Strömgren indices (Olsen, 1988; Nissen, 1988). With the reddening set, the metallicity based upon , H is [Fe/H] (sem). For a change in of (), [Fe/H]m1 changes by while [Fe/H]hk changes by only dex. For an uncertainty of in the zero-points of the and indices, the changes in [Fe/H] are and , respectively. The weighted mean of the two abundances is clearly dominated by , leading to [Fe/H] , where the error estimate includes both internal and potential systematic errors.
4.1 Red Giants and Reddening
The red giants are often ignored in discussions of the reddening on the traditional Strömgren system because H becomes insensitive to changes in temperature among cooler stars, approaching a limiting index near 2.56 for increasing (see Fig. 2 of Twarog et al. (2015)). With the addition of , the giants take on added significance because of the very weak reddening dependence of the index coupled to a temperature dependence which is 2.5 times more sensitive than . To illustrate the point, in Fig. 7 we plot all the red giants of Fig. 4 with the same color (black) irrespective of location in the cluster field; black crosses are still giants identified as probable members based upon radial velocity, independent of the proper-motion membership probability. The blue line is the relation drawn defined only by the cluster members. The residuals about the mean relation have a dispersion of 0.010 mag. From the quoted photometric errors, the dispersion is predicted to be 0.004 0.002 mag. Since all the stars should have the same metallicity, and reddening effects on are six times smaller and in the opposite direction to the effects on , the dispersion in at a given should provide an indication of the size of the reddening spread across the face of the cluster. The upper limit on the spread in becomes mag. Considering that the quoted errors on the photometry are likely lower limits, that binaries and other giants with potential spectroscopic anomalies have not been eliminated, that giants at a given may be first-ascent, red-clump, or asymptotic giant branch stars where surface gravity changes may affect the color indices, we place a conservative upper limit to the reddening variation across the face of the cluster at 0.007 for or 0.01 , i.e. effectively 0.0.
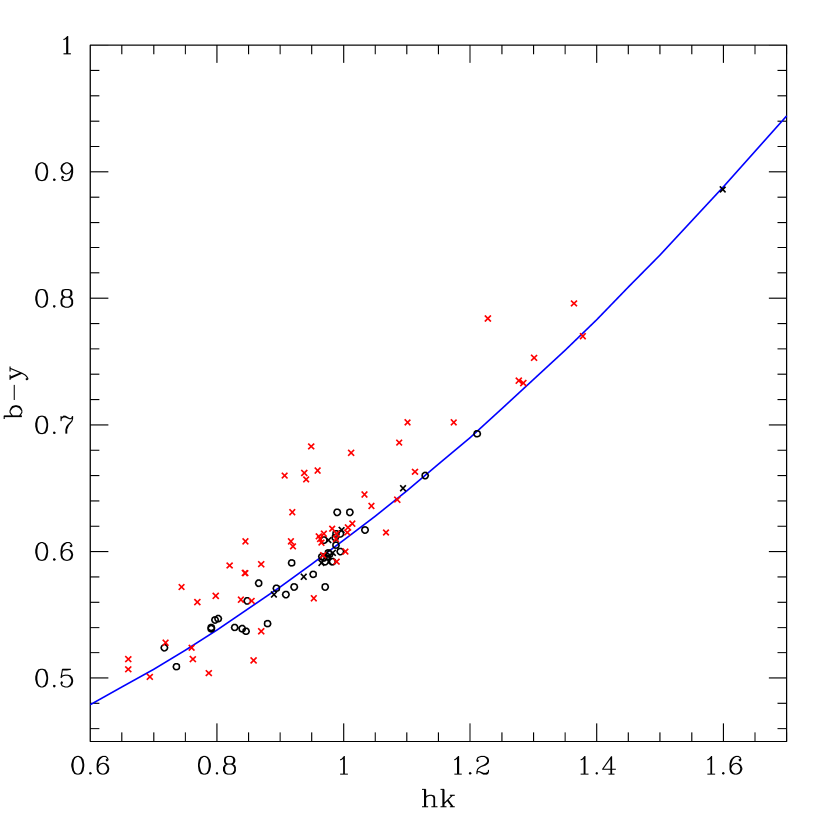
With the relation for cluster members well-defined, we can now add to Fig. 7 all stars outside the cluster core for which proper-motion and radial-velocity information is absent (red crosses). The large scatter of points away from and above the relation for the cluster confirms that the majority of these are field giants, likely background giants with higher reddening and likely lower metallicity than the cluster. There are, however, approximately two dozen stars which have positions consistent with cluster parameters, dominated by a rich concentration of a dozen stars at the colors of the clump ( (1.0, 0.6). Further observation and analysis of these candidates could add insight to the already rich red giant population of NGC 2506.
4.2 Age and Distance
Our entire analysis is based upon Strömgren photometry, so for consistency with our recent analysis of NGC 752 (Twarog et al., 2015), we turn to the Victoria-Regina isochrones (VandenBerg, Bergbusch, & Dowler, 2006) for simultaneous age and distance estimation. Fig. 8 shows the data of Fig. 4 with the isochrones for ages 1.7, 1.8, and 1.9 Gyr and [Fe/H] , the closest abundance to the derived metallicity of the cluster, superposed. The adopted best-fit, apparent modulus, assuming = 0.042 is = 12.75. The matches to the turnoff, subgiant, and giant branches are very good to excellent for an age between 1.8 and 1.9 Gyr. For the giant branch, it is intriguing to note that while the sequence below the level of the clump fits the observations well, the few stars brighter than the clump all lie at significantly brighter positions than implied by the isochrones, leading to the conclusion that these stars are binaries and/or asymptotic giant branch members of the cluster.
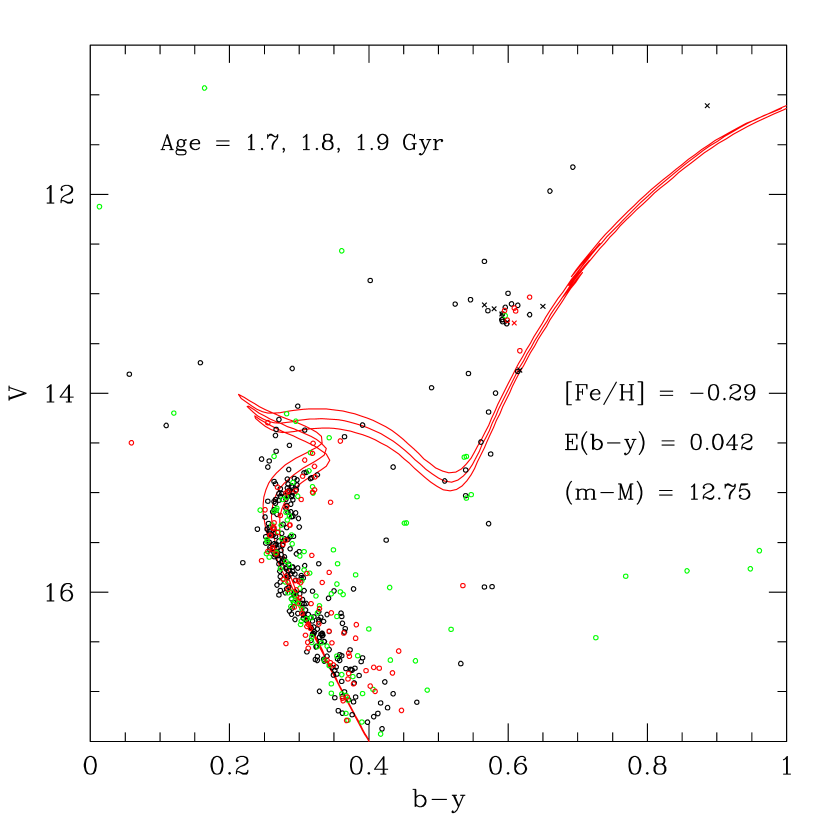
The impact of the difference between the true [Fe/H] and the isochrone value is small enough to ignore for the age estimate, though a more metal-poor isochrone would produce a slightly older age. With respect to the distance modulus, the more metal-rich main sequence overestimates the modulus by less than 0.03 mag, well within the uncertainties posed by variations in the reddening and the transformation of the isochrones from the theoretical plane to the observational.
4.3 Comparison With Previous Results
Since the direct measurement of for NGC 2506 using DDO photometry of 7 red giants in the field of the cluster (McClure, Twarog, & Forrester, 1981) produced 0.052 0.016, it has been clear that the cluster reddening is small. The reddening maps of Schlafly & Finkbeiner (2011), revising the earlier work of Schlegel, Finkbeiner, & Davis (1998), produce = 0.074 in the direction of the cluster, confirming a modest reddening even at large distance, primarily due to the large galactic latitude. Later investigations have adopted to 0.08 (Twarog, Ashman, & Anthony-Twarog, 1997; Carraro & Chiosi, 1994; Friel et al., 2002), derived values between 0.0 and 0.07 using isochrone fits which depend on the adopted [Fe/H] (Marconi et al., 1997; Lee, Kang, & Ann, 2012), or made direct determinations from multicolor photometry (, Kim et al. (2001)). Carretta et al, (2004) used spectroscopic temperatures coupled with photometry to obtain from 4 giants, a value adopted by Reddy, Giridhar, & Lambert (2012) and Arentoft et al. (2007). In summary, accounting for NGC 2506’s metal deficiency, the previously published values obtained by spectroscopic, photometric, and/or CMD analysis are consistent with = 0.055 0.020, in agreement with the value derived here. Equally important, changing the reddening by = 0.015 ( = 0.02) would alter the derived cluster age by less than 0.1 Gyr.
Metallicity comparisons can be challenging given the often different assumptions for reddening and for the zero-point of the metallicity scale upon which the measurement is based. The first direct metallicity estimate for NGC 2506 was based on a combination of DDO red giant photometry and photometry of both red giants and turnoff stars, leading to [Fe/H] relative to the Hyades, which defined the standard relations adopted in the analysis (McClure, Twarog, & Forrester, 1981). If [Fe/H] for the Hyades is assumed to be +0.12, this implied a cluster mean of . We note that values as high as +0.18 have been derived in recent studies (e.g., Dutra-Ferreira et al. (2016) and references therein). For reference, a virtually identical approach using the same calibration relations on NGC 752 (Twarog, 1983) led to [Fe/H] relative to the Hyades of , making it 0.20 dex more metal-rich than NGC 2506. The DDO system was later recalibrated (Twarog & Anthony-Twarog, 1996) but, not surprisingly, while the absolute scale shifted slightly, the differential offset remained basically the same, with [Fe/H] and for NGC 2506 and NGC 752, respectively (Twarog, Ashman, & Anthony-Twarog, 1997). The first spectroscopic work on NGC 2506 was the moderate-resolution spectroscopy of Friel & Janes (1993), who derived [Fe/H] on a scale where NGC 752 had [Fe/H] . This data set was revisited and recalibrated by Twarog, Ashman, & Anthony-Twarog (1997), who derived [Fe/H] and for NGC 2506 and NGC 752. The moderate-resolution spectroscopic data were expanded and recalibrated by Friel et al. (2002), producing [Fe/H] and for NGC 2506 and NGC 752. The often overlooked aspect of this final revision is that the definition of the metallicity scale included the clusters M67 and NGC 2420 as standards, assumed to have input [Fe/H] and , respectively, and generating derived values for these two clusters of and . The clear consensus from the photometric and moderate-dispersion spectroscopy is that NGC 2506 lies 0.20 to 0.30 dex below NGC 752 in [Fe/H].
As mentioned in the Introduction, high-dispersion spectroscopic abundances within NGC 2506 are few and far between. Carretta et al, (2004) analyzed 4 giants with an unweighted average of [Fe/H] (sd). Restricting the sample to only two clump giants, this became [Fe/H] (sd). The same four stars were reanalyzed by Mikolaitis et al. (2011), leading to [Fe/H] (sd). Finally, the spectroscopic work of Reddy, Giridhar, & Lambert (2012) generated [Fe/H] for 3 giants in NGC 2506 on a scale where 4 giants in NGC 752 led to [Fe/H].
For age and distance, we restrict our comparisons to values derived via direct comparison of cluster photometry to isochrones of appropriate vintage and metallicity. Netopil et al. (2016), e.g., quote a mean age of 1.625 0.429 from 20 age determinations published in the literature. Unfortunately, a check of the potential sources for these age estimates shows that most are outdated, of poor quality, and/or repetitions of values from other catalogs. An often-repeated source for the age of NGC 2506 is the listing in WEBDA at 1.1 Gyr (log t = 9.045), despite the fact that no isochrone fit to the cluster has at any time in the last 35 years generated an age this small. This anomalously low value has been propagated through other catalogs such as Dias et al. (2002); Tadross et al. (2002); Kharchenko et al. (2005), just to name a few. Even using basic CMD morphological parameters (Twarog & Anthony-Twarog, 1989; Janes & Demarque, 1983; Janes & Phelps, 1994; Carraro & Chiosi, 1994; Salaris, Weiss, & Percival, 2004) to determine age, NGC 2506 always occupies a position intermediate in age between NGC 752 and M67 and above 1.5 Gyr.
Following the original discussion by McClure, Twarog, & Forrester (1981), the first attempt to determine the age of NGC 2506 using isochrones incorporating convective overshoot mixing is that of Carraro & Chiosi (1994). With and [Fe/H] set at 0.08 and , they derived an age of 1.9 Gyr and an apparent modulus of . If we lower the reddening to 0.058 and raise the metallicity to , the effects on the distance modulus mostly cancel, leading to an increase in to just above 12.8. Likewise, lowering the reddening increases the age while raising the metallicity causes it to drop; without more details on the specific isochrones, the net change is impossible to estimate precisely. Marconi et al. (1997) explored a range of models and cluster parameters, where the exact values of optimum distance, reddening, age and metallicity varied with the isochrones under discussion. However, the optimal set of ages and distances ranged from 1.5 to 2.2 Gyr and to 12.7 for all plausible choices of reddening and metallicity.
Twarog, Anthony-Twarog, & Bricker (1999) used = 0.04 and isochrones with convective overshoot mixing at [Fe/H] to derive and an age of 1.9 Gyr. Measuring and using isochrones with [Fe/H] , Kim et al. (2001) found an age of 1.8 Gyr and and apparent modulus of . In both cases, raising the reddening makes the cluster slightly younger and increases the apparent modulus by 0.1 and 0.15 mag, respectively. The higher metallicity would also boost the distance modulus and slightly decrease the age.
Finally, Lee, Kang, & Ann (2012) have used unpublished photometry to obtain an optimal isochrone match for [Fe/H] , , and and an age of 2.31 Gyr. Raising the reddening and lowering the metallicity will lead to opposite effects on the age and distance modulus. No plausible shift in metallicity and/or reddening can bring this age estimate into agreement with the results of Fig.7.
5 Summary
NGC 2506 is an older open cluster which has long been classed as metal-deficient. The exact age and metallicity, critical for coherent interpretation of the evolutionary trends among the stars as revealed by their surface parameters and elemental abundances, have generally converged over the last 20 years toward an age between 1.7 and 2.0 Gyr and a metallicity between 0.2 and 0.3 dex less than the better-studied cluster NGC 752. Precision H CCD photometry covering a field , when coupled with membership information from proper motions and radial velocities, allows reliable isolation of the cluster from the field. Restricting the members to 257 turnoff stars within the ideal calibration range for the extended Strömgren system, the reddening is calculated as (), in excellent agreement with the range of published values from a variety of techniques. Moreover, contrary to past suggestions tied to inadequate photometry and membership information, there appears to be no evidence for significant variation in across the face of the cluster at a level greater than mag. The estimated metallicities from and are and , on a scale where NGC 752 has [Fe/H] and , respectively, again demonstrating that the cluster is typically 0.25 dex more metal-poor than NGC 752. Giving more weight to the -based metallicity due to its lower sensitivity to reddening changes and to zero-point uncertainties than , isochrones with and [Fe/H] define a cluster age of 1.85 Gyr for an apparent modulus of . With this age and metallicity, NGC 2506 occupies a key parameter space for mapping the impact of age and metallicity on the evolution of Li among stars of intermediate mass, comparable in age to NGC 3680 (1.75 Gyr) and IC 4651 (1.5 Gyr), but significantly more metal-poor than NGC 3680 () and IC 4651 () (Anthony-Twarog et al., 2009). The addition of two dozen potential red giant members of the cluster outside the core will permit a more detailed delineation of the effects of post-main-sequence evolution on the atmospheric Li, a point we will return to in a future discussion of our high-resolution Li spectroscopy.
References
- Anthony-Twarog, Atwell, & Twarog (2005) Anthony-Twarog, B. J., Atwell, J., & Twarog, B. A. 2005, AJ, 129, 872
- Anthony-Twarog et al. (2009) Anthony-Twarog, B. J., Deliyannis, C. P., Twarog, B. A., Croxall, K. V., & Cummings, J. 2009, AJ, 138, 1171
- Anthony-Twarog et al. (2010) Anthony-Twarog, B. J., Deliyannis, C. P., Twarog, B. A., Cummings, J. D., & Maderak, R. M. 2010, AJ, 139, 2034
- Anthony-Twarog et al. (2014) Anthony-Twarog, B. J., Deliyannis, C. P., & Twarog, B. A. 2014, AJ, 148, 51
- Anthony-Twarog et al. (2006) Anthony-Twarog, B. J., Tanner, D., Cracraft, M., & Twarog, B. A. 2006, AJ, 131, 461
- Anthony-Twarog & Twarog (2000) Anthony-Twarog, B. J., & Twarog, B. A. 2000, AJ, 119, 2282
- Arentoft et al. (2007) Arentoft, T., De Ridder, J., Grundahl, F., et al. 2007, A&A, 465, 965
- Carraro & Chiosi (1994) Carraro, G., & Chiosi, C. 1994, A&A, 287, 761
- Carraro et al. (2011) Carraro, G., Anthony-Twarog, B. J., Costa, E., Jones, B. J., & Twarog, B. A. 2011, AJ, 142, 127
- Carretta et al, (2004) Carretta, E., Bragaglia, A., Gratton, R. G., & Tosi, M. 2004, A&A, 422, 951
- Chiu & van Altena (1981) Chiu, L.-T. G., & van Altena, W. F. 1981, ApJ, 243, 827
- Cummings et al. (2012) Cummings, J. D., Deliyannis, C. P., Anthony-Twarog, B. J., Twarog, B. A., & Maderak, R. M. 2012, AJ, 144, 137
- Deliyannis et al. (2016) Deliyannis, C. .P, Anthony-Twarog, B. J., Lee-Brown, D. B., & Twarog, B. A. 2016, in prep.
- Dias et al. (2002) Dias, W. S., Alessi, B. S., Moitinho, A., & Lepine, J. R. D. 2002, A&A, 389, 871
- Dutra-Ferreira et al. (2016) Dutra-Ferreira, L., Pasquini, L., Smiljanic, R., Porto de Mello, G. F., & Steffen, M. 2016A&A, 585, A75
- Francois et al. (2013) Francois, P., Pasquini, L., Biazzo, K., Bonifacio, P., & Palsa, R. 2013, A&A, 552, 136
- Friel & Janes (1993) Friel, E. D., & Janes, K. A. 1993, A&A, 267, 75
- Friel et al. (2002) Friel, E. D., Janes, K. A., Tavarez, M., et al. 2002, AJ, 124, 2693
- Handler & Shobbrook (2002) Handler, G., & Shobbrook, R. R. 2002, MNRAS, 333, 251
- Hauck & Mermilliod (1998) Hauck, B., & Mermilliod, M. 1998, \aas, 129, 431
- Jacobson, Friel, & Pilachowski (2011) Jacobson, H. R., Friel, E. D., & Pilachowski, C. A. 2011, AJ, 141, 58
- Jacobson, Pilachowski, & Friel (2011) Jacobson, H. R., Pilachowski, C. A., & Friel, E. D. 2011, AJ, 142, 59
- Janes & Demarque (1983) Janes, K. A., & Demarque, P. 1983, ApJ, 264, 206
- Janes & Phelps (1994) Janes, K. A., & Phelps, R. L. 1994, AJ, 108, 1773
- Kaluzny & Shara (1988) Kaluzny, J., & Shara, M. M. 1988, AJ, 95, 785
- Kim et al. (2001) Kim, S.-L., Chun, M.-Y., Park, B.-G., et al. 2001, Acta Astron., 51, 49
- Kharchenko et al. (2005) Kharchenko N. V., Piskunov A. E., Röser S., Schilbach E., & Scholz R.-D. 2005, A&A, 438, 1163
- Lee, Kang, & Ann (2012) Lee, S. H., Kang, Y.-W., & Ann, H. B. 2013, MNRAS, 425, 1567
- Lee, Kang, & Ann (2013) Lee, S. H., Kang, Y.-W., & Ann, H. B. 2013, MNRAS, 432, 1672
- Maderak et al. (2013) Maderak, R. M., Deliyannis, C. P., King, J. R., & Cummings, J. D. 2013, AJ, 146, 143
- Marconi et al. (1997) Marconi, G., Hamilton, D., Tosi, M., & Bragaglia, A. 1997, MNRAS, 291, 763
- McClure, Twarog, & Forrester (1981) McClure, R. D., Twarog, B. A., & Forrester, W. T. 1981, ApJ, 243, 841
- Mermilliod & Mayor (2007) Mermilliod, J.-C., & Mayor, M. 2007, A&A, 470, 919
- Mermilliod, Mayor, & Udry (2008) Mermilliod, J.-C., Mayor, M., & Udry, S. 2008, A&A, 485, 303
- Mikolaitis et al. (2011) Mikolaitis, S., Tautvaišienė, G., Gratton, R., Bragaglia, A., & Carretta, E. 2011, MNRAS, 416, 1092
- Netopil et al. (2016) Netopil, M., Paunzen, E., Heiter, U., & Soubiran, C. 2016, A&A, 585, A150
- Nissen (1988) Nissen, P. E. 1988, AJ, 199, 146
- Nissen et al. (1987) Nissen, P. E., Twarog, B. A. & Crawford, D. L. 1987, AJ, 93, 634
- Olsen (1983) Olsen, E. H. 1983, A&AS, 54, 55
- Olsen (1988) Olsen, E. H. 1988, A&A, 189, 173
- Olsen (1993) Olsen, E. H. 1993, A&AS, 102, 89
- Olsen (1994) Olsen, E. H. 1994, A&AS, 106, 257
- Pancino et al. (2010) Pancino, E., Carrera, R., Rossetti, E., & Gallart, C. 2010, A&A, 511, 56
- Reddy, Giridhar, & Lambert (2012) Reddy, A. B. S., Giridhar, S., & Lambert, D. L. 2012, MNRAS, 419, 1361
- Salaris, Weiss, & Percival (2004) Salaris, M., Weiss, A., & Percival, S. M. 2004, A&A, 414, 163
- Sales Silva et al. (2016) Sales Silva, J. V., Carraro, G., Anthony-Twarog, B. J., et al. 2016, AJ, 151, 6
- Schlafly & Finkbeiner (2011) Schlafly, E. F., & Finkbeiner, D. P. 2011, ApJ, 737, 103
- Schlegel, Finkbeiner, & Davis (1998) Schlegel, D. J., Finkbeiner, D. P. & Davis, M. 1998, ApJ, 500, 525
- Schmidt (1984) Schmidt, E. G. 1984, ApJS, 55, 455
- Snowden (1975) Snowden, M. S. 1975, PASP, 87, 721
- Tadross et al. (2002) Tadross A. L., Werner P., Osman A., & Marie M. 2002, New A, 7, 553
- Twarog (1983) Twarog, B. A. 1983, ApJ, 267, 207
- Twarog & Anthony-Twarog (1989) Twarog, B. A., & Anthony-Twarog, B. J. 1989, AJ, 97, 759
- Twarog & Anthony-Twarog (1995) Twarog, B. A., & Anthony-Twarog, B. J. 1995, AJ, 109, 2828
- Twarog & Anthony-Twarog (1996) Twarog, B. A., & Anthony-Twarog, B. J. 1996, AJ, 112, 1500
- Twarog, Anthony-Twarog, & Bricker (1999) Twarog, B. A., Anthony-Twarog, B. J., & Bricker, A. R. 1999, AJ, 117, 1816
- Twarog et al. (2015) Twarog, B. A., Anthony-Twarog, B. J., Deliyannis, C. P., & Thomas, D. T. 2015, AJ, 150, 134
- Twarog, Ashman, & Anthony-Twarog (1997) Twarog, B. A., Ashman, K., & Anthony-Twarog, B. A. 1997, AJ, 114, 2556
- VandenBerg, Bergbusch, & Dowler (2006) VandenBerg, D. A., Bergbusch, P. A., & Dowler, P. D. 2006, ApJS, 162, 375